The nuclear X-ray emission of nearby early-type galaxies
Abstract
Nuclear hard X-ray luminosities () for a sample of 112 early type galaxies within a distance of Mpc are used to investigate their relationship with the central galactic black hole mass (coming from direct dynamical studies or the relation), the inner galactic structure (using the parameters describing its cuspiness), the hot gas content and the core radio luminosity. For this sample, ranges from to erg s-1, and the Eddington ratio /from to , with the largest values belonging to four Seyfert galaxies. Together with a trend for to increase on average with the galactic luminosity and , there is a wide variation of (and /), by up to 4 orders of magnitude, at any fixed or . This large observed range should reflect a large variation of the mass accretion rate , and possible reasons for this difference are searched for. On the circumnuclear scale, in a scenario where accretion is (quasi) steady, at fixed (or ) could vary due to differences in the fuel production rate from stellar mass return linked to the inner galactic structure; a trend of with cuspiness is not observed, though, while a tendency for /to be larger in cuspier galaxies is present. In fact, is predicted to vary with cuspiness by a factor exceeding a few only in hot gas poor galaxies and for large differences in the core radius; for a subsample with these characteristics the expected effect seems to be present in the observed values. does not show a dependence on the age of the stellar population in the central galactic region, for ages3 Gyr; less luminous nuclei, though, are found among the youngest galaxies or galaxies with a younger stellar component. On the global galactic scale, shows a trend with the total galactic hot gas cooling rate (): it is detected both in gas poor and gas rich galaxies, and on average increases with , but again with a large scatter. The observed lack of a tight relationship between and the circumnuclear and total gas content can be explained if accretion is regulated by factors overcoming the importance of fuel availability, as 1) the gas is heated by black hole feedback and varies due to an activity cycle, and 2) the mass effectively accreted by the black hole can be largely reduced with respect to that entering the circumnuclear region, as in radiatively inefficient accretion with winds/outflows. Finally, differently from , the central 5 GHz VLA luminosity shows a clear trend with the inner galactic structure, that is similar to that shown by the total soft X-ray emission; therefore it is suggested that they could both be produced by the hot gas.
Subject headings:
galaxies: elliptical and lenticular, CD — galaxies: fundamental parameters — galaxies: nuclei — X-rays: galaxies – X-rays: ISM1. Introduction
In the past years, high angular resolution studies of the centers of early type galaxies have been performed with the () in the optical and near infrared, and in the X-rays with , obtaining important results that deeply influenced our understanding of the nature and past evolution of these systems. The first, major result was that massive black holes (MBHs) are ubiquitous in the centers of spheroids, and linked by tight relationships with the luminosity and central stellar velocity dispersion of their hosts (e.g., Magorrian et al. 1998, Ferrarese & Merritt 2000, Gebhardt et al. 2000), indicative of a strong mutual influence during their formation and evolution. The second result was that the central brightness profiles of galaxies with show either steep brightness cusps or, interior to a break radius , they flatten markedly in a core with respect to an inner extrapolation of the outer profile. These profiles have been described respectively by a Sérsic or core-Sérsic law (Graham et al. 2003, Trujillo et al. 2004, Ferrarese et al. 2006, Kormendy et al. 2009) or alternatively by the ”Nuker law” (Faber et al. 1997, Lauer et al. 2007a). Cores dominate at the highest luminosities and steep cusps at the lowest, with an intermediate luminosity region of coexistence (, Lauer et al. 2007a). The shape of the brightness profile in the inner galactic region has been related to the past formation and evolution of galaxies, with cores created during dry merging events by a black hole binary ejecting stars from the center of the new system (Ebisuzaki et al. 1991, Faber et al. 1997, Milosavljevic et al. 2002, Graham 2004, Gualandris & Merritt 2008), and cusps being preserved or (re)generated during gaseous (wet) mergings. Recently, it was found that coreless elliptical galaxies in the Virgo cluster have extra-light at their center, above the inward extrapolation of their outer Sérsic profile (Kormendy et al. 2009), the result of a wet merger induced starburst (see also Hopkins et al. 2009a) or of AGN induced starburst activity (Ciotti & Ostriker 2007). Moreover, the presence of steep cusps or cores correlates with other fundamental galactic properties, even more tightly than how these properties correlate with the galatic luminosity: core galaxies generally have boxy isophotes, are slow rotators and triaxial systems, while cusp galaxies are disky, fast rotators and axisymmetric (Kormendy & Bender 1996, Faber et al. 1997); core galaxies show a large range of radio and X-ray luminosities, while cusp galaxies are confined below a threshold (Bender et al. 1989; Pellegrini 1999, 2005a; Capetti & Balmaverde 2005; Pasquali et al. 2007). Pellegrini (2005a) also attempted an investigation of the relation between the X-ray nuclear emission () and the inner core/cusp profile, but the study was limited by the small number of nuclei with known available.
Launched in 1999, the satellite has now pointed a large number of early type galaxies, with an unprecedented angular resolution in the X-rays of less than . For the first time measurements of the nuclear X-ray emission down to values as low as erg s-1 and out to distances of Mpc have been obtained. The MBHs of the local universe turned out to be typically radiatively quiescent and very sub-Eddington emitters (Loewenstein et al. 2001, Soria et al. 2006a, Zhang et al. 2009, Gallo et al. 2008, 2010). In a number of cases the mass accretion rate on the MBH could be estimated (e.g., Di Matteo et al. 2003, Pellegrini 2005b) and the radiative quiescence was interpreted in terms of radiatively inefficient accretion (Narayan & Yi 1995), possibly with the mechanical power dominating the total output of accretion (e.g., Allen et al. 2006). However, many aspects of accretion in the local universe remain unknown: what determines ? Is there any relation of or its Eddington-scaled value with the galactic luminosity or the mass of the central supermassive black hole ? or with the inner stellar profile, that has been linked to the past galactic evolution and other major global galactic properties? or with the hot gas content? Answering these questions is important for a complete understanding of the MBH-host galaxy coevolution process.
In this work we have collected all early type galaxies (E and S0) out to a distance of Mpc with known , based mostly on data coming from pointings; a total of 112 galaxies resulted with measured or with an upper limit on it. The sample includes also most of the early type galaxies with a direct measurement of via dynamical studies currently available; for the other galaxies, the central stellar velocity dispersion allows for an estimate of via the relation. For 81 of these 112 galaxies the central stellar profile shape has been measured with . The sample is described in Sect. 2, the observational evidences about relationships between , , the central stellar structure and the radio luminosity are presented in Sect. 3, the results are discussed in Sect. 4 (that examines also the relationship between and the galactic hot gas luminosity); the conclusions are summarized in Sect. 5.
2. The sample
The morphological type of the sample includes E and S0 objects, that is early type galaxies with numerical code t according to the revised de Vaucouleurs morphological type defined in RC2. A distance limit of Mpc was set to allow for the possibility of a measurement of (or an upper limit on it) with down to erg s-1 even for the most distant objects, and of a measurement of the inner light profile from data for a large fraction of the objects (most cores have a radius pc). A selection of galaxies with the chosen morphological properties and distance limit was performed with the Hyperleda catalog222 http://leda.univ-lyon1.fr. The resulting list was then cross-correlated with the list of pointings, using the Web ChaSeR (Chandra Archive Search and Retrieval Interface333 http://asc.harvard.edu/cda/chaser.html), to find the objects with X-ray information on their nuclei. Published works as of December 2009 based on these pointings provide a detection or upper limit for the nuclear luminosity for 97 galaxies. In order to avoid possible contamination from soft hot gaseous emission, was taken in the 2–10 keV band, or converted to it based on the spectral shape used to derive it. The object list, with adopted distances, values and references for them, is given in Tab. 1.
For the objects in this list, the light profile shape in the inner regions was then searched. Two central slopes have been considered previously (Lauer et al. 1995, Rest et al. 2001, Lauer et al. 2007a): , the local slope evaluated at the angular resolution limit, and , the slope describing the brightness profile interior to a break radius , when adopting a “Nuker law” profile description (a broken power law with a smooth transition from the outer slope to the inner slope ). Steep inner cusps have and larger than 0.5, and their host galaxies are called ”power law” or ”cusp” galaxies; cores have and smaller than (with % of galaxies with that have ); “intermediate” systems are a minority and have or between 0.3 and 0.5. In core galaxies a well defined break radius marks a rapid transition from the outer profile to a much shallower inner slope; cusp galaxies retain a steep slope into the resolution limit. The definition of what constitutes a core (i.e., a break with respect to a Sérsic function fitted to the outer profile, or an inner slope in the Nuker function fit) is different for the two descriptions using the two functions, but gives the same classification as core or cusp galaxy for most galaxies (Kormendy et al. 2009). For most of the galaxies in table 1, the inner profile shape comes from the large compilation of Lauer et al. (2007a), who combined the results of previous HST investigations of the central structure of early-type galaxies, after transformation to a common band and distance scale; for other 18 galaxies the Nuker law description of the profile is taken from Capetti & Balmaverde (2005; these are marked in col. 5 in Tab. 1). For the purpose of investigating the relationship between and the inner galactic structure with as many objects as possible, the initial sample of 97 galaxies was enlarged with 15 objects with inner slope measured. Of these, 7 follow all the adopted selection criteria, but their comes from HRI pointings (with an angular resolution of , from Liu & Bregman 2005); the other 8 galaxies, with from data, have a type later than t=-2, though still within the S0 range444These 8 galaxies are NGC7743 (t=-0.9), NGC524, NGC3945 (t=-1.2), NGC4382, NGC5866 (t=-1.3), NGC4459, NGC4111 (t=-1.4), NGC1316 (t=-1.7). For reference, type S0a has t=0.. Tab. 1 then includes 112 galaxies, 47 of core type, 7 intermediate, and 27 of cusp type. The profile classification (cusp or core) is based on the value of , given in tab. 1; this classification is always coincident with that given by , except for 7 cases that become ”cuspier” when considering instead of 555These are 5 cores and one intermediate that become cusps, and one core that becomes intermediate; all these cases are marked in the following figures with a special symbol, as explained in the captions. Note that all galaxies with in Tab. 1 have (from the apparent magnitudes in Hyperleda, and for the distances adopted in Tab. 1), a luminosity range where low values are associated only to cores in massive ellipticals, and high ’s unequivocally identify coreless galaxies (Trujillo et al. 2004, Lauer et al. 2007a).. The results of this work are unchanged when using instead of . Other quantities used in the following and not given in Tab. 1 are the break radii and effective radii ; these are taken from Lauer et al. (2007a) and Capetti & Balmaverde (2005); ranges from a few parsecs to few hundreds of parsecs.
Finally, Tab. 1 lists the masses of the central MBHs, taken from specific measurements for a number of galaxies, and from the relation for the other cases, as specified in the table. The adopted relation is that recently derived for ellipticals (Gültekin et al. 2009), in which the central stellar velocity dispersion from the Hyperleda catalog is inserted; this relation has an intrinsic scatter of 0.31 dex in log. Note that values estimated from the relation of early type galaxies (where is the V-band luminosity; Gültekin et al. 2009) can be larger than those derived from the relation, for [see also Gallo et al. (2008)].
The galaxies in Tab. 1 reside in all types of environment, going from being isolated to being at the center of a cluster (as NGC4486 in Virgo) or a group. They also span a large range of activity, from being classified as an optical or radio AGN (e.g., Seyfert or FRI) to inactive. Their optical nuclear spectra have been classified as absorption nuclei (i.e., without emission lines) or, when emission lines are present, mostly as LINERs, with a minority of Seyfert and transition nuclei (intermediate between HII and LINERs; Ho et al. 1997).
3. Observational results
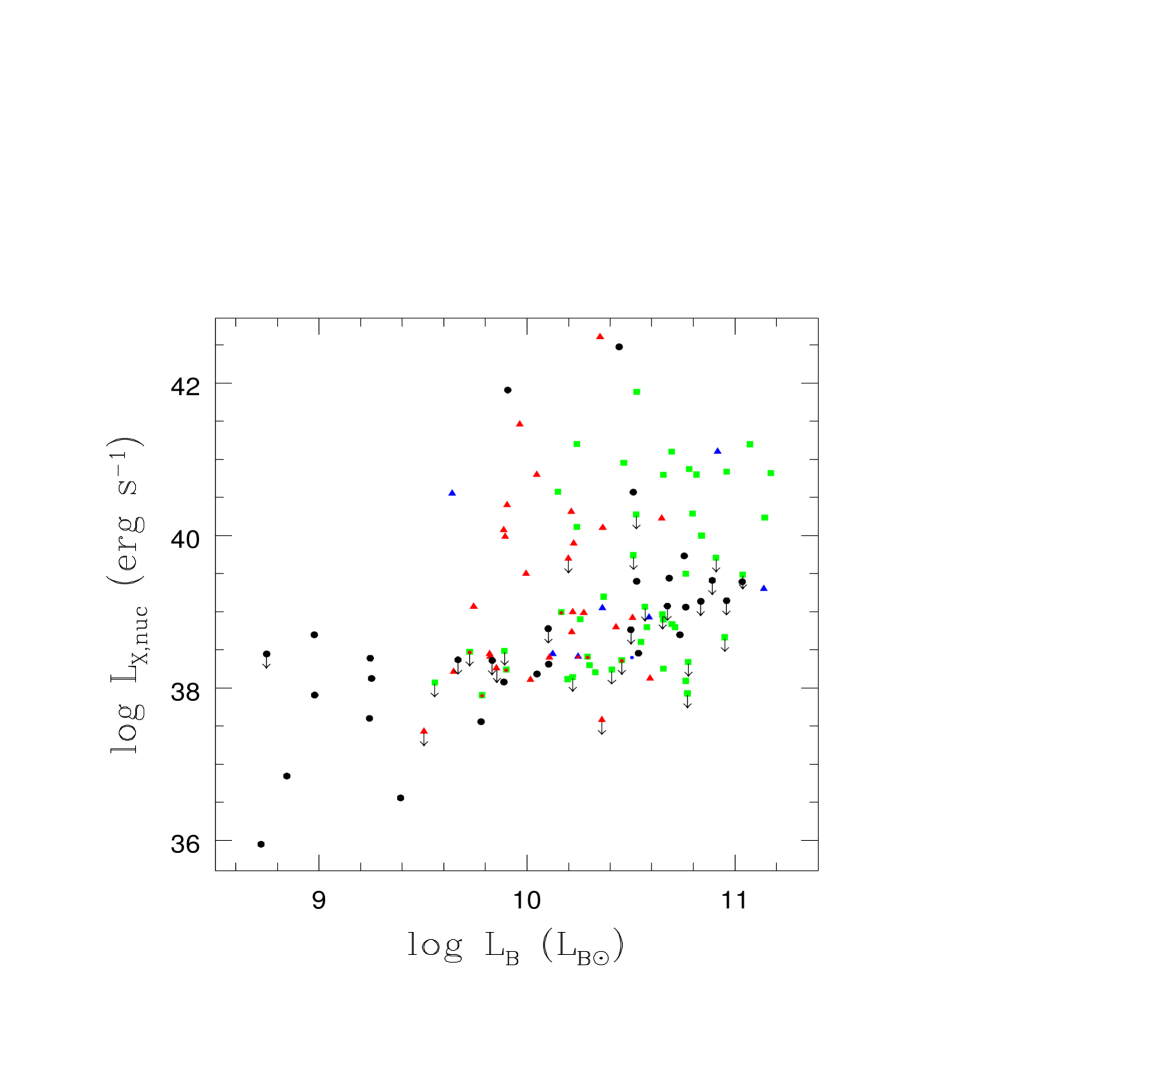
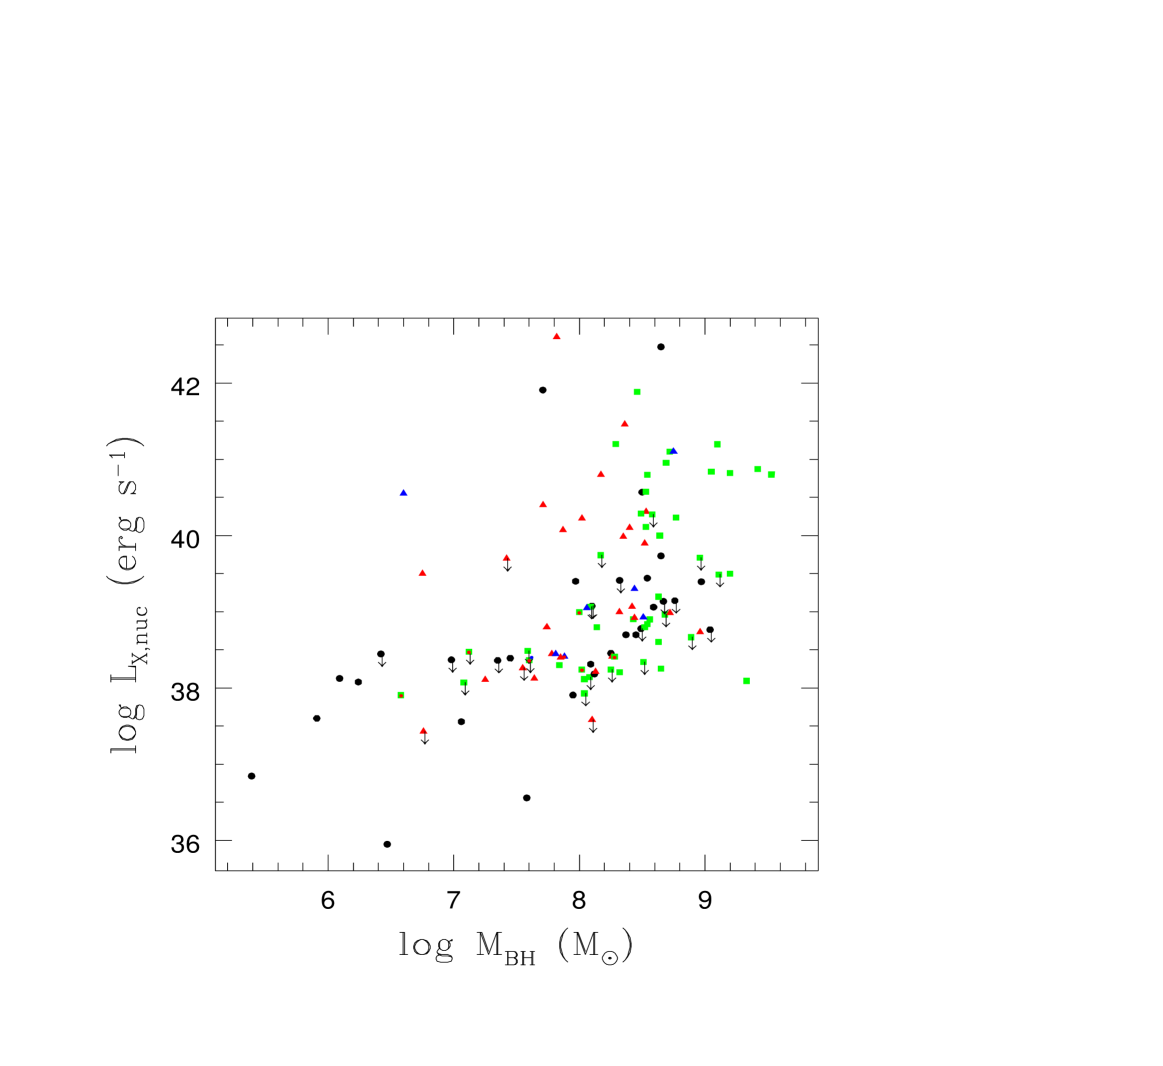
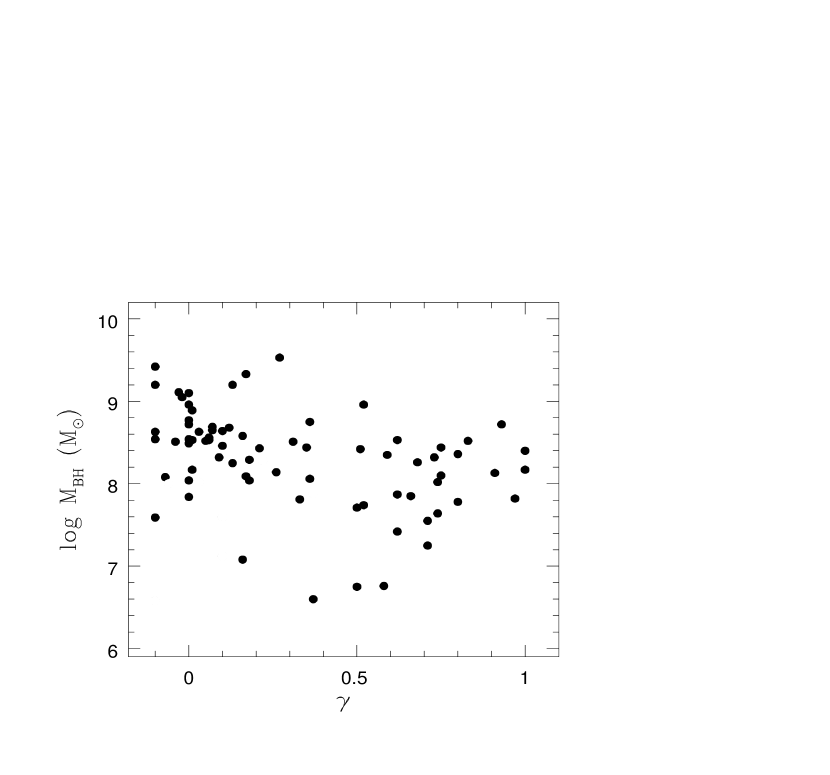
Figure 1 shows the relationship between and the B-band galactic luminosity . Considering the whole range, increases on average with . However, in the well populated region of the plot, for , does not present a clear trend with but shows instead a very large scatter of orders of magnitude, going from the lowest detectable values in the nearest galaxies ( erg s-1) to the highest values ( erg s-1) that belong to Seyfert nuclei (NGC2110, NGC3516, NGC5128, NGC5283; all these are S0 galaxies, consistent with the observation that Seyfert nuclei reside mostly in spirals and S0s, e.g., Malkan et al. 1998). Similar considerations hold for fig. 2, where is replaced by , as expected given the Magorrian relation between the spheroid luminosity and the MBH mass (Magorrian et al. 1998): there is an overall trend for to increase with , but in the well populated region, for M⊙, shows a very large scatter, of orders of magnitude. Figures 1 and 2 show cusp and core galaxies being more frequent respectively at the lowest and highest (and ) values, but with a large intermediate region of overlap; more importantly, these figures also show that both types cover the whole large range of .
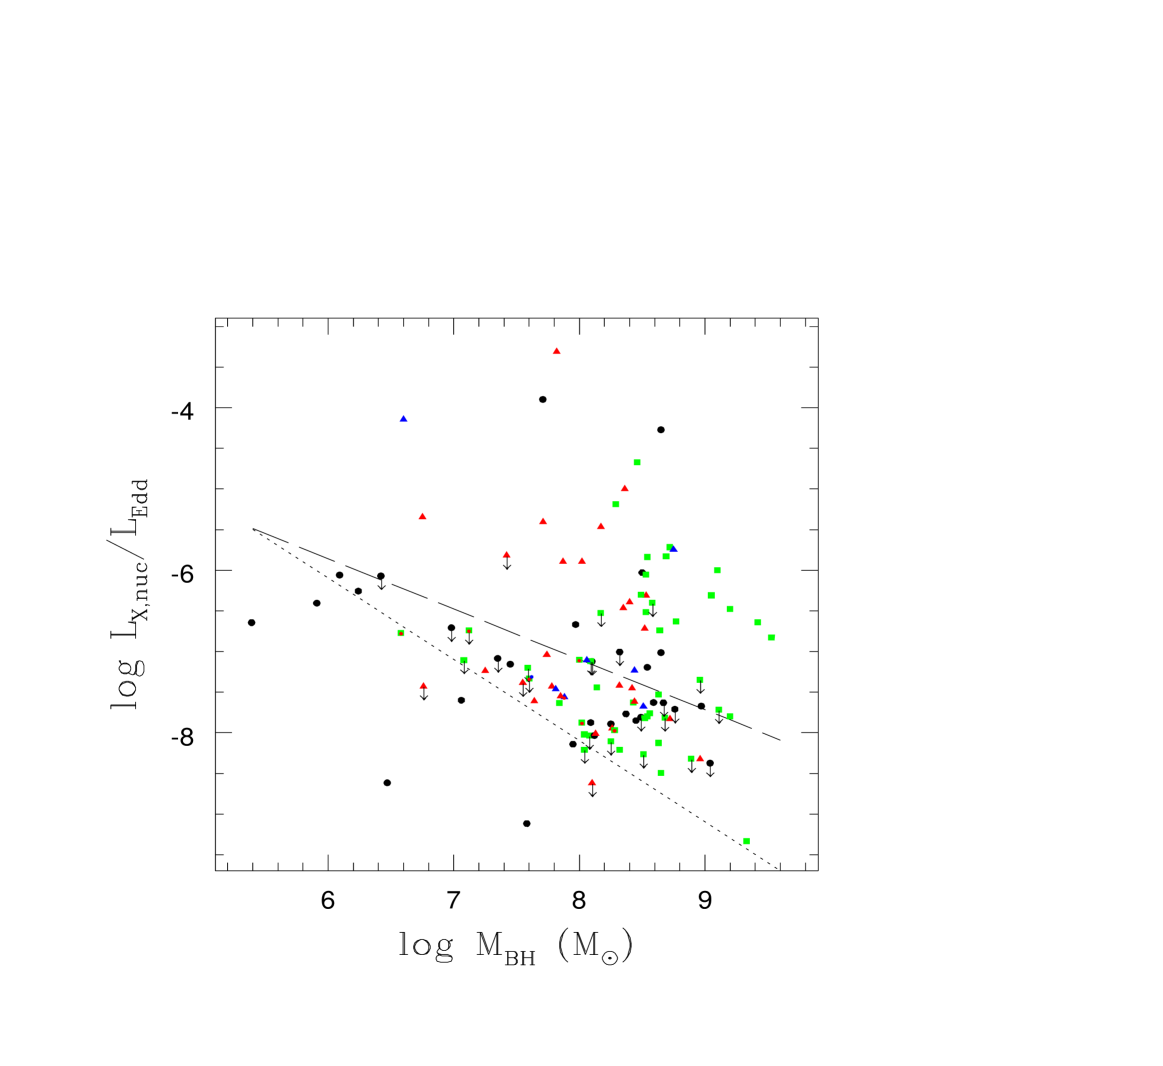
Figure 3 shows the relation between scaled by the Eddington luminosity [i.e., /, where =(M⊙) erg s-1] and . Since is proportional to , the lower envelope of the values in fig. 2 (a straight horizontal line at erg s-1) translates in a lower envelope of /values that is a line with slope -1, shown in fig. 3 as a dotted line. Above this line, a large scatter of orders of magnitude in /is evident also in this plot. Again, both core and cusp galaxies cover a large range of /; in this case, though, the ”cuspier” types seem to reach highest Eddington ratios of and the core types to be confined below /. Except for few very nearby galaxies, Eddington ratios similarly low cannot be reached at the lowest and at the highest values, due to the limit marked by the dotted line; but the highest Eddington ratios, for which there are no limits, tend to correspond to the lower . A similar result was obtained for nearby late type galaxies (Zhang et al. 2009) and for the 100 spheroidal galaxies of the ACS Virgo cluster survey studied by Gallo et al. (2010). In the latter survey, was estimated with down to a limit of L(0.5-7 keV) erg s-1 for a sample with stellar masses peaking below and MBH masses below ; the Eddington ratio was found to decrease on average as -0.62, with a scatter of 0.46 dex. This trend is consistent with the distribution of the values in fig. 3, though the large scatter here dominates. The average decrease of the Eddington ratio with increasing was interpreted as a manifestation of down-sizing in black hole accretion (Gallo et al. 2010, Schawinski et al. 2010).
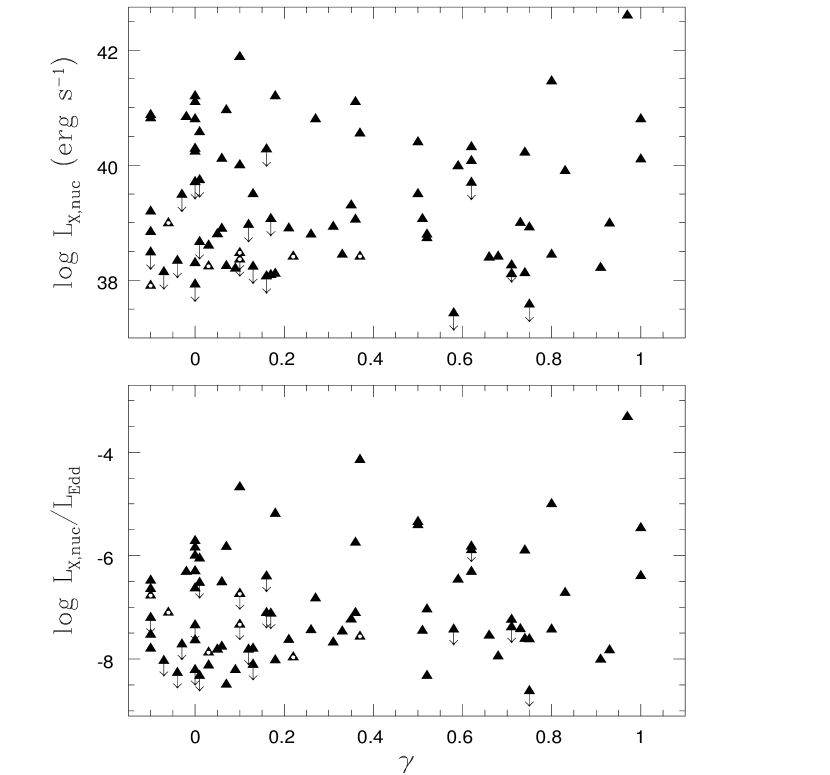
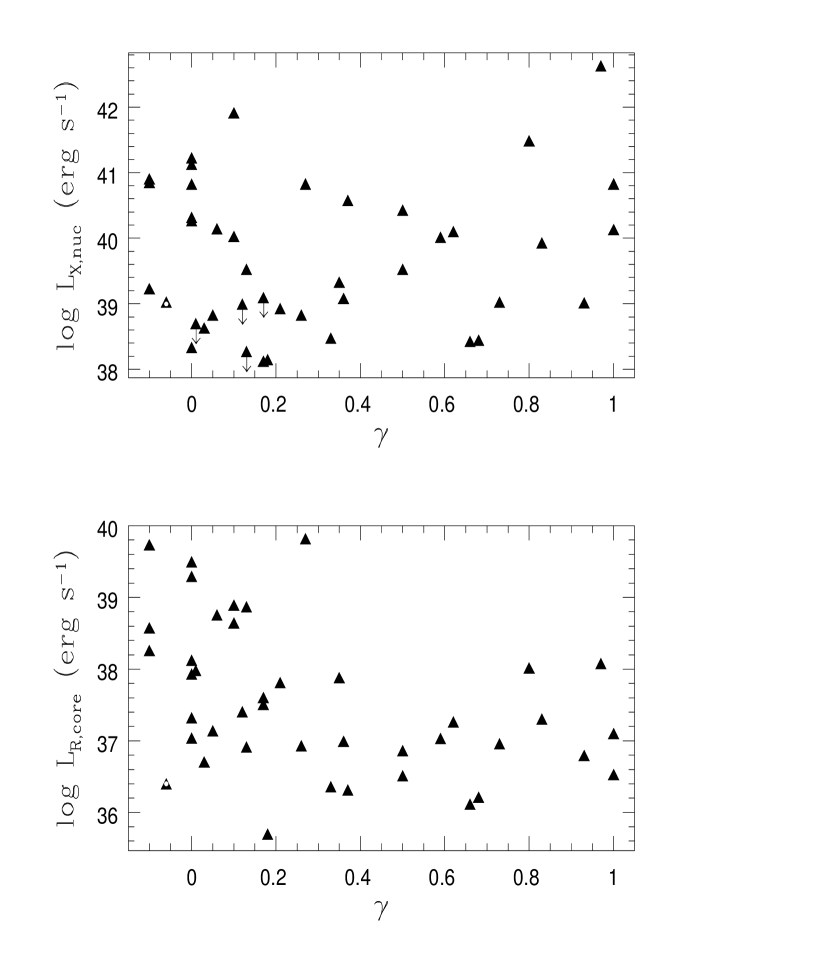
In order to better evidence any possible relationship between and the inner light profile, and /were plotted against the slope of the central light profile (fig. 4). As already suggested by figs. 1 and 2, fig. 4 shows that spans the whole large range of values, from to erg s-1, at all ’s. A similar result holds for /(fig. 4, lower panel), though here the highest /values among core galaxies remain lower than those of intermediate and cusp galaxies, as seen from fig. 3. This possible increase of the upper envelope of values of /with , though requiring a larger and complete sample for a firm conclusion, may be real, given that the galaxies considered here already include more core than cusp cases, and that such an increase is expected to arise, when considering the trend for the Eddington ratio to increase for decreasing (fig. 3), and the trend for to decrease on average with increasing (as shown in fig. 5 for the present sample). This latter behavior is a consequence of the Magorrian - relation coupled with the weak anti-correlation (Faber et al. 1997 and Sect. 1). Another possible reason for an increase of /with is discussed in Sect. 4.1.
Finally, to explore further a possible link with the inner galactic structure, we also considered the relation of with the break radius , and with rescaled by . Only core galaxies were considered, for which is a representative scale for the radial extent of the core (Lauer et al. 2007b). When plotted against , covers the same large range of values differing by orders of magnitude already seen in the previous figures, and shows no trend with or . The same holds for /.
3.1. The different relation with cuspiness of and the radio luminosity
As mentioned in Sect. 1, for a sample of galaxies with central light profiles measured from data, and with 5 GHz radio fluxes estimated from a VLA survey with a FWHM resolution, Capetti & Balmaverde (2005) found the radio emission of core galaxies to cover a large range of values, differing by orders of magnitude, while that of cusp galaxies to be confined below W Hz-1. The origin of this threshold in radio luminosity for cusp galaxies remained ambiguous, because galaxies with a higher intrinsic optical luminosity have a higher probability to be strong radio emitters, with respect to less luminous galaxies (e.g., Mauch & Sadler 2007). This is true also for the Capetti & Balmaverde (2005) sample, whose relation (where is the K-band absolute magnitude) shows no radio source with above the threshold of W Hz-1 associated to a host with . Since there are only few cusp galaxies in their sample with , it cannot be concluded whether the threshold is related to a different nuclear structure, or to cusp galaxies populating scarcely the range where the brightest radio sources are found.
Both the radio and the X-ray emission are signatures of MBH accretion, but fig. 4 (upper panel) shows clearly the lack of a threshols for similar to that found for ; therefore, the behavior of and with respect to the presence of a core in the stellar light profile is here revisited. Figure 4 was then remade just for the Capetti & Balmaverde (2005) sample, that includes 51 objects, 42 of which are in Tab. 1; all these 42 galaxies have , a luminosity range where low values are associated only to cores in massive ellipticals (Trujillo et al. 2004). For this sample, figure 6 shows the relationship between and the 5 GHz core luminosity from the VLA survey (taken from Capetti & Balmaverde 2006 or Balmaverde & Capetti 2006, and rescaled for the distances in tab. 1). The figure shows again a different behavior with respect to of and of : while there is an L-shape distribution of with respect to the inner light profile, with galaxies of all types below erg s-1 and only core galaxies above, shows the same lack of a threshold found in fig. 4. We note that the VLA radio data used to derive the luminosities in fig. 6 do not separate well the core emission from any extended structure, and they tend to overestimate the core flux when there is extended radio emission (Balmaverde & Capetti 2006). These findings are discussed in Sect. 4.4.
4. Discussion
Hard X-ray emission is a major signature of accretion on a MBH, both in the standard disk plus hot corona modality (Haardt & Maraschi 1993) and in the radiatively inefficient modality (RIAF, Narayan & Yi 1995) that is expected to establish at the low Eddington ratios of the sample investigated here (fig. 3). In fact, the nuclei in this sample are highly sub-Eddington for any bolometric correction that can be plausibly adopted: from for low luminosity AGNs, as indicated by observations (e.g., Ho 2008) and by the RIAF modeling (Mahadevan 1997), up to 40–70 for standard, bright AGNs (Vasudevan & Fabian 2007). For radiatively inefficient accretion should scale inversely proportional to , at fixed mass accretion rate on the MBH, (Mahadevan 1997; see also Körding et al. 2006). What instead dominates in fig. 1 is a wide variation of by 3–4 orders of magnitude at any fixed . A large variation of of a similar extent was obtained also for other local samples, made of galaxies of types later than that discussed here and residing within 15 Mpc (Zhang et al. 2009), or for the nuclei in the Palomar survey (Ho 2009).
Intrinsic variability of cannot account entirely for the large spread in figs. 1–3, since amplitude variations of low luminosity AGNs are typically small (Ptak et al. 1998) and the largest keep within a factor of a few (Pian et al. 2009). The large range of and of /means then that physical quantities other than the size of play an important role. In the RIAF models a number of parameters describe the complex physics of accretion (e.g., the ratio of gas to magnetic pressure, the viscosity, the turbulent energy that heats the electrons), but their variation is not expected to account for differences as large as those in figs. 1–3 (e.g., Di Matteo et al. 2003). Another major parameter determining is the mass accretion rate on the MBH, ; for example, at fixed , scales as for radiatively inefficient flows (Narayan & Yi 1995). Below we discuss possible variations of produced by the inner galactic structure, that determines how much mass is shed by stars in the circumnuclear region and then the fuel available for the MBH. In fact, the present sample is defined morphologically to include galaxies with a typically old stellar population, and in these systems the black hole growth is regulated by the rate at which evolved stars lose their mass, as shown for a large sample of nearby galaxies drawn from the Sloan Digital Sky Survey (Kauffmann & Heckman 2009). In the following Section 4.1 we assume that accretion is a (quasi) steady process; then in Section 4.3 we consider the possibility that accretion is unsteady.
4.1. The mass accretion rate, the inner galactic structure and the total gas content
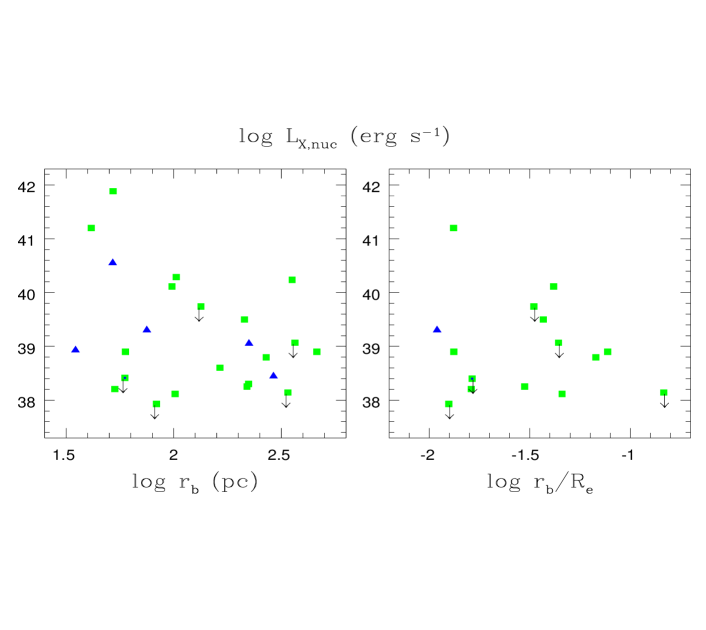
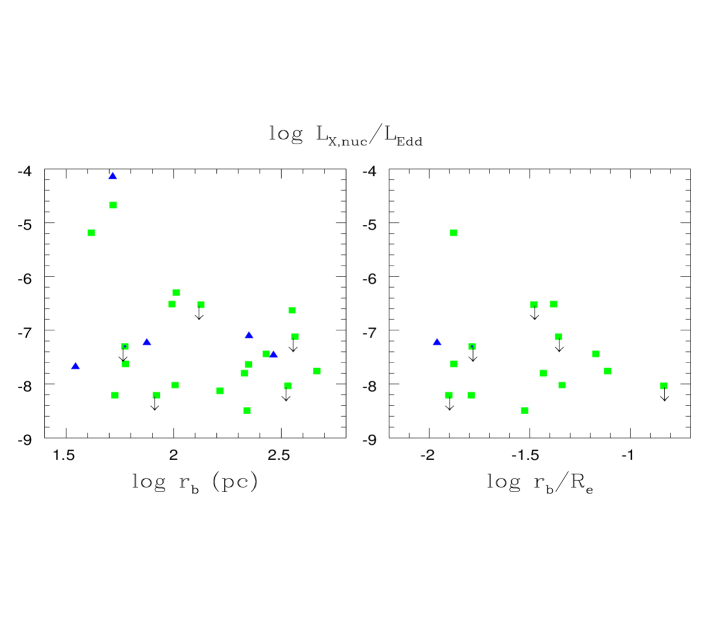
Numerical simulations of the collective evolution of stellar mass losses (Parriott & Bregman 2008), for stellar mass distributions as steep as revealed by in the central galactic region, showed that they establish an inflow towards the MBH (Pellegrini & Ciotti 1998, Pellegrini et al. 2007a). The size of the inflowing region can range from being of the order of the MBH accretion radius ( pc for typical values of the ISM temperature and =, e.g., Soria et al. 2006a) to few kpc. The stellar mass losses within then make up the fuel to which should be proportional. Since the rate at which a given volume of a galaxy is replenished by mass losses from stars during their passive evolution is just proportional to the local stellar luminosity (e.g., Ciotti et al. 1991, David et al. 1991), and then should depend on the shape of the stellar density within . On average, core galaxies have a lower central surface brightness and central stellar density than cusp ones (Faber et al. 1997, Gebhardt et al. 1996, 2003, Kormendy et al. 2009), and core galaxies with larger cores have a lower central density than those with smaller cores. This determines that, at similar (or equivalently ), cusp galaxies produce locally more fuel for accretion than core ones, and galaxies with smaller produce more fuel than those with larger , which should correspond to a higher and /666Note that the mass within the central few hundreds of pc is a small fraction () of the total stellar mass (Kormendy et al. 2009), so that galaxies may have a very similar total luminosity or (e.g., in figs. 1 and 2) but different masses at the center.. To quantify this difference, we can calculate for example how the stellar mass within three fiducial radii of , 100 and pc, representative of and of larger inflowing regions, varies between a pure Sérsic profile and a core-Sérsic one that is identical to the pure Sérsic except for an inner slope within a break radius (e.g., Graham et al. 2003). We choose two effective radii ( or 12 kpc) and Sérsic indeces ( or ) appropriate for core galaxies of =2 or (Ferrarese et al. 2006, Kormendy et al. 2009). Within pc, a pure Sérsic profile has a mass 2–3 times larger than with pc, and () or () times larger than with pc. Within pc, a pure Sérsic has times more mass than a core-Sérsic with pc, and () or () times more than for pc. Within kpc, instead, a pure Sérsic has a mass only % larger than with or 300 pc, both for and . Therefore the difference in fuel production can be significant (i.e., larger than a factor of a few) only for small inflow regions of the order of , and large break radii pc, while it vanishes for kpc 777According to the most recent characterization of the central light profiles of early type galaxies in Virgo, cusp galaxies are described by a Sérsic profile with plus an additional extra-light at the center with respect to it (Kormendy et al. 2009). Therefore the above calculations give a correct estimate for the variation of the central mass of core galaxies with different , but only an approximate estimate for the variation between cusp and core galaxies.. Small correspond to low galactic hot gas contents, as found at (David et al. 2006), and whenever the total galactic soft X-ray emission rescaled by (that is /) is low (Pellegrini & Ciotti 1998); a difference in could then best manifest itself for these objects. Similar numbers to those obtained above for the stellar mass variation within were obtained in the calculation of the stellar mass fraction within different radii for the Lauer et al. (2007a) sample, divided in bins of fixed total stellar mass; this fraction was found to show a scatter of order of magnitude within (Hopkins et al. 2009b). To summarize, 1) a difference in the inner galactic structure can produce a different amount of circumnuclear material at fixed (or ), and may then contribute to the scatter in figs. 1–3, though it cannot account for the bulk of it, since for most galaxies the variation in gas production within will not exceed a factor of a few; 2) possible differences in are expected to exceed a factor of 2–3 only at the lowest /, and should then be searched for in such galaxies.
To pursue further point 2) above, we extracted from the list of galaxies in tab. 1 a sample of core galaxies with low /. The total X-ray luminosity was taken from O’Sullivan et al. (2001), based on observations for a thermal spectrum of keV, and then most sensitive to the soft gaseous emission; we considered the ratio /to correspond to a low hot gas content when (erg s-1)/, that is below the upper limit on the expected contribution from X-ray binaries (from Kim & Fabbiano 2004). Figure 7 shows and /versus and for this subsample: a trend in the predicted direction is present for the upper envelope of the and /values, that decreases for increasing .
4.2. and the age of the stellar population
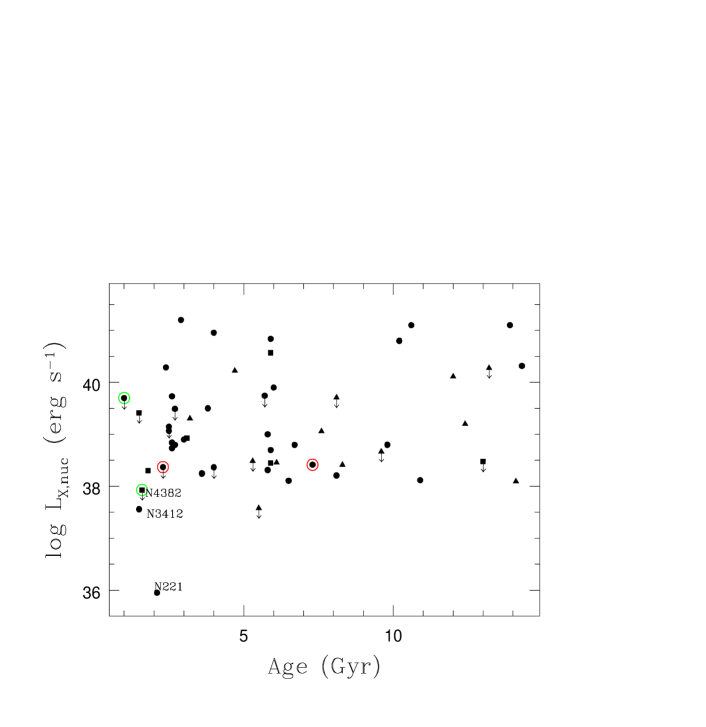
The rate of mass return from stars has a dependence on the age of the stellar population, roughly as after an age of Gyrs (e.g., Ciotti et al. 1991). A population age difference from galaxy to galaxy then leads to a difference in the stellar mass return rate, that can be comparable to that estimated for variations in the inner galactic structure in the previous Sect. 4.1. For example, according to the evolutionary population synthesis models of Maraston (2005), the mass return rate of a simple stellar population with a Kroupa or Salpeter Initial Mass Function is larger than at an age of 11 Gyr by a factor of at 8 Gyr, at 6 Gyr and significantly larger for ages Gyrs: by a factor of at 2 Gyrs, and a factor of at 1 Gyr. Most early type galaxies of the local universe with , as for most the sample in tab. 1, have ages between 3 and 14 Gyrs, based on single population evolutionary models applied to spectral line indices referring to the central galactic region (i.e., within or ; Thomas et al. 2005, Denicolò et al. 2005); therefore age variations can contribute to the wide variation of shown by figs. 1–3 but they will not account for the bulk of it. Age measurements are available from the references above for % of the sample considered here; using them, shows no clear trend with age, but instead a constant range of orders of magnitude at all ages from 3 to 14 Gyr (fig. 8, left panel). At smaller ages, a couple of the lowest-galaxies in the sample (NGC221 and NGC3412) with their erg s-1 extend the range further towards lower values. Even though the subsample in fig. 8 (left panel) is small and has a bias towards the more quiescent galaxies, it suggests that the bulk of the variation in figs. 1-3 is not related to age, consistent with the estimate above of modest variations (within a factor of a few) in the stellar mass return rate for ages Gyr. Numerical models of the evolution of the nuclear activity in early type galaxies over their whole lifetime predict a larger frequency of nuclear outbursts in the past, determined by the larger mass return rate (Ciotti et al. 2010), and this should produce an increasing presence of high values going towards smaller ages. Given that in these models the duty cycle of the nuclear activity is small ( of the past 8.5 Gyr), far larger samples are needed to test this prediction in a quantitative way.
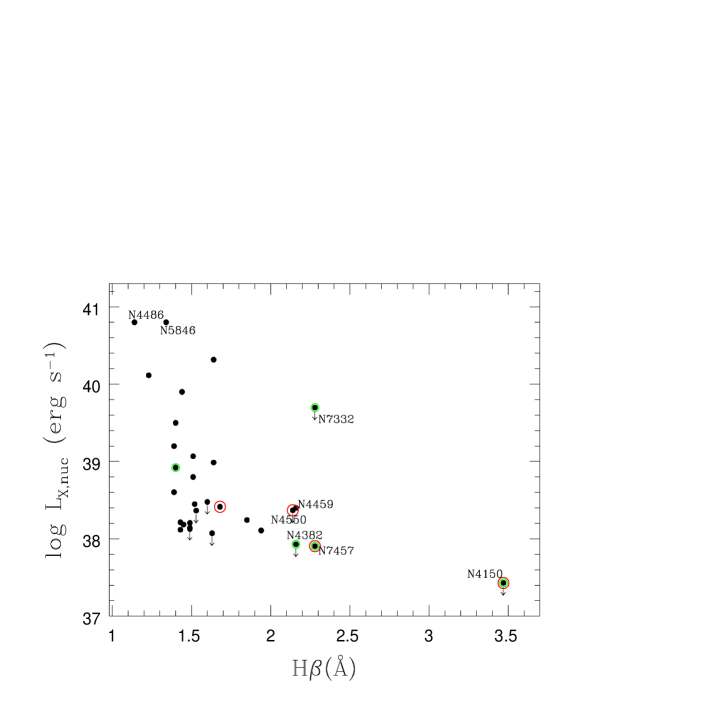
Following observations, a small fraction (%) of early type galaxies of the local universe has been discovered to have undergone a recent ( Gyr old) starformation episode (Donas et al. 2007). For very large samples, near UV photometry from in conjuction with the SDSS optical photometry has provided colors indicative of low levels (few percent of the total stellar mass) of recent starformation (age1 Gyr) in % of early type galaxies of low/intermediate mass ( km s-1; e.g., Schawinski et al. 2007). It is interesting then to check whether this phenomenon is related to accretion and . Coming to studies of specific objects, as the SAURON sample including a representative selection of early type galaxies of the local universe, a study revealed recent starformation in % of them, again all with km s-1 (Jeong et al. 2009). The limit km s-1 corresponds to for the galaxies in fig. 1, therefore this recent starformation phenomenon may be of interest for only a fraction of them. High spatial resolution optical spectroscopy of 28 early type SAURON galaxies revealed young centers (age Gyr) in 6 cases, preferentially galaxies that are of low-mass and fast rotating (McDermid et al. 2006; Kuntschner et al. 2006). When considering the indicators of recent starformation for the SAURON sample quoted above, there could be a trend for the largest to reside in galaxies with a uniformly old stellar population, typically the most massive ones, and the lowest in younger galaxies or those with a younger central component, as the kinematically distinct core in NGC4382 (see the vs. the H line strength in fig. 8, right panel, where galaxies with recent starformation found from or with a kinematically decoupled compact component are also evidenced). Figure 8 (right panel) suggests a decrease in accretion following a starburst episode, or a galaxy merger for which the presence of a kinematically distinct component is considered an evidence, but unfortunately these considerations are based on too few objects to draw definitive conclusions.
Summarizing, the analysis in this Section reveals that 1) at all ages from 3 to 14 Gyr covers the same wide range of values, without a clear trend of with age; 2) the lowest values reside in galaxies with a younger center, recent starformation, and/or with a younger stellar component at the center, with age Gyr. If any, ”youth” seems to be more connected with a lower , but the following remark is in order. Most of the cases in 2) (that is NGC221, NGC3412, NGC4150, NGC4550, NGC4459 and NGC7457, labelled in fig. 8) are also galaxies with low [log], and fig. 1 shows a trend of with ; therefore it cannot be concluded whether the lower nuclear emission is more linked to the galaxy size () or to the consequences of recent starformation. The latter may plausibly have a role in causing a low : during the major galaxy formation process the feedback from the central MBH is believed to end the starformation epoch (e.g., Croton et al. 2006), but in the subsequent evolution recurrent starformation is predicted to take place at the galactic center, connected with the recurrent nuclear outbursts; soon after these bursts, the combined heating effects of the starburst and the central MBH drive the available gas out in a wind, ending abruptly starformation and accretion as well (Ciotti et al. 2010). It is finally interesting that among the cases in 2) there is also the bright galaxy NGC4382 [log], likely a post-merger galaxy due to its kinematically decoupled component. Post-merger early type galaxies undergo a ”rejuvenation” of their stellar population (e.g., Thomas et al. 2005), as also proved by X-ray binaries studies (Kim & Fabbiano 2010), and are typically hot gas poor (Fabbiano & Schweizer 1995, Brassington et al. 2007). In this case, then, heating by starformation or the dynamical effect of the interaction between galaxies on the hot gas may have emptied the galaxies and starved the nuclear activity.
4.3. What determines ?
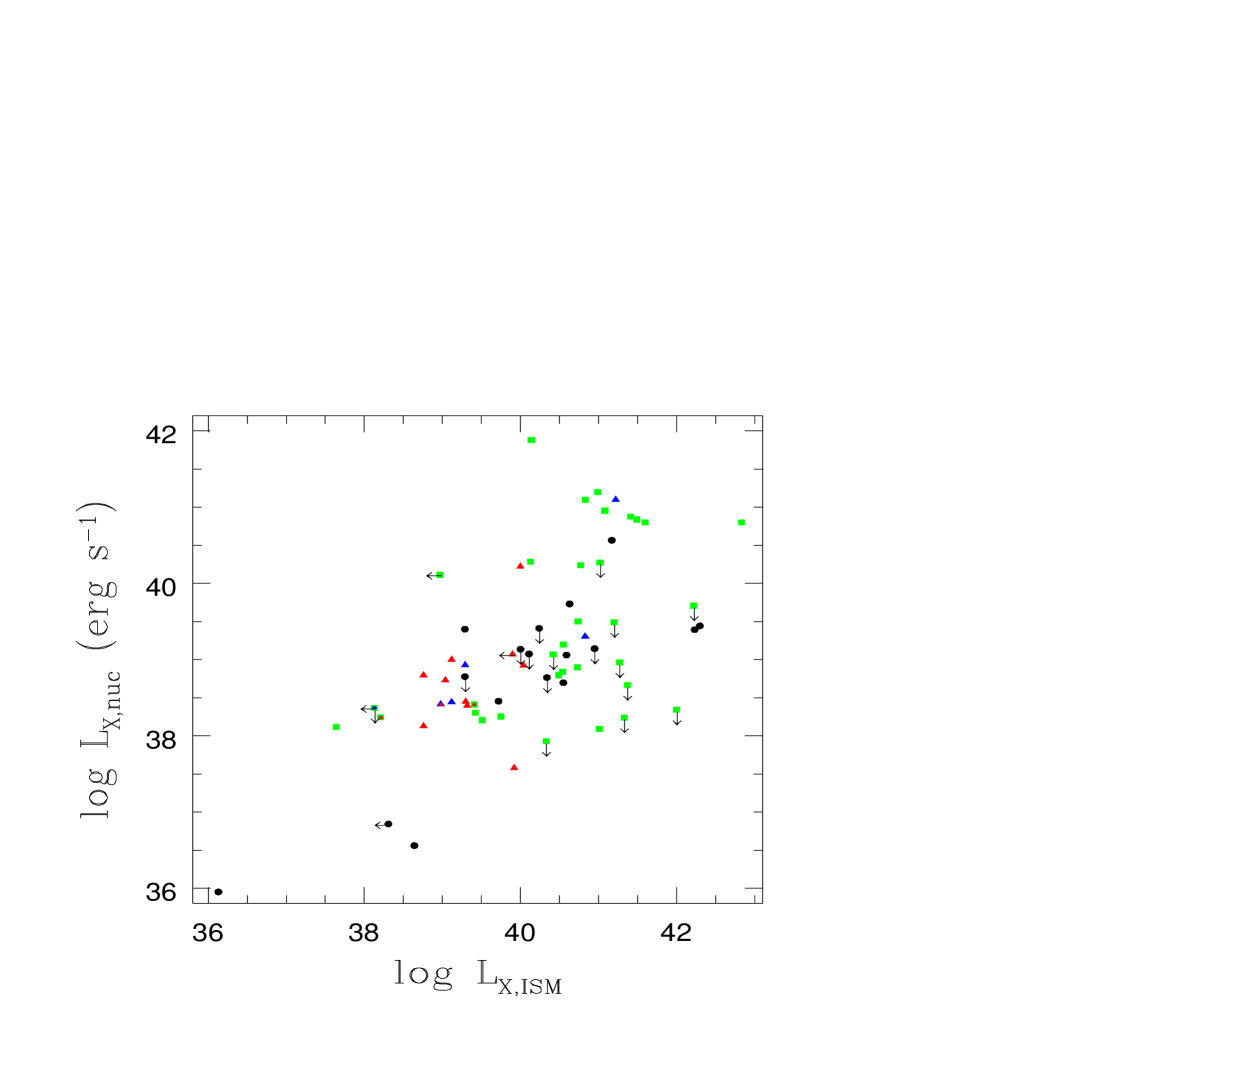
The previous Sects. 4.1 and 4.2 showed that a variation in the inner stellar structure and in central age, both strictly related to the stellar mass input rate close to the MBH, can account for a variation of of a factor of each; therefore they can contribute to the wide variation at fixed or but cannot entirely explain it. We investigated then whether has a dependency on the total hot gas emission on the galactic scale, ; for galaxies hosting a large steady inflow, the latter is proportional to the accreting mass flux (e.g., Fabian 2003). For this purpose we collected the available measurements of the X-ray emission from hot gas for the galaxies in tab. 1, based on observations, that allow to remove best the contribution of the nucleus and of X-ray binaries (contaminating instead the values considered in Sect. 4.1, from data). These gas luminosities , for 65 of the objects in tab 1, were converted to the same (0.3–2) keV band using the spectral shape used to derive them, and to the distances in tab. 1, and then compared with in fig. 9 (references are given in its caption). Even though less objects are present than in figs. 1 and 2, fig. 9 shows that is detected both in gas poor and in gas rich galaxies, and on average increases with , but with a wide variation of of orders of magnitude for logerg s.
Evidently, the level of radiative output from accretion is not tightly related to fuel availability within a steady scenario, either on the circumnuclear or on the galactic scale. Alternatively, then, accretion could be intermittent due to feedback from the central MBH, that occasionally heats the surrounding gas and lowers until accretion is stopped; later on cooling resumes and can increase again, even above values predicted for a steady inflow, since gas that has been pushed and accumulated at large radii can fall back towards the center again (e.g., Di Matteo et al. 2003, Ciotti, Ostriker & Proga 2010). In support for this, the hot gas morphology of a large fraction of high galaxies shows cavities, shells and shocks, often associated with radio jets and lobes, that can be attributed to past nuclear outbursts, taking place every few yrs (e.g., Forman et al. 2005, Allen et al. 2006, Diehl & Statler 2008, Baldi et al. 2009). The large spread in could then be produced by the activity cycle, where is regulated by the joint actions of feedback and fuel availability.
In addition to heating from feedback, the reaching the MBH could be regulated by another phenomenon, for which there are both theoretical and observational evidences. In RIAFs, only a small fraction of the gas supplied may actually fall on to the MBH, and the binding energy it releases may be transported radially outward and drive away the remainder in a wind (Blandford & Begelman 1999). The loss of a large fraction of the accretion flow is also possible due to angular momentum (Proga & Begelman 2003a) or a weak magnetic field (Proga & Begelman 2003b, Hawley & Balbus 2002). On the observational side, detailed studies of ellipticals based on and to estimate the accretion radius , the mass accretion rate within and , concluded that for many of them is so low that most of the available gas within cannot reach the MBH, even when allowing for a low radiative efficiency (Fabbiano et al. 2004; Pellegrini 2005b; Soria et al. 2006b; Ho 2009). This ”fuel overabundance” problem has been best investigated for Sgr A∗, where the X-ray and radio results imply outflows or convection close to the MBH (Baganoff et al. 2003). The possibility of a large mass loss for the accretion flow entering before it reaches the MBH could be another factor accounting for the wide variation in , if taking place in different proportions at fixed . It would also help explain the mild (if any) sensitivity of to different circumnuclear fuel productions discussed in Sects. 3 and 4.1, since the possibility of a large accretion flow depletion overcomes the role of cuspiness in determining . A variation in the fraction of the accreting mass at that effectively reaches the MBH could have already been observed: together with the ”fuel overabundance” cases quoted above, in some hot gas rich galaxies with cavities the mass lost by the accretion flow on its way to the MBH cannot be large: from the energy input by feedback to their hot coronae, a high efficiency was found () for the conversion into jet power of the accretion power , where is the gas mass entering assuming a Bondi rate (Allen et al. 2006).
Finally, in figs. 1–3 there seems to be no gap in and /between the brightest objects, that are a few Seyferts, and the other more radiatively quiescent objects. If the low luminosity Seyferts in this sample share the same accretion mechanism of the brighter Seyferts that are classified as classical AGNs, i.e., they are powered by a standard thin accretion disk plus hot corona (Maoz 2007; Panessa et al. 2007), then there must be a smooth transition from radiatively efficient to inefficient accretion. This may indicate a gradual changeover from a pure RIAF to an inner RIAF plus an outer thin disk, to a thin disk plus corona system (as suggested, e.g., by Ho 2008 for the Palomar sample). A continuous distribution in nuclear X-ray emission from to erg s-1 was also found for the sample of nearby galaxies, of type Sa or later (Zhang et al. 2009).
4.4. The radio and X-ray properties of nearby nuclei
We discuss here the different behavior of and the core 5 GHz luminosity with respect to (Sect. 3.1). The trend in the versus plot (fig. 6) is similar to the L-shape in the plot of the total soft X-ray emission versus (Pellegrini 1999, 2005a): core galaxies span a large range of soft X-ray emission, from the lowest to the highest values observed, while cusp galaxies are confined below erg s-1. The relationship was explained with the core profile being characteristic of the more massive galaxies, often centrally located in groups and clusters, and then with the most favorable conditions to retain the hot gas.
The similar trends of and with respect to are not unexpected, given that these two quantities correlate each other (Fabbiano et al. 1989). The L-shape that they show with respect to cuspiness could then be produced in both cases by the hot gas, determining it directly and being also essential for jet confinement and propagation (e.g., Worrall 2002, Kaiser 2009). In fact many of the core galaxies in fig. 6 have a radio morphology with well developed jets and lobes, or an extended radio structure indicative of a collimated outflow (Capetti & Balmaverde 2006), and the VLA radio luminosities include a contribution from the jet components. When and are above their respective thresholds, then, galaxies have the most dense coronae and the related action of confinement is more efficient. An additional link between the hot gas and the radio emission could be due to a higher accretion rate produced by a higher gas cooling rate (as already suggested previously, Fabbiano et al. 1989; Mittal et al. 2009). Likely both actions are at work, that is a higher hot gas content provides both a more effective confinement and a higher accretion rate. The latter should of course produce also a higher , and indeed the investigation performed here (fig. 9) shows a correlation between the nuclear luminosity and . The L-shape, though, is present only with respect to , not (fig. 6), probably because the action of confinement is more important for for than . However, a more tight relationship between the (Bondi) accretion rate and the outcome of accretion has been found considering the jet power rather than the nuclear luminosities [Sect. 4.3; see also the lack of significant correlation between and the Bondi rate, Pellegrini (2005b), Merloni & Heinz (2007)] since in nearby low luminosity or almost quiescent nuclei the output of accretion is dominated by the kinetic rather than the radiative power [Körding et al. 2006, Allen et al. 2006, Merloni & Heinz (2007)]. An implicit consequence of the different trend of the radio and nuclear X-ray luminosities in fig. 6 is that the ratio should have the largest values among core galaxies, and keep below a threshold for power law galaxies. In fact, power law galaxies tend to be radio quiet and core galaxies radio loud, when using the radio-loudness parameter =L(5 GHz)/L(2–10 keV) of Terashima & Wilson (2003) [see also Capetti & Balmaverde (2006); Panessa et al. (2007)].
Finally, it seems (fig. 6) that only core galaxies can reach the highest and possess a conspicuous radio activity cycle. An activity cycle in cusp galaxies may take place, but with a variation of the radio emission that keeps within a smaller range, perhaps because of a rapid jet failure due to the lack of dense confining gas. For example in the hot gas poor NGC821 a mini-jet in the nuclear region has been possibly discovered in the radio (Pellegrini et al. 2007b). Another possibility is given by the fact that cusp galaxies are on average less massive, and the duty cycle likely increases with galaxy mass, because single outbursts have greater impact in less massive systems (Ciotti et al. 2010), which then are ”on” for a shorter time. Evidence for this is being found from a large sample of hot gas coronae studied with , where the duty cycle seem to increase from % in the less luminous galaxies with less massive hot gas halos to % in the most luminous ones (Nulsen et al. 2009).
5. Conclusions
In this work measurements or upper limits have been collected for the hard X-ray emission at the nucleus of 112 early type galaxies (E and S0) of the local universe (within 67 Mpc). derives from data for 94% of the nuclei, and the sample includes all the available measurements of (29 cases) for galaxies with the above characteristics and a direct estimate of the (38 objects). Using also from the relation, and the inner stellar profile (slope and break radius ) measured with for 81 galaxies, the relationships between and , the central stellar structure, the central age, the radio and the soft X-rays (hot gas) luminosities have been investigated, with the following results:
increases on average with and , with a wide variation of and /, up to 4 orders of magnitude, at any fixed galactic or . Cusp and core galaxies both cover the whole large range of , without a clear trend with or . Most nuclei have an Eddington ratio log(/), the brightest ones (with log(/)) are four Seyfert nuclei. The /is highest at the lowest , and shows an increase of its highest values with increasing ”cuspiness” ().
Accretion in these MBHs may have entered the radiatively inefficient regime, where scales as the mass accretion rate 2 at fixed ; therefore reasons for variations explaining the wide range of observed at fixed (or ) are searched for. In a scenario where accretion is (quasi) steady, could vary because of a different inner galactic structure, that determines the amount of mass shed by stars in the circumnuclear region and then available for accretion. The lack of a clear trend of with and , and the weak evidence for an increase of /with cuspiness, indicate that differences in the inner galactic structure do not have the dominant effect on . In fact the circumnuclear fuel production rate is estimated to vary more than a factor of a few only when the inflowing region is small (of the order of the accretion radius) and for large differences in ; in agreement with this, for galaxies with presumably a small inflowing region, a trend for to decrease for increasing seems to be present.
The stellar mass return rate depends also on the age of the stellar population, but covers the same wide range of values at all central ages from 3 to 14 Gyr; ”youth”, indicated by a younger center, recent starformation, and/or a younger stellar component at the center (of ages Gyr), seems to be more connected with a lower . An explanation could be that the heating by starformation or the dynamical effect of the merging process on the hot gas drive the available gas out in a wind, ending abruptly the starformation and accretion. However, this finding remains an indication, because of the trend of with and the small number of galaxies with information about recent starformation episodes.
on average increases with the total hot gas emission , but the relation is not tight: it shows a large variation of 2–3 orders of magnitude both at the lowest and highest gas contents. Nuclear emission at the highest detected levels for this sample ( erg s-1) is present even when the gas content is low, and at the lowest levels ( erg s-1) can be found at gas luminosities differing by 3 orders of magnitude.
The mild sensitivity of to the circumnuclear and global hot gas contents, and its large variation, finds two possible explanations, both of which go in the sense of overcoming the importance of fuel availability : 1) the gas is heated due to feedback from the MBH, which could be a phenomenon not limited to high galaxies, or 2) only a small fraction of the mass entering the accretion radius actually reaches the MBH, as in RIAF models with winds/outflows, and this fraction can vary largely at fixed .
A sub-sample of galaxies shows an already known trend by which cusp galaxies are confined below a threshold in the VLA 5 GHz central luminosity , while core galaxies span a large range of ; this subsample does not show a similar trend of with the central light profile. The behavior is instead similar to that of the total soft X-ray emission with respect to ; the hot gas could then be responsible both for the soft X-ray emission and the jet confinement and propagation. While core galaxies can possess a conspicuous radio activity cycle, in cusp galaxies the variation of the radio emission keeps within a smaller range, because of a rapid jet failure due to the lack of a dense confining medium, or a smaller duty cycle, being these galaxies on average less massive systems.
| Name | d | Ref | log | Ref | log | Ref | ||
|---|---|---|---|---|---|---|---|---|
| (mag) | (Mpc) | (erg s | () | |||||
| (1) | (2) | (3) | (4) | (5) | (6) | (7) | (8) | (9) |
| NGC221 | 8.22 | 0.81 | a | ….. | 35.95 | 1 | 6.47 | 2 |
| NGC404 | 10.94 | 3.3 | a | ….. | 36.84 | 2 | 5.39 | 1 |
| NGC474 | 12.20 | 29.3 | b | 0.37 | 38.41 | 3 | 7.88 | 1 |
| NGC507 | 12.23 | 63.8 | b | 0.00 | 39.71 | 4 | 8.96 | 1 |
| NGC524 | 11.01 | 24.0 | a | 0.03 | 38.60 | 3 | 8.63 | 1 |
| NGC720 | 11.05 | 27.7 | a | 0.06 | 38.90 | 5 | 8.56 | 1 |
| NGC821 | 11.25 | 24.1 | a | 0.10 | 38.37 | 6 | 7.60 | 2 |
| NGC1023 | 9.29 | 11.4 | a | 0.74 | 38.13 | 7 | 7.64 | 2 |
| NGC1052 | 11.32 | 19.4 | a | 0.18 | 41.20 | 3 | 8.29 | 1 |
| NGC1316 | 9.29 | 21.5 | a | 0.35 | 39.30 | 8 | 8.44 | 1 |
| NGC1331 | 14.15 | 24.2 | a | ….. | 38.13 | 9 | 6.09 | 1 |
| NGC1332 | 11.03 | 24.2 | a | ….. | 38.77 | 9 | 9.04 | 1 |
| NGC1380 | 10.80 | 17.6 | a | 1.0a | 40.10 | 10 | 8.40 | 1 |
| NGC1395 | 10.48 | 24.1 | a | ….. | 39.06 | 11 | 8.59 | 1 |
| NGC1399 | 10.35 | 20.0 | a | 0.12 | 38.96 | 12 | 8.68 | 2 |
| NGC1404 | 10.81 | 21.0 | a | ….. | 40.57 | 10 | 8.50 | 1 |
| NGC1407 | 10.38 | 28.8 | a | ….. | 39.14 | 14 | 8.76 | 1 |
| NGC1549 | 10.61 | 19.7 | a | ….. | 38.46 | 13 | 8.25 | 1 |
| NGC1553 | 10.20 | 18.5 | a | 0.74 | 40.22 | 2 | 8.02 | 1 |
| NGC1600 | 11.68 | 57.4 | b | -0.03 | 39.49 | 15 | 9.11 | 1 |
| NGC1700 | 11.78 | 40.6 | b | -0.10 | 38.84 | 13 | 8.54 | 1 |
| NGC2110 | 11.85 | 31.3 | c | ….. | 42.47 | 16 | 8.65 | 1 |
| NGC2300 | 11.73 | 30.4 | b | 0.07 | 40.96 | 10 | 8.69 | 1 |
| NGC2434 | 11.25 | 21.6 | a | 0.75 | 37.58 | 10 | 8.10 | 1 |
| NGC2865 | 12.05 | 37.8 | a | ….. | 39.40 | 17 | 7.97 | 1 |
| NGC2974 | 11.61 | 21.5 | a | 0.62 | 40.32 | 10 | 8.53 | 1 |
| NGC3115 | 9.87 | 9.7 | a | 0.52 | 38.73 | 7 | 8.96 | 2 |
| NGC3125 | 13.01 | 13.4 | c | ….. | 37.60 | 18 | 5.91 | 1 |
| NGC3193 | 11.86 | 34.0 | a | 0.01 | 39.74 | 10 | 8.17 | 1 |
| NGC3226 | 12.22 | 23.6 | a | 1.0a | 40.80 | 3 | 8.17 | 1 |
| NGC3245 | 11.53 | 20.9 | a | 0.73a | 39.00 | 3 | 8.32 | 2 |
| NGC3309 | 12.15 | 56.5 | c | ….. | 39.14 | 19 | 8.67 | 1 |
| NGC3311 | 12.40 | 52.7 | c | ….. | 39.08 | 19 | 8.10 | 1 |
| NGC3377 | 10.98 | 11.2 | a | 0.03 | 38.24 | 20 | 8.02 | 2 |
| NGC3379 | 10.11 | 10.6 | a | 0.18 | 38.12 | 21 | 8.04 | 2 |
| NGC3384 | 10.76 | 11.6 | a | 0.71 | 38.11 | 7 | 7.24 | 2 |
| NGC3412 | 11.30 | 11.3 | a | ….. | 37.56 | 7 | 7.06 | 1 |
| NGC3414 | 11.93 | 25.2 | a | 0.83 | 39.90 | 3 | 8.52 | 1 |
| NGC3516 | 12.32 | 35.0 | c | 0.97a | 42.60 | 16 | 7.82 | 1 |
| NGC3557 | 10.92 | 45.7 | a | 0.00a | 40.24 | 22 | 8.77 | 1 |
| NGC3585 | 10.52 | 20.0 | a | 0.31 | 38.93 | 23 | 8.51 | 2 |
| NGC3607 | 10.83 | 22.8 | a | 0.26 | 38.80 | 3 | 8.14 | 2 |
| NGC3608 | 11.46 | 22.9 | a | 0.09 | 38.21 | 3 | 8.32 | 2 |
| NGC3923 | 10.39 | 22.9 | a | ….. | 39.73 | 10 | 8.65 | 1 |
| NGC3945 | 11.56 | 19.9 | b | -0.06 | 39.00 | 3 | 8.00 | 1 |
| NGC3998 | 11.32 | 14.1 | a | 0.80a | 41.46 | 24 | 8.36 | 2 |
| NGC4026 | 11.59 | 13.6 | a | 0.68a | 38.41 | 18 | 8.26 | 2 |
| NGC4036 | 11.41 | 23.3 | c | 0.36a | 39.05 | 3 | 8.06 | 1 |
| NGC4111 | 11.60 | 15.0 | a | 0.50a | 40.40 | 3 | 7.71 | 1 |
| NGC4125 | 10.53 | 23.9 | a | ….. | 38.70 | 3 | 8.45 | 1 |
| NGC4143 | 11.75 | 15.9 | a | 0.59 | 39.98 | 2 | 8.35 | 1 |
| NGC4150 | 12.41 | 13.7 | a | 0.58 | 37.43 | 7 | 6.76 | 1 |
| NGC4168 | 11.92 | 37.3 | b | 0.17 | 39.07 | 22 | 8.09 | 1 |
| NGC4203 | 11.66 | 15.1 | a | 0.62a | 40.08 | 7 | 7.87 | 1 |
| NGC4261 | 11.24 | 31.6 | a | 0.00 | 41.10 | 3 | 8.72 | 2 |
| NGC4278 | 10.91 | 16.1 | a | 0.06 | 40.11 | 25 | 8.53 | 1 |
| NGC4291 | 12.20 | 26.2 | a | 0.01 | 40.57 | 10 | 8.53 | 2 |
| NGC4342 | 13.36 | 11.6 | c | ….. | 38.70 | 18 | 8.37 | 2 |
| NGC4365 | 10.39 | 20.4 | a | 0.07 | 38.25 | 26 | 8.65 | 1 |
| NGC4374 | 9.89 | 18.4 | a | 0.13 | 39.50 | 3 | 9.20 | 2 |
| NGC4382 | 9.88 | 18.4 | a | 0.00 | 37.93 | 26 | 8.04 | 1 |
| NGC4387 | 12.82 | 21.4 | a | 0.10 | 38.48 | 26 | 7.12 | 1 |
| NGC4406 | 9.71 | 17.1 | a | -0.04 | 38.34 | 26 | 8.51 | 1 |
| Name | d | Ref | log | Ref | log | Ref | ||
|---|---|---|---|---|---|---|---|---|
| (mag) | (Mpc) | (erg s | () | |||||
| (1) | (2) | (3) | (4) | (5) | (6) | (7) | (8) | (9) |
| NGC4417 | 11.96 | 16.7 | a | 0.71 | 38.26 | 26 | 7.55 | 1 |
| NGC4435 | 11.37 | 17.4 | a | 0.33a | 38.45 | 26 | 7.81 | 1 |
| NGC4458 | 12.77 | 17.2 | a | 0.16 | 38.07 | 26 | 7.08 | 1 |
| NGC4459 | 11.25 | 16.1 | a | 0.66a | 38.40 | 3 | 7.85 | 2 |
| NGC4464 | 13.45 | 16.5 | a | ….. | 38.39 | 26 | 7.45 | 1 |
| NGC4467 | 14.79 | 17.2 | a | ….. | 38.45 | 26 | 6.42 | 1 |
| NGC4472 | 9.16 | 16.3 | a | 0.01 | 38.67 | 12 | 8.89 | 1 |
| NGC4473 | 10.91 | 15.7 | a | -0.07 | 38.14 | 7 | 8.08 | 2 |
| NGC4478 | 12.04 | 18.1 | a | -0.10 | 38.49 | 26 | 7.59 | 1 |
| NGC4486 | 9.47 | 16.1 | a | 0.27 | 40.80 | 3 | 9.53 | 2 |
| NGC4486B | 14.18 | 16.9 | a | ….. | 37.91 | 20 | 7.95 | 1 |
| NGC4494 | 10.57 | 17.1 | a | 0.52 | 38.80 | 3 | 7.74 | 1 |
| NGC4550 | 12.31 | 15.9 | a | ….. | 38.37 | 7 | 6.98 | 1 |
| NGC4552 | 10.49 | 15.4 | a | -0.10 | 39.20 | 3 | 8.63 | 1 |
| NGC4564 | 11.81 | 15.0 | a | 0.80 | 38.45 | 20 | 7.78 | 2 |
| NGC4570 | 11.62 | 17.9 | a | ….. | 38.18 | 26 | 8.12 | 1 |
| NGC4578 | 12.24 | 18.5 | a | ….. | 26 | 7.35 | 1 | |
| NGC4589 | 11.55 | 22.0 | a | 0.21 | 38.90 | 3 | 8.43 | 1 |
| NGC4612 | 11.94 | 17.2 | a | ….. | 38.08 | 26 | 6.24 | 1 |
| NGC4621 | 10.52 | 18.3 | a | 0.75 | 38.92 | 7 | 8.44 | 1 |
| NGC4636 | 10.29 | 14.7 | a | 0.13 | 38.24 | 12 | 8.25 | 1 |
| NGC4649 | 9.70 | 16.8 | a | 0.17 | 38.09 | 7 | 9.33 | 2 |
| NGC4660 | 11.90 | 12.8 | a | 0.91 | 38.22 | 26 | 8.13 | 1 |
| NGC4696 | 11.13 | 35.5 | a | 0.10 | 40.00 | 3 | 8.64 | 1 |
| NGC4697 | 10.10 | 11.8 | a | 0.22 | 38.41 | 20 | 8.28 | 2 |
| NGC4754 | 11.35 | 16.8 | a | ….. | 38.31 | 26 | 8.09 | 1 |
| NGC4759 | 13.75 | 50.7 | c | ….. | 27 | 8.49 | 1 | |
| NGC5018 | 11.23 | 39.4 | c | ….. | 28 | 8.32 | 1 | |
| NGC5044 | 11.24 | 31.2 | a | ….. | 39.44 | 29 | 8.54 | 1 |
| NGC5102 | 10.01 | 4.0 | a | ….. | 36.56 | 18 | 7.58 | 1 |
| NGC5128 | 7.28 | 4.2 | a | 0.10a | 41.88 | 30 | 8.46 | 2 |
| NGC5273 | 12.47 | 16.5 | a | 0.37a | 40.55 | 31 | 6.60 | 1 |
| NGC5283 | 14.15 | 48.7 | c | ….. | 41.91 | 32 | 7.71 | 1 |
| NGC5322 | 10.96 | 31.2 | a | 0.00a | 40.29 | 10 | 8.49 | 1 |
| NGC5419 | 11.53 | 62.6 | b | -0.10 | 40.82 | 22 | 9.20 | 1 |
| NGC5813 | 11.24 | 32.2 | a | 0.05 | 38.80 | 3 | 8.52 | 1 |
| NGC5838 | 11.53 | 22.2 | b | 0.93 | 38.99 | 3 | 8.72 | 1 |
| NGC5845 | 13.19 | 25.9 | a | 0.51 | 39.07 | 20 | 8.42 | 2 |
| NGC5846 | 10.82 | 24.9 | a | 0.00a | 40.80 | 3 | 8.54 | 1 |
| NGC5866 | 10.66 | 15.3 | a | 0.00a | 38.30 | 3 | 7.84 | 1 |
| NGC6482 | 11.73 | 58.6 | c | ….. | 39.39 | 3 | 8.97 | 1 |
| NGC7052 | 13.30 | 67.1 | b | 0.16 | 40.28 | 4 | 8.58 | 2 |
| NGC7332 | 11.79 | 23.0 | a | 0.62 | 39.70 | 10 | 7.42 | 1 |
| NGC7457 | 11.63 | 13.2 | a | -0.10 | 37.91 | 18 | 6.58 | 2 |
| NGC7619 | 11.70 | 53.0 | a | -0.02 | 40.84 | 7 | 9.05 | 1 |
| NGC7626 | 11.81 | 53.0 | a | 0.36 | 41.10 | 7 | 8.75 | 1 |
| NGC7743 | 12.07 | 20.7 | a | 0.50 | 39.50 | 3 | 6.75 | 1 |
| IC1459 | 10.86 | 29.2 | a | -0.10 | 40.87 | 33 | 9.42 | 2 |
| IC4296 | 11.24 | 48.8 | a | 0.00a | 41.20 | 34 | 9.10 | 1 |
a from the modeling with the Nuker law by Capetti & Balmaverde (2005), see Sect. 3; NGC1380 and NGC3226 are just defined cusp galaxies, for them is assumed here.
Column (1): galaxy name. Col. (2): total apparent blue magnitude, corrected for galactic and internal extinction, from HyperLeda. Col. (3): distance, for km s-1 Mpc-1, based on sources given in col. (4), taken with this priority: the SBF method [Tonry et al. (2001), a in col. (4); distances derived from this work are now consistent with km s-1 Mpc-1 after more recent Cepheid and Hubble flow recalibrations, J. Tonry 2010, private communication; for IC4296 the reference is Mei et al. 2000; for a few Virgo galaxies not in Tonry et al. (2001), the results of Blakeslee et al. (2009) have been used]; Lauer et al. (2007a) [b in col. (4); these authors reworked the distances in various sources to be consistent with km s-1 Mpc-1]; the recession velocity corrected for Virgo infall, given by HyperLeda [c in col. (4)]. Col. (5): inner slope of stellar light profile, from Lauer et al. (2007a), except for cases marked with the apex a. Col. (6): nuclear luminosity in the 2–10 keV band, rescaled for the distance in col.(3), from the reference in col. (7) (see Sect. 2). Col. (8): central black hole mass, from the method specified in col. (9), where 1 = the relation of Gültekin et al. (2009) for elliptical galaxies, 2 = a direct mass measurement with a dynamical modeling (references in Gültekin et al. 2009); when necessary, the masses have been rescaled for the distance in col. (3).
References
- (1) Allen, S.W., Dunn, R.J.H., Fabian, A.C., Taylor, G.B., Reynolds, C.S. 2006, MNRAS 372, 21
- (2) Baganoff, F. K., Maeda, Y., Morris, M., Bautz, M. W., Brandt, W. N., Cui, W., Doty, J. P., Feigelson, E. D., Garmire, G. P., Pravdo, S. H., Ricker, G. R., Townsley, L. K. 2003, ApJ 591, 891
- (3) Baldi, A., Forman, W., Jones, C., Kraft, R., Nulsen, P., Churazov, E., David, L., Giacintucci, S. 2009, ApJ 707, 1034
- (4) Balmaverde, B., Capetti, A. 2006, A&A 447, 97
- (5) Bender R., Surma P., Döbereiner S., Möllenhoff C., Madejsky R. 1989, A&A 217, 35
- (6) Blakeslee, J. P., Jordán, Andrés, Mei, S., et al. 2009, ApJ 694, 556
- (7) Blandford, R. D., Begelman, M. C. 1999, MNRAS 303, L1
- (8) Brassington, N. J., Ponman, T. J., Read, A. M. 2007, MNRAS 377, 1439
- (9) Brassington, N. J., Fabbiano, G., Kim, D.-W., et al. 2008, ApJS 179, 142
- (10) Brassington, N. J., Fabbiano, G., Kim, D.-W., et al. 2009, ApJS 181, 605
- (11) Capetti, A., Balmaverde, B. 2005, A&A 440, 73
- (12) Capetti, A., Balmaverde, B. 2006, A&A 453, 27
- (13) Ciotti L., D’Ercole A., Pellegrini S., Renzini A. 1991, ApJ 376, 380
- (14) Ciotti, L., & Ostriker, J.P. 2007, ApJ 665, 1038
- (15) Ciotti, L., Ostriker, J. P., Proga, D. 2010, in press on ApJ (arXiv:1003.0578)
- (16) Colbert, E. J. M.; Heckman, T. M., Ptak, A.F., Strickland, D. K., Weaver, K. A. 2004, ApJ 602, 231
- (17) Croton, D. J., Springel, V., White, S. D. M. et al. 2006, MNRAS 365, 11
- (18) David, L. P., Forman, W., Jones, C. 1991, ApJ 369, 121
- (19) David, L.P., Jones, C., Forman, W., Vargas, I.M., Nulsen, P. 2006, ApJ 653, 207
- (20) David, L.P., et al. 2009, ApJ 705, 624
- (21) Denicoló, G. Terlevich, R., Terlevich, E., Forbes, D. A., Terlevich, A. 2005, MNRAS 358, 813
- (22) Diehl, S., Statler, T. S. 2008, ApJ 680, 897
- (23) Di Matteo, T., Allen, S. A., Fabian, A.C., Wilson, A.S., Young, A.J. 2003, ApJ 582, 133
- (24) Donato, D., Sambruna, R. M., Gliozzi, M. 2004, ApJ 617, 915
- (25) Donas, J., Deharveng, J.M., Rich, R. M. et al. 2007, ApJS 173, 597
- (26) Ebisuzaki, T., Makino, J., Tsuru, T.G., Funato, Y., Portegies Zwart, S., Hut, P., McMillan, S., Matsushita, S., Matsumoto, H., Kawabe, R. 2001, ApJ 562, L19
- (27) Evans, D. A., Kraft, R. P., Worrall, D. M., Hardcastle, M. J., Jones, C.; Forman, W. R., Murray, S. S. 2004, ApJ 612, 786
- (28) Fabbiano, G., Schweizer, F. 1995, ApJ 447, 572
- (29) Fabbiano, G., Gioia, I. M., Trinchieri, G. 1989, ApJ 347, 127
- (30) Fabbiano, G., Elvis, M., Markoff, S., Siemiginowska, A., Pellegrini, S., Zezas, A., Nicastro, F., Trinchieri, G., & McDowell, J. 2003, ApJ 588, 175
- (31) Fabbiano, G., Baldi, A., Pellegrini, S., Siemiginowska, A., Elvis, M., Zezas, A., McDowell, J. 2004, ApJ 616, 730
- (32) Faber, S.M., Tremaine, S., Ajhar, E.A., et al. 1997, AJ 114, 1771
- (33) Fabian, A.C. 2003, MNRAS 344, L27
- (34) Ferrarese, L., Merritt, D. 2000, ApJ 539, L9
- (35) Ferrarese, L., et al. 2006, ApJS 164, 334
- (36) Finoguenov, A., Davis, D. S., Zimer, M., Mulchaey, J. S. 2006, ApJ 646, 143
- (37) Forman, W., Nulsen, P., Heinz, S., et al. 2005, ApJ, 635, 894
- (38) Fukazawa, Y., Botoya-Nonesa, J. G., Pu, J., Ohto, A., & Kawano, N. 2006, ApJ, 636, 698
- (39) Gallo, E., Treu, T., Jacob, J., Woo, J.-H., Marshall, P.J., Antonucci, R. 2008, ApJ 680, 154
- (40) Gallo, E., Treu, T., Marshall, P.J., Woo, J.-H., Leipski, C., Antonucci, R. 2010, ApJ in press (arXiv:1002.3619)
- (41) Gebhardt, K., Richstone, D., Ajhar, E. A. et al. 1996, AJ 112, 105
- (42) Gebhardt, K., Bender, R., Bower, G., et al. 2000, ApJ 539, L13
- (43) Gebhardt, K., Richstone, D., Tremaine, S. et al. 2003, ApJ 583, 92
- (44) Ghosh, K. K., Swartz, D.A., Tennant, A. F., Wu, K., Saripalli, L. 2005, ApJ 623, 815
- (45) Ghosh, H., Pogge, R. W., Mathur, S., Martini, P., Shields, J. C. 2007, ApJ 656, 105
- (46) González-Martín, O., Masegosa, J., Márquez, I., Guainazzi, M., Jiménez-Bailón, E. 2009, A&A 506, 1107
- (47) Graham, A.W., et al. 2003, ApJ 125, 2951
- (48) Graham, A. W., Guzmán, R. 2003, AJ 125, 2936
- (49) Graham, A. W. 2004, ApJ 613, L33
- (50) Gualandris, A., Merritt, D. 2008, ApJ 678, 780
- (51) Gültekin, K., Richstone, D.O., Gebhardt, K., et al. 2009, ApJ 698, 198
- (52) Haardt, F., Maraschi, L. 1993, ApJ 413, 507
- (53) Hawley, J. F., Balbus, S. A. 2002, ApJ 573, 738
- (54) Ho, L.C., Filippenko, A. V., & Sargent, W.L. W. 1997, ApJ 487, 568
- (55) Ho, L. C., Terashima, Y., & Ulvestad, J.S. 2003, ApJ 589, 783
- (56) Ho, L.C. 2008, ARAA 46, 475
- (57) Ho, L.C. 2009, ApJ 699, 626
- (58) Hopkins, P. F., Cox, T. J., Dutta, S. N., Hernquist, L., Kormendy, J., Lauer, T. R. 2009a, ApJS 181, 135
- (59) Hopkins, P.F., Murray, N., Thompson, T.A. 2009b, MNRAS 398, 303
- (60) Humphrey, P. J., Buote, D. A. 2004, ApJ 612, 848
- (61) Jeltema, T.E., Canizares, C.R., Buote, D.A., & Garmire, G.P. 2003, ApJ 585, 756
- (62) Jeltema, T. E., Binder, B., Mulchaey, J. S. 2008, ApJ 679, 1162
- (63) Jeong, H., Yi, S. K., Bureau, M. et al. 2009, MNRAS 398, 2028
- (64) Kaiser, C.R. 2009, AN 330, 270
- (65) Kauffmann, G., Heckman, T. M. 2009, MNRAS 397, 135
- (66) Kim, D.-W., Fabbiano, G. 2004, ApJ 611, 846
- (67) Kim, D.-W., Kim, E., Fabbiano, G., Trinchieri, G. 2008, ApJ 688, 931
- (68) Kim, D. W., & Fabbiano, G. 2010, ApJ in press (arXiv:1004.2427)
- (69) Körding, E.G., Fender, R.P., Migliari, S. 2006, MNRAS 369, 1451
- (70) Kormendy J., Bender R. 1996, ApJ 464, L119
- (71) Kormendy, J., Fisher, D.B., Cornell, M.E., Bender, R. 2009, ApJS 182, 216
- (72) Kraft, R. P., Vázquez, S. E., Forman, W. R., Jones, C., Murray, S. S., Hardcastle, M. J., Worrall, D. M., Churazov, E. 2003, ApJ 592, 129
- (73) Kuntschner, H., Emsellem, E., Bacon, R. et al. 2006, MNRAS 369, 497
- (74) Lauer, T. R., Ajhar, E. A., Byun, Y.-I., Dressler, A., Faber, S. M., Grillmair, C., Kormendy, J., Richstone, D., Tremaine, S. 1995, AJ110, 2622
- (75) Lauer T.R., et al. 2007a, ApJ 664, 226
- (76) Lauer T.R., et al. 2007b, ApJ 662, 808
- (77) Liu, Ji-F., Bregman, J.N. 2005, ApJS 157, 59
- (78) Loewenstein, M., Mushotzky, R.F., Angelini, L., Arnaud, K.A., & Quataert, E. 2001, ApJ 555, L21
- (79) Magorrian, J., et al. 1998, AJ115, 2285
- (80) Mahadevan, R. 1997, ApJ 477, 585
- (81) Malkan, M.A., Gorjian, V., Tam, R. 1998, ApJS 117, 25
- (82) Maoz, D. 2007, 377, 1696
- (83) Maraston, C. 2005, MNRAS 362, 799
- (84) Mauch, T., Sadler, E. M. 2007, MNRAS 375, 931
- (85) McDermid, R. M., Emsellem, E., Shapiro, K. L. et al. 2006, MNRAS 373, 906
- (86) Mei, S., Silva, D., Quinn, P. J. 2000, A&A 361, 68
- (87) Memola, E., Trinchieri, G., Wolter, A., Focardi, P., Kelm, B. 2009, A&A 497, 359
- (88) Merloni, A., Heinz, S. 2007, MNRAS 381, 589
- (89) Milosavljevic, M., Merritt, D., Rest, A., van den Bosch, F.C. 2002, MNRAS 331, L51
- (90) Mittal, R., Hudson, D. S., Reiprich, T. H., Clarke, T. 2009, A&A 501, 835
- (91) Morita, U., Ishisaki, Y., Yamasaki, N., Y., Ota, N., Kawano, N., Fukazawa, Y., Ohashi, T. 2006, PASJ 58, 719
- (92) Narayan, R., Yi, I. 1995, ApJ 452, 710
- (93) Nagino, R., Matsushita, K. 2009, A&A 501, 157
- (94) Nulsen, P., Jones, C., Forman, W., Churazov, E., McNamara, B., David, L., Murray, S. 2009, to appear in the proceedings of ”The Monster’s Fiery Breath”, Eds. Sebastian Heinz & Eric Wilcots (AIP conference series), arXiv:0909.1809
- (95) O’Sullivan, E., Forbes, D.A., Ponman, T.J. 2001, MNRAS 328, 461
- (96) O’Sullivan, E., Ponman, T.J. 2004, MNRAS 349, 535
- (97) Panessa, F., Barcons, X., Bassani, L., Cappi, M., Carrera, F. J., Ho, L. C., Pellegrini, S. 2007, A&A 467, 519
- (98) Parriott, J. R., Bregman, J. N. 2008, ApJ 681, 1215
- (99) Pasquali, A., van den Bosch, F.C., Rix, H.-W. 2007, ApJ 664, 738
- (100) Pellegrini S., Ciotti L. 1998, A&A 333, 433
- (101) Pellegrini, S. 1999, A&A 351, 487
- (102) Pellegrini, S., Cappi, M., Bassani, L., Della Ceca, R., Palumbo, G.G.C. 2000, A&A 360, 878
- (103) Pellegrini, S., Venturi, T., Comastri, A., Fabbiano, G., Fiore, F., Vignali, C., Morganti, R., Trinchieri, G. 2003b, ApJ 585, 677
- (104) Pellegrini, S. 2005a, MNRAS 364, 169
- (105) Pellegrini, S. 2005b, ApJ 624, 155
- (106) Pellegrini, S., Baldi, A., Kim, D. W., Fabbiano, G., Soria, R., Siemiginowska, A., Elvis, M. 2007a, ApJ 667, 731
- (107) Pellegrini, S., Siemiginowska, A., Fabbiano, G., Elvis, M., Greenhill, L., Soria, R., Baldi, A., Kim, D. W. 2007b, ApJ 667, 749
- (108) Pian, E., Romano, P., Maoz, D., Cucchiara, A., Pagani, C., La Parola, V. 2009, MNRAS 401, 677
- (109) Proga, D., Begelman, M. C. 2003a, ApJ 582, 69
- (110) Proga, D., Begelman, M. C. 2003b, ApJ 592, 767
- (111) Ptak, A., Yaqoob, T., Mushotzky, R., Serlemitsos, P., Griffiths, R. 1998, ApJ 501, L37
- (112) Rampazzo, R., Alexander, P., Carignan, C., et al. 2006, MNRAS 368, 851
- (113) Rest, A., van den Bosch, F. C., Jaffe, W., Tran, H., Tsvetanov, Z., Ford, H. C., Davies, J., & Schafer, J. 2001, AJ121, 2431
- (114) Rinn, A. S., Sambruna, R. M., Gliozzi, M. 2005, ApJ 621, 167
- (115) Sansom, A. E., O’Sullivan, E., Forbes, D.A., Proctor, R. N., Davis, D. S. 2006, MNRAS 370, 1541
- (116) Schawinski, K., et al. 2007, ApJS 173, 512
- (117) Schawinski, K., et al. 2010, ApJ 711, 284
- (118) Sivakoff, G.R., Sarazin, C.L., & Carlin, J.L. 2004, ApJ 617, 262
- (119) Soria, R., Fabbiano, G., Graham, A. W., Baldi, A., Elvis, M., Jerjen, H., Pellegrini, S., Siemiginowska, A. 2006a, ApJ 640, 126
- (120) Soria, R., Graham, A. W., Fabbiano, G., Baldi, A., Elvis, M., Jerjen, H., Pellegrini, S., Siemiginowska, A. 2006b, ApJ 640, 143
- (121) Terashima, Y., & Wilson, A. S. 2003, ApJ 583, 145
- (122) Terlevich, A. I., Forbes, D. A. 2002, MNRAS 330, 547
- (123) Thomas, D., Maraston, C., Bender, R., Mendes de Oliveira, C. 2005, ApJ 621, 673
- (124) Tonry, J.L., Dressler, A., Blakeslee, J.P., et al. 2001, ApJ 546, 681
- (125) Trujillo, I., Erwin, P., Asensio Ramos, A., Graham, A.W. 2004, AJ 127, 1917
- (126) Trinchieri, G., Pellegrini, S., Fabbiano, G., et al. 2008, ApJ, 688, 1000
- (127) Vasudevan, R.V., Fabian, A.C. 2007, MNRAS 381, 1235
- (128) Winter, L.M., Mushotzky, R.F., Reynolds, C.S., Tueller, J. 2009, ApJ 690, 1322
- (129) Worrall, D. 2002, NewAR 46, 121
- (130) Yamasaki, N. Y., Ohashi, T., Furusho, T. 2002, ApJ 578, 833
- (131) Zhang, Z., Xu, H., Wang, Y., An, T., Xu, Y., Wu, X. 2007, ApJ 656, 805
- (132) Zhang, W.M., Soria, R., Zhang, S. N., Swartz, D.A., Liu, J.F. 2009, ApJ 699, 507
- (133)