Ferromagnetic spinel CuCr2Se4 studied by Raman spectroscopy and lattice dynamics calculations
Abstract
The lattice dynamics of the ferromagnetic spinel CuCr2Se4 (T K) was studied experimentally by measuring the Raman spectra and theoretically by calculation of zone center phonon frequencies within a shell model. All Raman allowed modes () were identified and assigned to specific atomic motions. The relative intensity of the Raman lines varies strongly with excitation photon energy between 1.58 and 2.71 eV, but no significant phonon anomalies are observed near TC.
pacs:
78.30.-j, 63.20.-e, 75.47.LxI Introduction
In the recent years there is a revived interest in the properties of ferromagnetic chromium chalcogenide spinels MCr2X4 (M=divalent element, X=S,Se,Te). These materils are prospective candidates for spin-based electronic (spintronic) applications as the strong interaction between the electronic and spin subsystems results in drastic changes of the electronic transport and optical properties near the Curie temperature, TC.wojtowicz1969 ; haas1973 ; ramirez1997 CuCr2Se4 ( K) attracts particular attention as it is ferromagnetic at room temperature and some theoretical models predict that with suitable doping it may become half-metallic - being an excellent metal for one spin channel and excellent insulator for the other spin channel.wang2009 While the structural, magnetic and electric properties of CuCr2Se4 have been subject of numerous studies, there are to our knowledge no reports on its lattice dynamics and possible effects of spin-phonon coupling. In this work we present and analyze the experimental Raman spectra of CuCr2Se4 single crystals in close comparison with predictions of lattice dynamics calculations within a shell modes. The Raman mode intensities exhibit resonant behavior for excitation photon energies between 1.58 and 2.71 eV, but no significant anomalies in phonon parameters are observed near the magnetic transition at .
II Samples and Methods
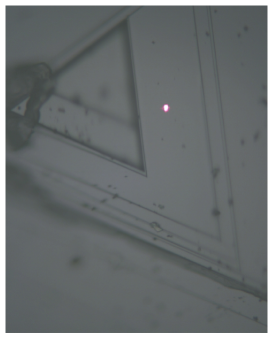
Single crystals of CuCr2Se4 were grown using the Chemical Vapor Transport (CVT) technique following a procedure similar to that described in Ref.masumoto1976, . Briefly, polycrystalline CuCr2Se4 was used as the precursor with iodine gas as transport agent placed in a sealed quartz tube (length: 15 cm; diameter: 1.5 cm). The source temperature was maintained at 870∘C while the crystal growth at the other end of the tube occurred at 770∘C. The reaction was carried out for a period of 80 hours, after which the tube was cooled down and broken to collect the single platelet-like crystals with (111) surfaces (see Fig.1) deposited in the cooler zone.
The Raman spectra were measured with five laser lines (784, 633, 515, 488, and 458 nm) using a T64000 spectrometer equipped with microscope and heating stage. In temperature-dependent studies the laser power at the probe spot (3-4 m diameter) was kept below 0.1 mW to assure negligible local laser heating.
III Results and Discussion
The structure of MCr2X4 is described by the (No. 227) space group. The primitive cell contains 14 atoms and the reduction of the 42-dimensional representation at into irreducible representations gives bilbao :
The , , and the three modes are Raman-active, Four of the five modes are IR-active and one is an acoustic mode. The , 2, 2, and 2 modes are silent. Simple calculations for backward scattering from a (111) surface (Table I) show that the scattered intensity should not depend on the rotation of the crystal surface around the propagation direction of the incident light, but only on the angle between the incident and scattered polarizations.
| parallel | crossed | ||
| Mode | |||
| 0 | |||
III.1 Raman spectra
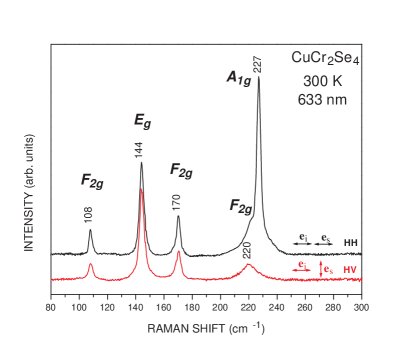
Fig.2 shows the Raman spectra of CuCr2Se4 obtained with 633 nm excitation at room temperature with parallel() and crossed() scattering configurations. Based on the selection rules of Table I the symmetries of the Raman lines at 108 cm-1 (), 144 cm-1 (), 170 cm-1 (), 220 cm-1 (), and 227 cm-1 (), are unambiguously determined. The Raman mode frequencies of CuCr2Se4 are compared to those of isostructural ZnCr2Se4wakamura1976 , CdCr2Se4iliev1978 and HgCr2Se4iliev1978a in Table II.
| CuCr2Se4 | ZnCr2Se4 | CdCr2Se4 | HgCr2Se4 | |
|---|---|---|---|---|
| Mode | this work | Ref.wakamura1976, | Ref.iliev1978, | Ref.iliev1978a, |
| 227 | 240 | 242 | 236 | |
| 144 | 152 | 156 | 153 | |
| 108 | 112 | 85 | 60 | |
| 170 | 182 | 169 | 164 | |
| 220 | 230 | 226 | 207 |
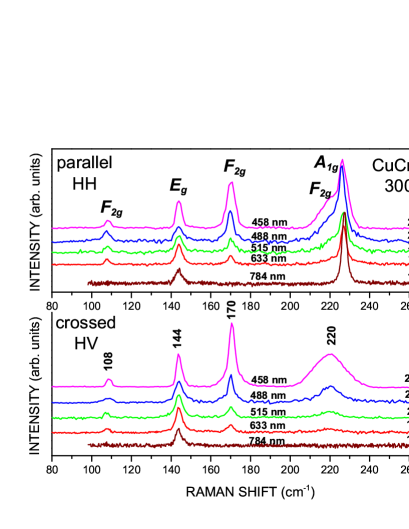
The spectra obtained with 784 nm(1.58 eV), 633 nm(1.96 eV), 515 nm(2.41 eV), 488 nm(2.54 eV), and 458 nm(2.71 eV), normalized to the intensity of the mode, are compared in Fig.3. The most obvious change with increasing excitation photon energy is the increase of the relative intensity of the modes near 170 and 220 cm-1. Similar resonant behavior has been reported for CdCr2Se4.iliev1978
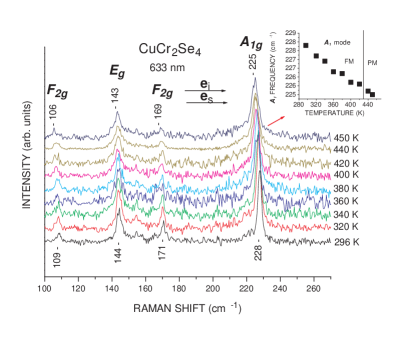
The temperature-dependent Raman spectra between 300 and 460 K as obtained with 633 nm excitation are shown in Fig.4. The variations of the phonon parameters do not exhibit detectable anomalies near the magnetic transition that may be considered as manifestation of strong spin-phonon coupling. Here again the results are similar to those for CdCr2Se4 and HgCr2Se4.iliev1978 ; iliev1978a
III.2 Lattice Dynamics Calculations
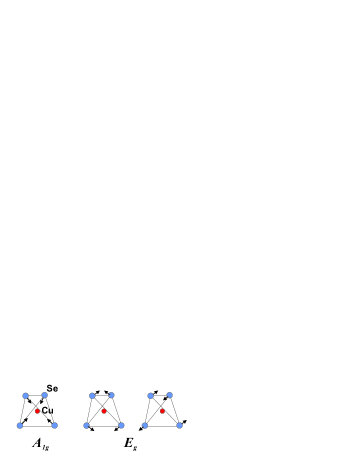
As it is clear from the experimental results, the polarized Raman measurements allow complete discrimination of the Raman-active modes of different symmetry. In the and vibrations only Se atoms are involved. The displacement vectors of the Se atoms in these modes are determined uniquely on the basis of symmetry considerations (see Table III). The corresponding displacement patterns are shown in Fig.5. The mode is a symmetric radial breathing of the CuSe4 tetrahedra while the mode is a result of Se displacement tangential to the Cu-Se bonds. In modes, however, a strong admixture of Cu and Se vibrations could be expected due to the comparable atomic masses of copper and selenium Thus, lattice dynamics calculations are necessary in order to obtain detailed information for the atomic displacements in these modes.
Lattice dynamical calculations for isostructural MCr2X4 chalcogenides (M=Zn,Cd,Hg; X=S,Se) reported before are based on valence force fields gupta1990 ; zwinscher1995 or a rigid-ion model (RIM).kushwaha2008 The valence force constants are of limited transferability in compounds with significant ionic bonding. As noted in Ref. zwinscher1995, , the character of the various phonons as relating to eigenvectors and potential energy distribution differs to a much larger extent than expected for isostructural compounds. The rigid-ion model proposed in Ref. kushwaha2008, is based upon pairwise cation-anion and anion-anion short range potentials. The potential parameters, however, are mapped onto a set of effective stretching and bending force constants constants. The reported effective force constants do not display a clear trend over the series of different M atoms, and their transferability in the case of M=Cu is not evident. Moreover, RIM does not account for the atomic polarizabilities and is unable to reproduce other important lattice properties as the high-frequency dielectric constant, the LO-TO splitting, as well as the off-diagonal elastic constants.
| Mode symmetry | Normalized displacement vectors |
|---|---|
For the reasons outlined above we performed lattice dynamics calculations for CuCr2Se4 in the frame of the shell model (SM), which is the minimal extension over RIM capable to account for the ionic polarizability and to predict correct LO-TO splitting. In order to reduce the number of adjustable model parameters some physical simplifications were adopted. First, a valence shell was considered for the Se atoms only while Cu and Cr were treated as rigid ions. Second, the van der Waals attractive interaction was considered to act only between Se shells, while it was neglected for the Cu (Cr) core - Se shell pairs. These assumptions are justified by the much higher polarizability of the Se-2 ion compared to that of the transition-metal ions. The rigid-ion approximation for transition-metals is a common approximation in the shell-model calculations on transition-metal oxides.Lewis The short-range interatomic interactions were modelled by a Buckingham potential: , where a non-zero van der Waals constant was retained for the Se shell - Se shell pairs only.
Even with the above simplifications the number of adjustable parameters exceeds the number of observables for CuCr2Se4, the lattice constant , the Se fractional coordinate and the five Raman-mode frequencies. For this reason, the , and parameters for the Se-Se interaction, the Se core and shell charges and , and the Se core-shell spring constant were adjusted initially by fitting of the lattice constant, static and optical dielectric constants, the LO and TO phonon frequencies, and the elastic modulus in ZnSe. As a next step these parameters were transferred to CuCr2Se4 and the parameters of the Cu-Se and Cr-Se core-shell interactions were optimized in order to fit the lattice parameter, the Se fractional coordinate and the frequencies of the Raman-active modes. The list of as obtained SM parameters is shown in Table IV.
| Core-shell | |||
| Atom | Core charge | Shell charge | spring constant |
| (eV/Å2) | |||
| Cu | 1.00 | ||
| Cr | 2.30 | ||
| Se | 2.19 | -3.59 | 69.7 |
| Atomic pair | (eV) | (Å) | (eVÅ6) |
| Cu core - Se shell | 6827.4 | 0.2364 | 0 |
| Cr core - Se shell | 13817.5 | 0.2513 | 0 |
| Se shell - Se shell | 1482.2 | 0.3440 | 136.3 |
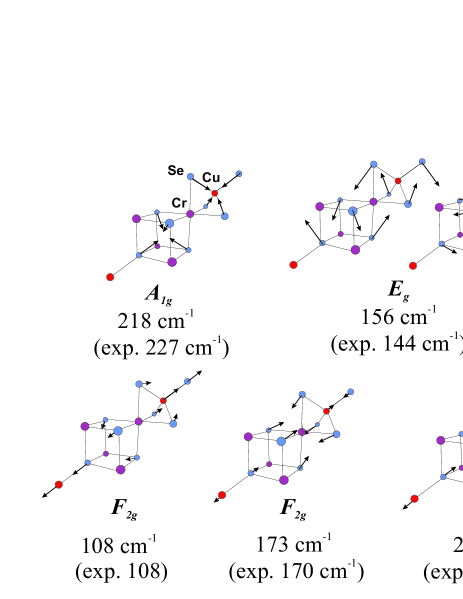
A comparison between the calculated and the experimental lattice parameters and Raman-mode frequencies is shown in Table V. The calculated atomic displacements for the three modes are depicted in Fig.6. The lowest-frequency mode at 108 cm-1 consists of an almost pure Cu translation within a practically static Se cage. This assignment corroborates the fact that the mode frequency scales with the mass of the A atom (A = Cu, Cd, Hg) as (see Table-II). As an additional piece of evidence, we performed phonon calculations by substituting Cu with Cd and Hg and keeping the same values for the interatomic potentials. We obtained the frequencies of the lowest mode at 83 cm-1 for A = Cd and 63 cm-1 for A = Hg in perfect agreement with the experimental values. The medium-frequency mode at 173 cm-1 can be described as Cu translation against the Se cage, which moves in the opposite direction. The highest-frequency vibration at 200 cm-1 is a superposition of an in-phase stretching of the Cu-Se bonds and Se-Cu-Se angle bending.
| Cell parameters | Exp | Calc |
|---|---|---|
| Lattice constant, (Å) | 10.337 | 10.363 |
| Se position, | 0.382 | 0.383 |
| Frequency | Mode description | ||
|---|---|---|---|
| Mode | Exp | Calc | in terms of CuSe4 vibrations |
| 108 | 108 | Cu translation | |
| 144 | 156 | Se-Cu-Se bending | |
| 170 | 173 | Cu translation agains Se | |
| 220 | 200 | Cu-Se stretching + Se-Cu-Se bending | |
| 227 | 218 | symmetric Cu-Se stretching | |
III.3 Resonant Behavior of Raman Scattering
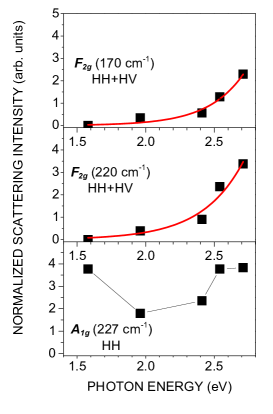
The Raman scattering cross-section in non-transparent materials is related to the combined electronic density of states. As a rule is proportional to the and has maxima near interband gaps. The experimentally observed dependence of the Raman intensity on the excitation photon energy , however, is additionally modified by the spectral properties of the Raman setup and the absorption and reflection losses, which occur for the incident and scattered light. The detail analysis of resonant Raman scattering in closely related CdCr2Se4 has shown that has a maximum near 2 eV.iliev1978 It has also been shown in that study that the intensity of the Raman lines, if normalized to the intensity, strongly increases with photon energy between 1.5 and 2.8 eV thus demonstrating the dependence of scattering cross section on the phonon symmetry. As it follows from Fig.3, similar enhancement of the relative intensity of the modes is observed for CuCr2Se4. Fig.7 shows in more detail the variation with of the normalized intensity for the 170 cm, 220 cm, and 227 cm modes.
For tentative explanation of the resonant enhancement of the intensity let us consider the ab initio electronic structure calculations Ogata ; Antonov for CuCr2Se4. Following these calculation the electronic density of states (DOS) above the Fermi level is dominated by the Cr states, while those below the Fermi level by the Cu and the Se states. An optical transition between Cu and Cr bands can be disregarded due to the large spatial separation between the Cu and Cr ions. Therefore, a possible candidate for an optical transition could be an electron transfer between the Se and Cr orbitals. Transition energies of 3.2 eV between Se and Cr states, and 2.84 eV between Se and Cr states could be expected on the basis of calculated centers of gravity of the corresponding bands Antonov . The latter value is close the experimentally observed maximum at 2.75 eV of the optical conductivity of CuCr2Se4 reported by Ongushi et al.ongushi2008
The lattice dynamics calculation can help us understand why A1g and modes exhibit stronger coupling to Se - Cr transitions than the . The coupling of a Raman-active phonon to an optical transition is mainly due to two mechanisms: (i) modulation of the dipolar transition moment, and (ii) modulation of the transition energy by the atomic displacements. As a rule the modulation of the transition energy has stronger resonant behavior and gives a dominant contribution to the Raman scattering intensity under resonant conditions. We will consider the optical transitions in a simplified tight-binding picture assuming that the transition energy is roughly equal to the difference between the on-site energies of the Se and Cr orbitals. Since the on-site energy is a scalar quantity, it transforms according to the permutational representation of the given atomic position. The decomposition of the permutational representations for the 16d (Cr) and 32e (Se) positions gives:
| (1) | |||
| (2) |
Therefore, among Raman-active modes only A1g and F2g modulate the Se and Cr orbital energies and respectively the energy of the transitions. This fact can be understood by inspecting the atomic displacement patterns in Fig. 6. In the A1g and F2g modes the Se displacements have identical radial components relative to the Cr atom and, therefore, give identical variations of the Madelung potential at the Cr site. For the mode, however, the radial components of the Se displacements are of alternating signs leading to cancelation of the Madelung potential variations at the Cr site. By following our lattice dynamics calculations it is easy to note that the resonant enhancement of the F2g modes increases with the increase of the radial character of the vibration. Interestingly, the mode shows an enhanced normalized intensity also with 784 nm(1.58 eV) excitation, which is in the energy range of the Cr transitions.ongushi2008
IV Conclusions
The Raman spectra of the ferromagnetic spinel CuCr2Se4 ( K) was studied experimentally and analyzed theoretically by calculation of lattice dynamics. The normalized Raman scattering intensity for A1g and F2g exhibits resonant behavior similar to that known for the isostructural CdCr2Se4, but no significant phonon anomalies are observed near .
Acknowledgements.
This work was support in part by the State of Texas through the Texas Center for Superconductivity at the University of Houston and by NSF MRSEC (Grant No.DMR-0213985) and partly by the contract # DO 02-167/2008 of the Bulgarian National Fund for Scientific Research.References
- (1) P. J. Wojtowicz, IEEE Trans. Magn. 5, 840 (1969).
- (2) C. Haas in New Developments in Semiconductors, ed. by P. R. Wallace et al., p.1, Noordhof International Publishing, Leyden, 1973 and references therein.
- (3) A. P. Ramirez, R. J. Cava, and J. Krajewski, Nature (London) 386, 156 (1997).
- (4) Y.-H. A. Wang, A. Gupta, M. Chshiev, and W. H. Butler, Appl. Phys. Lett. 92, 062507 (2008); Y.-H. A. Wang, A. Gupta, M. Chshiev, and W. H. Butler, Appl. Phys. Lett. 94, 062515 (2009).
- (5) K. Masumoto and I. Nakatani, Trans. Japan. Inst. Metals 17, 519 (1976).
- (6) M. I. Aroyo, J. M. Perez-Mato, C. Capillas, E. Kroumova, S. Ivantchev, G. Madariaga, A. Kirov and H. Wondratschek, Z. Kristallog. 221, 15 (2006).
- (7) K. Wakamura, T. Arai, and K. Kudo, J. Phys. Soc. Jpn. 40, 1118 (1976).
- (8) M. Iliev, G. Güntherodt, and H. Pink, Solid State Commun. 27, 863 (1978).
- (9) M. Iliev, E. Anastassakis, and T. Arai, Phys. Stat. Sol.(b) 86, 717 (1978).
- (10) H. C. Gupta, A. Parashar, and V. B. Gupta, Phys. Stat. Sol.(b) 160, K19 (1990).
- (11) J. Zwinscher and H. D. Lutz, J. Solid State Chem. 118, 43 (1995).
- (12) A. K. Kushwaha, Commun. Theor. Phys. 50, 1422 (2008).
- (13) G.V. Lewis and C.R.A. Catlow, J. Phys. C: Solid State Phys. 18, 1149 (1985).
- (14) F. Ogata, T. Hamajima, T. Kambarat, and K. I. Gondaira, J. Phys. C 15, 3483 (1982).
- (15) V. N. Antonov, V. P. Antropov, B. N. Harmon, A. N. Yaresko, and A. Ya. Perlov, Phys. Rev. B 59, 14 552 (1999).
- (16) K. Ongushi, Y. Okimoto, T. Ogasawara, S. Miyasaka, and Y. Tokura, J. Phys. Soc. Japan 77, 034713 (2008).