Hubble/COS Observations of the Ly Forest toward the BL Lac Object 1ES 1553113111Based on observations made with the NASA/ESA Hubble Space Telescope, obtained from the data archive at the Space Telescope Science Institute. STScI is operated by the Association of Universities for Research in Astronomy, Inc. under NASA contract NAS 5-26555.
Abstract
We present new moderate-resolution, far-ultraviolet spectra from the Hubble Space Telescope/Cosmic Origins Spectrograph (HST/COS) of the BL Lac object 1ES 1553113 covering the wavelength range . The data show a smooth continuum with a wealth of narrow ( km s-1) absorption features arising in the interstellar medium (ISM) and intergalactic medium (IGM). These features include 41 Ly absorbers at , fourteen of which are detected in multiple Lyman lines and six of which show absorption in one or more metal lines. We analyze a metal-rich triplet ( km s-1) of Ly absorbers at in which O VI, N V, and C III absorption is detected. Silicon ions (Si III, Si IV) are not detected to fairly strong upper limits, and we use the measured Si III/C III upper limit to derive an abundance limit for the strongest component of the absorber complex. Galaxy redshift surveys show a number of massive galaxies at approximately the same redshift as this absorption complex, suggesting that it arises in a large-scale galaxy filament. As one of the brightest extragalactic X-ray and -ray sources, 1ES 1553113 is of great interest to the high-energy astrophysics community. With no intrinsic emission or absorption features, 1ES 1553113 has no direct redshift determination. We use intervening Ly absorbers to place a direct limit on the redshift: based on a confirmed LyO VI absorber and based on a single-line detection of Ly. The current COS data are only sensitive to Ly absorbers at , but we present statistical arguments that (at a confidence limit) based on the non-detection of any Ly absorbers at .
Subject headings:
BL Lacertae objects: individual: 1ES 1553113, galaxies: active, intergalactic medium, quasars: absorption lines, ultraviolet: general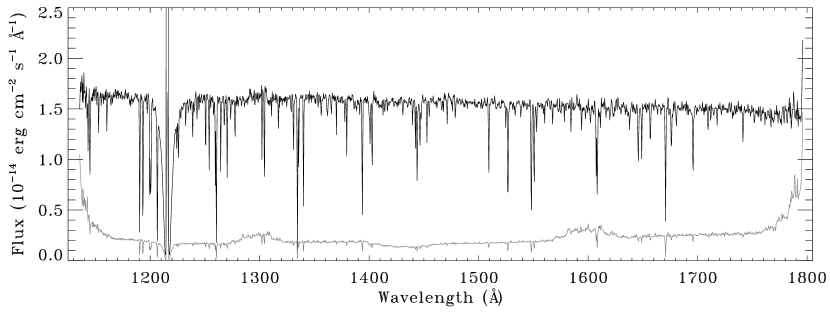
1. Introduction
The current interpretation of BL Lac objects (Ghisellini, Maraschi, & Treves, 1985) is that they are active galactic nuclei (AGN) with a strongly relativistic jet pointed toward our line of sight. As such, any line emission or accretion disk features seen in most other types of AGN could be masked by the bright jet if present in BL Lac objects. Their spectra usually show a featureless power-law continuum extending from radio to X-ray wavelengths. This spectral characteristic makes BL Lac objects ideal for observing intervening absorption features arising in the interstellar medium (ISM) and intergalactic medium (IGM). Since their continuum is easily defined, they make excellent targets for studying weak metal-line systems and low-contrast, highly thermally broadened H I absorbers (e.g., Richter et al., 2004; Lehner et al., 2007; Danforth, Stocke & Shull, 2010).
The BL Lac object 1ES 1553113 shows the characteristic featureless power-law spectrum and is one of the brightest known sources of extragalactic high-energy radiation from X-rays up to VHE (TeV) photons (Costamante & Ghisellini, 2002). However, the featureless spectrum makes it difficult to determine the redshift of the object and hence its luminosity. Indirect methods have given a wide range of limits for the redshift of 1ES 1553113; the nondetection of a host galaxy gave limits from to (Hutchings & Neff, 1992; Scarpa et al., 2000; Urry et al., 2000; Carangelo et al., 2003; Sbarufatti et al., 2006; Treves, Falomo, & Uslenghi, 2007). The shape of the -ray spectrum observed by the Fermi Observatory and ground-based VHE detectors (HESS, MAGIC) constrains the redshift to values from to (Aharonian et al., 2006; Albert et al., 2007; Mazin & Goebel, 2007; Abdo et al., 2010) based on assumptions about the intrinsic spectral energy distribution (SED) and pair-production interactions with the cosmic infrared background. The only direct redshift determination (; Miller & Green, 1983) was based on a spurious feature in low-resolution UV spectra from the International Ultraviolet Explorer (IUE). The detection was later retracted (Falomo & Treves, 1990), but the erroneous redshift value lives on.
1ES 1553113 is of interest as a bright background continuum source for detecting intergalactic absorption along the sight line. Bright X-ray sources are especially valuable for potentially detecting the long-predicted O VII and O VIII tracers (Bregman, 2007) of intergalactic gas at K. Even for a bright X-ray source, the required integration times would be very long. However, a sufficiently long IGM pathlength provided by a bright high- target would make the required observing time investment more attractive.
In this paper, we present the first medium-resolution far-UV spectroscopic observations of 1ES 1553113 including Hubble Space Telescope/Cosmic Origins Spectrograph (HST/COS Green et al., 2010; Osterman et al., 2010) observations ( Å) as well as archival data at Å from the Far Ultraviolet Spectroscopic Explorer (FUSE; Moos et al., 2000; Sahnow et al., 2000). We confirm the featureless power-law nature of the spectrum over this wavelength range. Absorption is seen in 42 intervening systems including 41 Ly absorbers and six metal-line systems. The frequency of IGM absorbers is consistent with larger surveys using FUSE and HST/STIS data (Danforth & Shull 2005, 2008; hereafter DS08), and the systems are spread across the entire redshift range covered by the combined COS/FUSE dataset ().
The observations and data reduction techniques are discussed in §2, and we present a preliminary catalog of absorption lines in §3. Our conclusions are presented in §4.
2. Observations and Data Analysis
Far-UV observations of 1ES 1553113 were carried out 2009 September 22 by HST/COS as part of the COS Guaranteed Time Observations (PID 11528, PI Green). Five exposures were made in each of the G130M ( Å) and G160M ( Å) medium-resolution gratings () totalling 3.1 and 3.8 ksec, respectively. Four central wavelength settings at each grating dithered known instrumental features along the spectrum and provided continuous spectral coverage over Å (see Green et al., 2010; Osterman et al., 2010). After retrieval from the archive, all ten exposures were reduced locally using CalCOS v2.11f.
Flat-fielding, alignment, and coaddition of the processed exposures were carried out using IDL routines developed by the COS GTO team specifically for COS FUV data222See http://casa.colorado.edu/danforth/costools.html for our coaddition and flat-fielding algorithm and additional discussion.. First, the data were corrected for the most egregious instrumental features. While attempts at a true “flat-fielding” of COS data show promise, the technique is not yet robust enough to improve data of moderate S/N. However, we are able to correct the narrow 15%-opaque features arising from ion repellor grid wires in the detector. A one-dimensional map of grid-wire opacity for each detector was shifted from detector coordinates into wavelength space and divided from the flux and error vectors. Exposure time in the location of grid wires was decreased to %, giving these pixels less weight in the final coaddition. We also modify the error and local exposure time at the edges of the detector segments to de-weight flux contributions from these regions. With four different central wavelength settings per grating, any residual instrumental artifacts from grid-wire shadows and detector segment boundaries should have negligible effect on the final spectrum.
The exposures are aligned with each other and interpolated onto a common wavelength scale. One exposure in each grating/detector was picked as a wavelength reference, and the remaining exposures were cross-correlated with it. The wavelength region of cross-correlation for each case was picked to include a strong ISM absorption feature, and shifts were typically on the order of a resolution element ( Å) or less. The COS wavelength solution has not yet been rigorously characterized, and we see a systematic shift between strong ISM lines and their expected LSR velocities. The shift is approximately constant across the COS wavelength range, so we apply a uniform Å shift to the wavelength vectors ( km s-1 at Å) to bring ISM line centroids to the expected seen in many ISM absorbers.
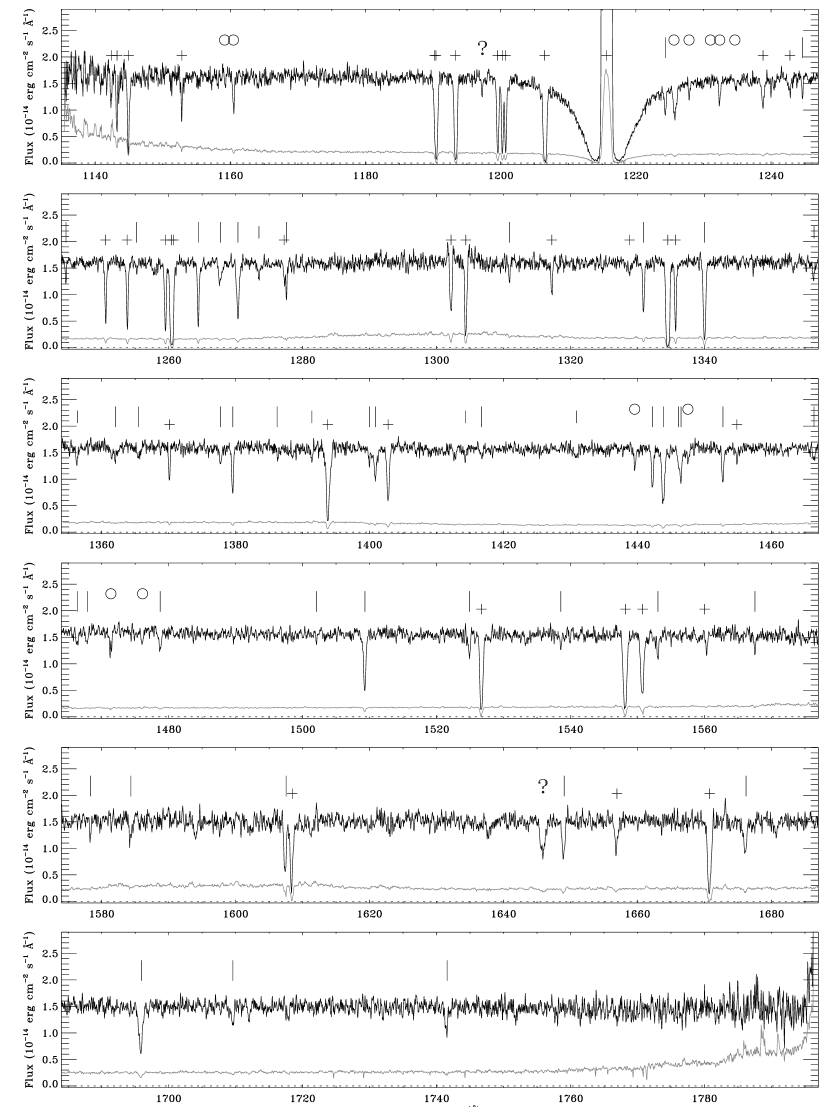
Next, the aligned exposures were interpolated onto a uniform wavelength grid and coadded. The flux at each position was taken to be the exposure-weighted mean of flux in each exposure. Since exposure time was reduced in certain wavelength locations, as noted above, pixels near detector edges and where grid-wire shadows were removed received less weight than those in less suspect locations. The combined data show per 7-pixel ( Å) resolution element and are sufficient to detect narrow absorption features down to mÅ at significance. Figure 1 shows the entire combined COS/G130M and COS/G160M spectra. Figure 2 shows a more detailed view of the spectrum with prominent lines marked.
In addition to the COS data, we utilize 45 ksec of Far Ultraviolet Spectroscopic Explorer (FUSE) observations taken 2004 April as part of program E526 (PI: Savage). While FUSE data alone are insufficient to characterize the H I absorber systems along a sight line, far-UV coverage is invaluable for confirming Ly lines at via Ly absorption. Additionally, O VI 1032, 1038 and C III 977 absorbers are found only in FUSE data at and , respectively. Thirty-seven FUSE exposures were retrieved from the archive and processed in the usual manner (Danforth & Shull, 2005). The final FUSE spectrum covers Å with per km s-1 resolution element.
3. Absorption Lines
An initial analysis of the spectrum reveals a wealth of far-UV absorption features (Figures 1 and 2). Many of these are clearly Galactic ISM lines typical of most sight lines to Galactic and extragalactic sources. We label the remainder as redshifted IGM absorbers. To identify these lines, we follow a procedure similar to that employed in DS08: starting from the long-wavelength end of the spectrum, we interactively mark the strongest absorpton features, tentatively identifying them as Ly. The location of the corresponding Ly absorption is then checked, as are those of prominent metal-ion absorbers (O VI 1032, 1038; C IV 1548,1550; Si III 1207; C III 977, etc.). This process is iterative, as we identify weaker and weaker features. If there is component structure in a line profile that can be unambiguously deconvolved into multiple absorbers, we list these systems separately. However, most systems are listed as a single absorber, even if they possess rather complex line profiles.
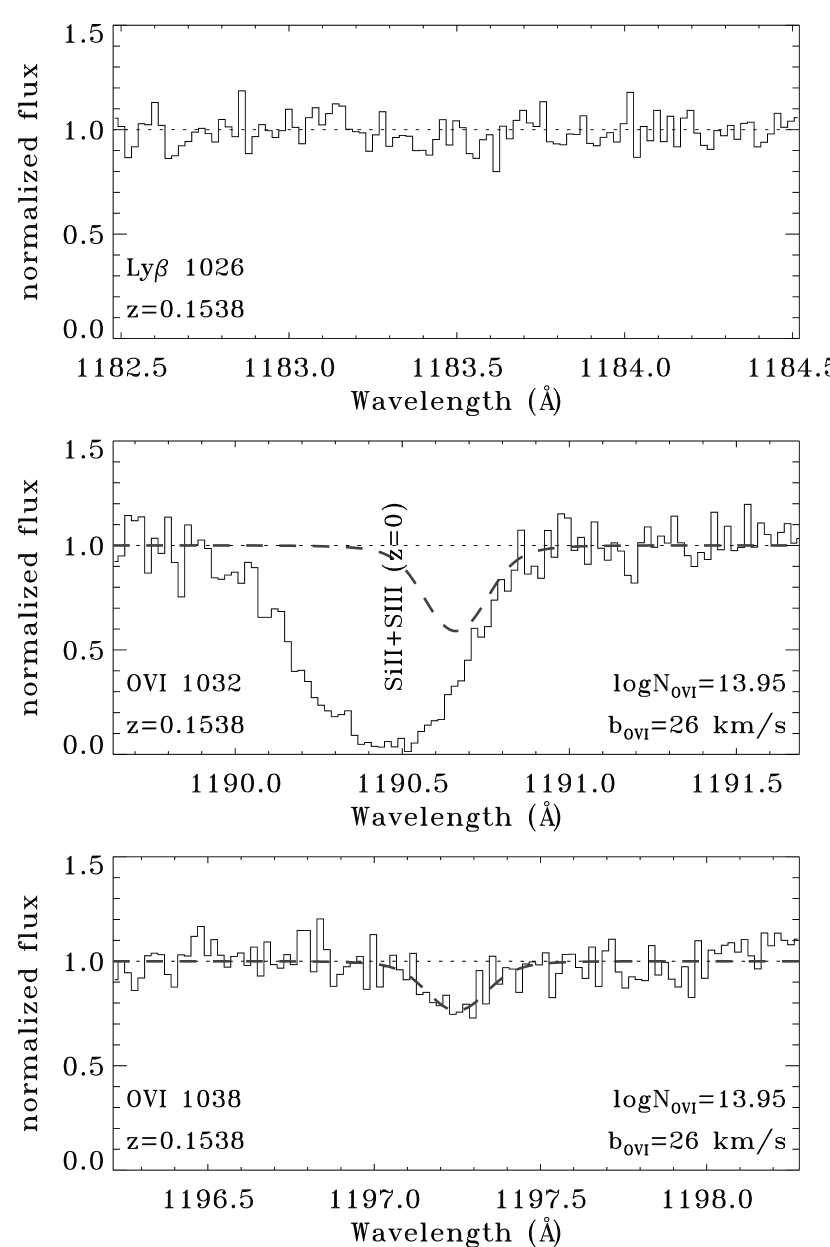
We note two significant absorption features at 1197.25 Å and 1645.9 Å with highly ambiguous identifications. The weak feature at 1197.25 Å ( mÅ) cannot be Ly, nor is it consistent with either a higher-order Lyman line or any obvious metal-ion absorber for any of the known H I systems. The most plausible identification is that of O VI 1038 at (Fig. 3). The stronger 1032 line of the O VI doublet is blended with Galactic Si II 1190. No H I absorption is seen at this redshift in Ly, and a upper limit on the column-density can be set at . Ly absorption at this redshift is blended with the weaker line of the Galactic Si IV doublet at 1403. However, the Galactic Si IV lines appear in the expected 2:1 ratio, leaving little room for additional blended Ly absorption. It appears possible that this is a WHIM absorber with high enough temperature and metallicity that no neutral gas is seen (see also Savage et al., 2010).
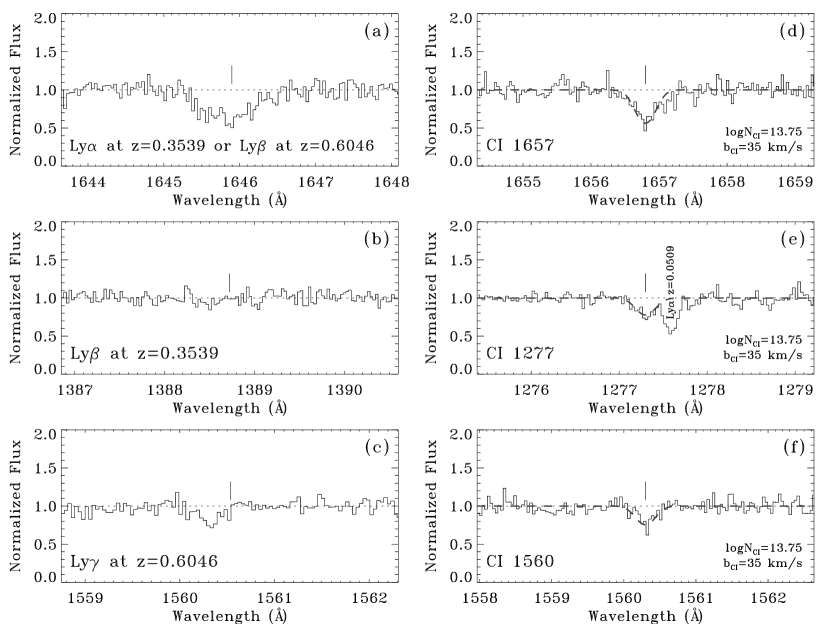
The strong absorption line at 1645.9 Å ( mÅ) could be identified as Ly at , but the expected Ly absorber ( mÅ) is not seen (Fig. 4a,b). The line is consistent with being Ly absorption at , and an equivalent Ly feature is seen at 1560.3 Å at approximately the expected strength (Fig. 4a,c). However, the latter feature is consistent with Galactic C I absorption lines seen elsewhere in the data (Fig. 4d-f). Therefore, we tentatively identify this feature as a multi-component Ly system at . Two or more Ly features of the required strengths can plausibly be hidden in the noise at the required location.
Table 1 lists measurements for all detected IGM absorption lines, grouped by redshift, and including the two ambiguous cases above. In total, we identify 42 IGM absorbers (Table 1), 41 of which are detected in at least Ly. Corresponding higher-order Lyman line and/or metal ion absorption is seen in 15 absorbers. Seven systems show metal absorption. The observed Ly absorber frequency per unit redshift, , down to a limiting equivalent width of 50 mÅ (), is similar to that found for the larger DS08 sample to the same limit (). A more thorough search for broad Ly absorbers with km s-1 will be conducted, following the receipt of additional data on this source scheduled for Cycle 18. Therefore, we caution the reader that this line list may not be complete for lines with km s-1.
4. Results and Discussion
An additional six orbits of COS integration time planned for Cycle 18 should improve the S/N of the combined dataset by a factor of . Greatly improved S/N, as well as our evolving understanding of the COS instrumental effects, will enable us to reliably measure low-contrast absorbers such as broad Ly systems and weak metal lines. We defer a more exhaustive analysis of the sight line until then, but note two key results here.
4.1. Triple Absorber Complex at
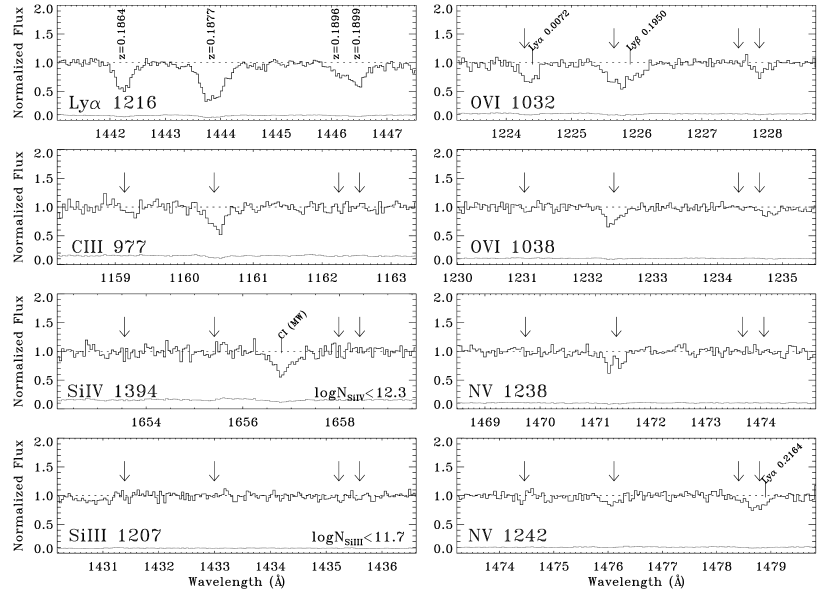
The most interesting of the previously undiscovered IGM absorption systems is the triplet of metal-rich absorbers at , , and (Figure 5). In Ly, the strong central absorber at is flanked by two weaker components at and , or km s-1 and km s-1, respectively, relative to the system at .
The three absorption systems at span km s-1 in comoving velocity space, appropriate for a large-scale filament in the cosmic web. We searched the SDSS Data Release 7 galaxy redshift catalog (Abazajian et al., 2009) for galaxies within one degree of the 1ES 1553113 sight line and plotted them as a function of redshift (Fig. 6, top panel). While the SDSS is complete only in the brightest galaxies () at this redshift, a clear concentration appears at . None of these galaxies is closer than 24′ ( Mpc at ) to the line of sight, so it is hard to claim a specific galaxy-absorber relationship (Figure 6, bottom panel). However, the median redshift of the galaxy sample is and the deviation () is roughly one-third of the redshift search space (). This tight clustering around the absorber redshift, as well as the observed spatial distribution of the brightest galaxies, suggests that the galaxies trace a large-scale filament in the cosmic web and that the absorption in the COS observations arises in the same structure. Deeper galaxy survey work (Keeney et al., in preparation) is complete to much lower luminosity () and may show a closer galaxy-absorber relationship.

O VI absorption is seen in all three systems (, , and , respectively). Strong N V absorption is seen in the central component (). DS08 measure in eleven O VIN V low- IGM absorbers, so the ratio observed at toward 1ES 1553113 () is high but within the observed range. The DS08 sample is a biased toward higher values, the observed ratio suggests an elevated N/O abundance in this absorber.
C III is detected in the central and blue components ( and , respectively), but upper limits of and can be placed on Si-ion absorption in all three systems. Si II 1260 is tentatively detected at as a pair of weak, narrow components with a total column density . However, we do not detect other Si II lines, nor equivalent absorption in C II 1334.5 or C II 1036.3 () and other singly-ionized species.
It is likely that the gas in the central Ly system is multi-phase in nature, with a warm-hot ionized medium (WHIM) component traced by O VI and N V and a cooler, photoionized component traced by H I and C III. The “multiphase ratios” for these absorbers (Danforth & Shull, 2005, 2008) are , , and for the three main components. Typical values for absorbers with similar are , , and , respectively (Danforth & Shull, 2005). We can use the Ly and low-ionization metal detections and upper limits to constrain metallicity and relative abundances in the photoionized gas. In particular, C III and Si III have similar ionization potentials and are often detected in the same systems. At solar abundance ratios (Asplund et al., 2009), carbon is 8.3 times more abundant than silicon, but Si III is detectable to much lower column densities than C III owing to the very strong -value of the 1206.5 Å transition (Shull et al., 2009). Thus, the two ions are often seen together in photoionized IGM absorbers (DS08).
We measure in the absorber, an unusually high lower limit. DS08 report C III and Si III detections in 22 low- IGM systems with a median distribution of (). In Galactic High Velocity Clouds (Fox, Savage, & Wakker, 2006; Shull et al., 2009) the ratio, , typically ranges from 5–20. Thus, the abnormally high ratio found in these IGM absorbers is well outside the usual range. Comparing our measurements with a grid of simple CLOUDY photoionization models (detailed in Danforth et al., 2006), we see that the relative column densities of C III and Si III are fairly insensitive to photoionization parameter . Typical model ratios are in the expected range of IGM photoionization parameters () and are largely insensitive to assumptions about metallicity, photon continuum, and gas density.
The unusually high C III/Si III ratio suggests that the C/Si abundance in this system may have a strongly non-solar abundance pattern. If is typically 10% of , as seen in other IGM observations and models, , or greater than four times the solar value. Comparing the observed / ratio with the models, we expect for . However, the observed column density ratio is an order of magnitude higher, suggesting that (C/H) is close to solar values in this system. Without additional low-ionization species detected, we cannot determine whether carbon is overabundant or silicon is underabundant relative to the solar ratio. The C III detection at is factor of four weaker than in the main absorber, while the upper limit on is the same. Therefore, this system puts weak constraints on the metallicity and abundances in this absorber.
Although in the Sun (Asplund et al., 2009), variations in this abundance ratio can occur, depending on the youth of the stellar population and its initial mass function (IMF). Carbon is produced primarily by helium burning in intermediate-mass stars (red giants, horizontal branch), whereas silicon arises from more advanced -process nucleosynthesis in massive stars. The usual abundance trends show enhanced (Si/C) and reduced (N/O) in low-metallicity stellar populations (McWilliam, 1997; Cayrel et al., 2004). Theoretical predictions (Woosley & Weaver, 1995) show that [/Fe] increases with increasing progenitor mass (here, includes O, Mg, Si, S, Ca, Ti). Thus, a low Si and O abundance compared to C and N suggests an IMF skewed toward low-mass stars.
Comparing H I or C III to high ions O VI and N V requires them to be in the same thermal phase for a meaningful analysis. Hybrid ionization modeling (CIE plus photoionization) of the high ions in this system are reported by Yao et al. (2010), in which the system is used as a test case for a physical parameter-based absorption line modeling exercise.
4.2. Constraining the Redshift of 1ES 1553113
The redshift of 1ES 1553113 is crucial to determining the intrinsic properties of the source. Indirect methods of constraining the redshift of 1ES 1553113 fall into two categories. First, the ratio of AGN to host galaxy optical luminosity in BL Lacs is thought to cover a fairly small range (Wurtz, Stocke & Yee, 1996; Sbarufatti, Treves, & Falomo, 2005). Various deep ground-based (Hutchings & Neff, 1992; Scarpa et al., 2000) and space-based (Urry et al., 2000; Carangelo et al., 2003; Sbarufatti et al., 2006; Treves, Falomo, & Uslenghi, 2007) optical studies have failed to detect a host galaxy beneath the glare of the AGN. From these non-detections, redshift limits from to have been set by various groups. Treves, Falomo, & Uslenghi (2007) refined this to using a more sophisticated analysis of the same optical data. However, the validity of the assumption of host/nuclear luminosity relationship has been called into question by O’Dowd & Urry (2005).
A complementary technique uses the observed very high energy (VHE) spectrum ( GeV) to place limits on the redshift of BL Lacs. This method assumes that the VHE spectral energy distribution (SED) of an object will be modified, as TeV photons interact with photons in the ambient extragalactic background and produce pairs (e.g., Younger & Hopkins, 2010; Persic & De Angelis, 2008). The longer the pathlength, the steeper the VHE SED becomes. Uncertainties in the extragalactic IR background and the intrinsic SED of the AGN render this method uncertain, but the redshift of 1ES 1553113 has variously been constrained to (Aharonian et al., 2006; Albert et al., 2007) or or (Mazin & Goebel, 2007) based on HESS and MAGIC observations. Abdo et al. (2010) use data from the first six months of Fermi -ray observations in conjunction with observations from radio wavelengths to 1 TeV to model the intrinsic SED of 1ES 1553113. Based on these models, they determine a redshift . The error bars on this estimate appear to be much smaller than justified by this method.
From Figures 1 and 2, it is clear that there are H I systems throughout the redshift range from to near the end of the COS spectral coverage (). A strong line at 1695 Å is identified as Ly at and confirmed by detection of O VI at the same redshift in both lines of the doublet. This sets a firm lower limit on . Two weaker features at 1709.5 Å and 1741.5 Å appear in the data, which we identify as Ly at and , respectively. Though we do not detect higher-order Lyman or metal-ion lines at these redshifts, the two Ly absorbers are weak enough that we do not expect confirmation in other lines. The continuum of the BL Lac object remains smooth across the entire COS band (Figs. 1 and 2), and no intrinsic emission or absorption is seen.
Thus, we can confidently constrain the emission redshift of 1ES 1553113 to , and it appears likely that it may be as high as . Additional COS observations may detect corresponding Ly absorption to these two absorbers ( mÅ is expected). The confirmed and unconfirmed direct redshift limits from the HST/COS observations are compatible with both the lower limits set by the non-detection of an optical host galaxy (; Urry et al., 2000; Sbarufatti et al., 2006; Treves, Falomo, & Uslenghi, 2007) and the VHE SED upper limits upper limits (; Aharonian et al., 2006; Albert et al., 2007; Mazin & Goebel, 2007).
We now assess the validity of the most recent VHE SED redshift estimate () from Abdo et al. (2010). Our current COS far-UV spectra (G130M and G160M) are only sensitive to Ly absorbers at . However, higher redshift absorbers can be detected using the less sensitive higher-order Lyman lines or O VI doublet. COS far-UV data cover the wavelength range 1135 Å 1795 Å corresponding to Ly redshifts and O VI redshifts . Ly and O VI systems at will appear at Å. We find empirically (DS08) that the detection threshhold for absorption lines with no prior “signposts” (such as known absorber redshifts) is . The COS/G160M data in this region are of sufficiently high quality that we would expect to detect lines of mÅ at a significance level. This corresponds to rest-frame mÅ for Ly absorbers at or for Ly.
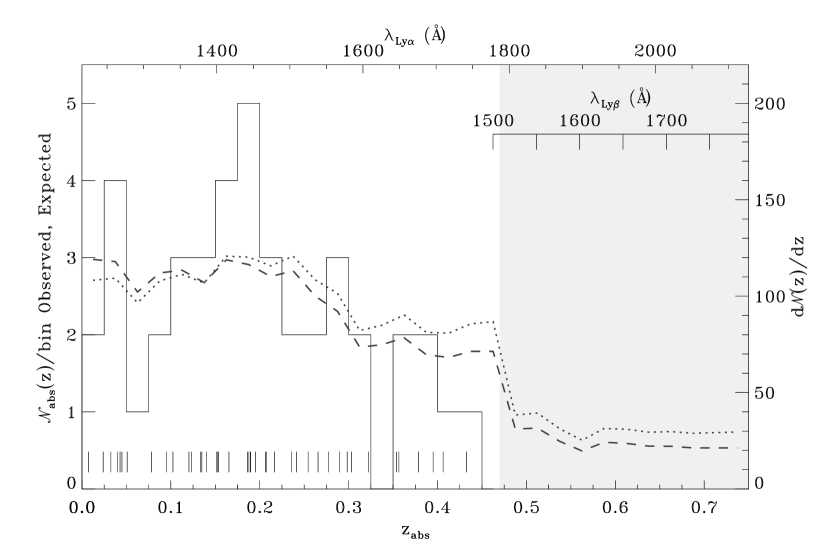
Figure 7 shows the observed and predicted distribution of IGM absorbers as a function of redshift. We calculate the expected number of absorbers per bin (alternately, ) based on the S/N-determined minimum equivalent width in each bin and the sample of H I absorbers from DS08. The dashed curve in the figure represents no evolution with redshift. The evolution of low- H I absorbers is somewhat uncertain. However, if we assume that the H I absorber frequency evolves as (Penton, Stocke, & Shull, 2004) and adopt for a modest evolution between and , the expected number of H I detections (dotted curve in Figure 7) rises at higher redshift by %. The sharp drop in expected detections at coincides with the switch from Ly to Ly as an IGM tracer (shaded area) and the resulting loss of sensitivity discussed above. Summing the expected number of Ly absorbers () which should appear at Å data from Figure 7 over the range , we find and in the constant and evolved H I models, respectively. Thus, we should expect high- Ly absorbers in the 1ES 1553113 data if .
Are the predicted high- Ly absorbers seen? As discussed in §3, the strong feature at 1645.9 Å can be ruled out as Ly at since the corresponding Ly line is consistent with Galactic C I (Fig. 4). Thirteen other absorption features longward of 1507 Å have been identified as Ly lines, and eight of these identifications are not confirmed with higher-order Lyman or metal-ion lines. If these eight single-line detections are instead interpreted as potential high- Ly systems, six have inconsistent Ly non-detections and a seventh has Ly blended with another line. The only possible high- Ly absorber is a marginal line detected at 1584.3 Å and identified as Ly at . If this line is instead identified as Ly at , the corresponding Ly absorber should be at 1502.2 Å, nearly concident with a weak feature identified as Ly at . The relative strengths of the two features are consistent with H I absorbers at , but both line detections are of relatively low significance. Additional COS observations may improve the significance of the line detections. However, we find none of the other predicted high- H I or O VI absorbers in the data, so the redshift limit from the possible Ly detection for 1ES 1553113 is very speculative.
The additional far-UV observations of 1ES 1553113 scheduled for HST Cycle 18 will improve the S/N of the current dataset by a factor of and consequently lower the minimum detectable line strength for potential Ly absorbers at by a similar factor. However, observations with the COS/G185M grating covering the wavelength range ( in Ly) would be more efficient at detecting IGM absorbers in the sight line. Despite the relatively lower efficiency of the COS near-UV gratings and detectors compared with their far-UV counterparts, the Ly lines will be times stronger than Ly and should be easily detected or ruled out with only a few kiloseconds of observations. Such observations could potentially also measure weak intrinsic broad-line Ly emission from the BL Lac object, as has been seen in other BL Lac objects at lower redshift (Danforth, Stocke, Winter, et al., in prep).
We constrain the source redshift of 1ES 1553113 statistically by truncating the model curves in Figure 7 at a range of . Applying a Kolmogorov-Smirnov test to the different models, we set a constraint of for the non-evolved model (and for the evolved H I distribution). An emission redshift of is ruled out for both models at a % or greater level of confidence. Thus, we constrain the redshift of 1ES 1553113 to the range .
5. Conclusions
The BL Lac object 1ES 1553113 is one of the brightest objects in the sky in -rays, as well as being a notable UV and X-ray source. However, the AGN emission is that of a relativistic jet aligned closely with our line of sight and, like most such objects, has no intrinsic emission or absorption features at any wavelength. This featureless, power-law continuum is ideal for measuring intervening IGM features that are weak and broad, such as thermally-broadened Ly systems. However, the lack of intrinsic features makes constraining the redshift of the object difficult.
We present unprecedented high-quality far-UV HST/COS and FUSE spectra of the BL Lac object 1ES 1553113 at spectral resolution 15-20 km s-1. These data show 42 intervening IGM absorbers, 41 of which are detected in Ly, and 15 in Ly and/or metal lines. The richest absorption system in the line of sight is a trio of Ly absorbers at covering km s-1 of velocity space. Several metal ions are also detected in these systems, including O VI, N V, and C III. However, neither Si IV nor Si III is detected in any of the systems. The C III/Si III ratio implies a (C/Si) abundance at least four times the solar value, while a high N V/O VI value suggests an overabundance of N as well. A detailed analysis of the physical conditions in this system can be found in Yao et al. (2010).
The redshift of 1ES 1553113 has never been determined directly, and the only limits placed on it come from indirect means such as the shape of the -ray spectrum and the lack of an AGN host galaxy in deep optical images. A strong LyO VI absorber at gives the first direct lower limit to the redshift of the object. Two weaker Ly absorbers at and give slightly higher estimates of the redshift, but these weak Ly lines are not confirmed by additional line detections.
These lower limits are consistent with most previous measurements via optical non-detections of host galaxies and -ray SED constraints. Abdo et al. (2010) derive based on the latest Fermi and TeV -ray SED measurements, considerably higher than our intervening absorber upper limits. COS far-UV spectra are not sensitive to Ly absorbers at , but the G160M grating has some sensitivity to intervening Ly and O VI absorbers out to . If the Abdo et al. (2010) redshift estimate were accurate, we would expect to find Ly absorbers at . We find no evidence for any higher redshift absorption systems. There are only a few absorption features at Å with ambiguous line identifications that could potentially be Ly systems at . While these systems are individually suggestive, we find nowhere near the number of absorbers predicted statistically. We conclude that the redshift of 1ES 1553113 is not much higher than .
1ES 1553113 is one of the brightest X-ray sources on the sky and has been suggested as a sight line that could be efficiently probed for WHIM absorption in O VII. The combined O VI column density in the three absorbers at is . Spectrographs on modern X-ray observatories are sensitive to . If the temperature of any of these O VI systems is high enough, sufficiently long Chandra and/or XMM/Newton observations may reveal a O VII counterpart to these O VI absorbers that could constrain the long-sought X-ray WHIM (Bregman, 2007). However, at the observed Li-like (O VI) oxygen column density, in the trio of absorbers, the expected column densities of He-like (O VII) and H-like (O VIII) oxygen are probably just below the detectability levels of Chandra and XMM. Recent analysis of stacked X-ray absorption data (Yao et al., 2009) at the known IGM redshifts of O VI absorbers finds no evidence for O VII or O VIII absorbers to a limit . Therefore, the absorbers might have X-ray column densities , just below the limits of current X-ray observatories.
Finally, these observations showcase the powerful new tool available to astronomers for probing the low-redshift IGM. COS is times more sensitive in the far-UV to point sources than previous instruments on HST. An additional six orbits of COS observations are planned for 2010, which should improve the S/N of the combined dataset by a factor of . Improving the data quality will help confirm or refute some of the tentative line identifications from this paper and will undoubtedly uncover additional weak absorbers. We will place further constraints on [C/Si] and [N/O] in the system, identify new broad, shallow Ly absorbers, and investigate possible high- Ly systems with our new Cycle 18 observations.
It is our pleasure to acknowledge the many thousands of people who made the HST Servicing Mission 4 the huge success that it was. We furthermore thank Steve Penton, Stéphane Béland, and the other members of the COS ERO and GTO teams for their work on initial data calibration and verification. C. D. wishes to acknowledge a fruitful discussion with members of the KIPAC consortium. This work was supported by NASA grants NNX08AC146 and NAS5-98043 to the University of Colorado at Boulder.
References
- Abazajian et al. (2009) Abazajian, K. N., et al. 2009, ApJS, 182, 543
- Abdo et al. (2010) Abdo, A. A., et al. 2010, ApJ, 708, 1310
- Aharonian et al. (2006) Aharonian, F., et al. 2006, A&A, 448, L19
- Albert et al. (2007) Albert, J., et al. 2007, ApJ, 654, L119
- Albert et al. (2009) Alber, J., et al. 2009, A&A, 493, 467
- Aleksic et al. (2009) Aleksić, J., et al. 2009, A&A, submitted (ArXiv:0911.1088)
- Asplund et al. (2009) Asplund, M., Grevesse, N., Sauval, A. J., & Scott, P. 2009, ARA&A, 47, 481
- Bregman (2007) Bregman, J. N. 2007, ARA&A, 45, 221
- Carangelo et al. (2003) Carangelo, N., Falomo, R., Kotilainen, J., Treves, A. & Ulrich, M.-H. 2003, A&A, 412, 651
- Cayrel et al. (2004) Cayrel, R., et al. 2004, A&A, 416, 1117
- Costamante & Ghisellini (2002) Costamante, L. & Ghisellini, G. 2002, A&A, 384, 56
- Davé et al. (2001) Davé, R., et al. 2001, ApJ, 552, 473
- Danforth & Shull (2005) Danforth, C. W., & Shull, J. M. 2005, ApJ, 624, 555
- Danforth et al. (2006) Danforth, C. W., Shull, J. M., Rosenberg, J. L., & Stocke, J. T. 2006, ApJ, 640, 205 (Paper 2)
- Danforth & Shull (2008) Danforth, C. W., & Shull, J. M. 2008, ApJ, 679, 194 (DS08)
- Danforth (2009) Danforth, C. W. 2009, in AIP Conf. Proc., Future Direction s in Ultraviolet Spectroscopy, 1135, eds. G. Sonneborn, M. E. van Steenberg, H. W. Moos, & W. P. Blair, 8
- Danforth, Stocke & Shull (2010) Danforth, C. W., Stocke, J. T., & Shull, J. M. 2010, ApJ, 710, 613
- Falomo & Treves (1990) Falomo, R. & Treves, A. 1990, PASP, 102, 1120
- Fang et al. (2002) Fang, T., Marshall, H. L., Lee, J. C., Davis, D. S., & Canizares, C. R. 2002, ApJ, 572, L127
- Fang, Canizares, & Yao (2007) Fang, T., Canizares, C. R., & Yao, Y. 2007, ApJ, 670, 992
- Fox, Savage, & Wakker (2006) Fox, A., Savage, B. D., & Wakker, B. P. 2006, ApJS, 165, 229
- Ghisellini, Maraschi, & Treves (1985) Ghisellini, G., Maraschi, L., & Treves, A. 1985, A&A, 146, 204
- Green et al. (2010) Green, J., et al. 2010, ApJ, in prep.
- Hutchings & Neff (1992) Hutchings, J. B., & Neff, S. G. 1992, AJ, 104, 1
- Lehner et al. (2007) Lehner, N., Savage, B. D., Richter, P., Sembach, K. R., Tripp, T. M., & Wakker, B. P. 2007, ApJ, 658, 680
- Mazin & Goebel (2007) Mazin, D. & Goebel, F. 2007, ApJ, 655, L13
- McWilliam (1997) McWilliam, A. 1997, ARA&A, 35, 503
- Meisner & Romani (2010) Meisner, A. M., & Romani, R. W. 2010, ApJ, submitted (ArXiv:1002.1343)
- Miller & Green (1983) Miller, H. R., & Green, R. F. 1983, BAAS, 15, 957
- Moos et al. (2000) Moos, H. W., et al. 2000, ApJ, 538, L1
- O’Dowd & Urry (2005) O’Dowd, M., & Urry, C. M. 2005, ApJ, 627, 97
- Osterman et al. (2010) Osterman, S., et al. 2010, ApJ, in prep
- Penton, Stocke, & Shull (2004) Penton, S. V., Stocke, J. T., & Shull, J. M. 2004, ApJS, 152, 29
- Persic & De Angelis (2008) Persic, M. & De Angelis, A. 2008, A&A, 483, 1
- Richter et al. (2004) Richter, P., Savage, B. D., Tripp, T. M., & Sembach, K. R. 2004, ApJS, 153, 165
- Sahnow et al. (2000) Sahnow, D. J., et al. 2000, ApJ, 538, L7
- Savage et al. (2010) Savage, B. D., et al. 2010, in prep.
- Sbarufatti, Treves, & Falomo (2005) Sbarufatti, B., Treves, A., Falomo, R. 2005, ApJ, 635, 173
- Sbarufatti et al. (2006) Sbarufatti, B., Treves, A., Falomo, R., Heidt, J., Kotilainen, J. & Scarpa, R. 2006, AJ, 132, 1
- Scarpa et al. (2000) Scarpa, R., Urry, C. M., Falomo, R., Pesce, J.E., & Treves, A. 2000, ApJ, 532, 740
- Shull et al. (2009) Shull, J. M., Jones, J. R., Danforth, C. W., & Collins, J. A. 2009, ApJ, 699, 754
- Treves, Falomo, & Uslenghi (2007) Treves, A., Falomo, R., & Uslenghi, M. 2007, A&A, 473, L17
- Urry et al. (2000) Urry, C. M., Scarpa, R., O’Dowd, M., Falomo, R., Pesce, J. E. & Treves, A. 2000, ApJ, 532, 816
- Woosley & Weaver (1995) Woosley, S. E., & Weaver, T. A. 1995, ApJS, 101, 181
- Wurtz, Stocke & Yee (1996) Wurtz, R., Stocke, J. T., Yee, H. K. C. 1996, ApJS, 103, 109
- Yao et al. (2009) Yao, Y., Tripp, T. M., Wang, Q. D., Danforth, C. W., Canizares, C. R., Shull, J. M., Marshall, H. L., & Song, L. 2009, ApJ, 697, 1784
- Yao et al. (2010) Yao, Y., et al. 2010, in prep.
- Younger & Hopkins (2010) Younger, J. D., & Hopkins P. F. 2010, MNRAS, submitted (arXiv:1003.4733)
| Line | (mÅ) | notes | |||
|---|---|---|---|---|---|
| 0.00717 | Ly | blend with O VI | |||
| 0.02386 | Ly | ||||
| 0.03254 | Ly | weak | |||
| 0.04012 | Ly | ||||
| LyaaMeasurement based on FUSE data. | ambiguous ID | ||||
| H I COG solutionbbCurve of growth solution based on multiple Lyman lines. | |||||
| 0.04281 | Ly | broad | |||
| 0.04498 | Ly | asymmetric | |||
| LyaaMeasurement based on FUSE data. | |||||
| H I COG solutionbbCurve of growth solution based on multiple Lyman lines. | |||||
| 0.05094 | Ly | ||||
| 0.07832 | Ly | weak | |||
| 0.09481 | Ly | ||||
| LyaaMeasurement based on FUSE data. | weak, ambiguous ID | ||||
| H I COG solutionbbCurve of growth solution based on multiple Lyman lines. | |||||
| 0.10230 | Ly | BLA? | |||
| LyaaMeasurement based on FUSE data. | |||||
| H I COG solutionbbCurve of growth solution based on multiple Lyman lines. | |||||
| 0.12040 | Ly | weak | |||
| 0.12325 | Ly | weak, broad | |||
| Si III 1206 | tentative | ||||
| 0.13334 | Ly | ||||
| 0.13483 | Ly | ||||
| 0.14028 | Ly | weak | |||
| 0.15164 | Ly | ||||
| 0.15234 | Ly | ||||
| 0.15380 | O VI 1038 | tentative, see §3, Fig. 3 | |||
| 0.16540 | Ly | weak | |||
| 0.18640 | Ly | ||||
| Ly | weak | ||||
| poorly-constrained H I COGbbCurve of growth solution based on multiple Lyman lines. | |||||
| O VI 1038 | low significance | ||||
| C III 977 | noisy | ||||
| 0.18773 | Ly | double | |||
| Ly | marginal | ||||
| poorly-constrained H I COGbbCurve of growth solution based on multiple Lyman lines. | |||||
| O VI 1032 | complicated structure | ||||
| O VI 1038 | |||||
| N V 1238 | two components | ||||
| N V 1242 | single component | ||||
| C III 977 | two components | ||||
| Si II 1260 | two components, tentative | ||||
| 0.18958 | Ly | ||||
| 0.18989 | Ly | ||||
| Ly | weak | ||||
| O VI 1032 | |||||
| O VI 1038 | |||||
| 0.19503 | Ly | ||||
| 0.20621 | Ly | weak | |||
| 0.20747 | Ly | weak | |||
| 0.21640 | Ly | ||||
| 0.23559 | Ly | weak | |||
| 0.24155 | Ly | strong, multi-component? | |||
| Ly | weak | ||||
| 0.25439 | Ly | ||||
| 0.26560 | Ly | weak | |||
| 0.27753 | Ly | ||||
| 0.28944 | Ly | ||||
| 0.29830 | Ly | ||||
| 0.30328 | Ly | weak, noisy | |||
| 0.32235 | Ly | ||||
| Ly | |||||
| H I COG solutionbbCurve of growth solution based on multiple Lyman lines. | |||||
| 0.35390 | Ly | tentative, see §3, Fig. 4 | |||
| 0.35650 | Ly | ||||
| Ly | |||||
| poorly-constrained H I COGbbCurve of growth solution based on multiple Lyman lines. | |||||
| 0.37884 | Ly | ||||
| Ly | |||||
| poorly-constrained H I COGbbCurve of growth solution based on multiple Lyman lines. | |||||
| 0.39505 | Ly | multiple components | |||
| Ly | broad, multi-component | ||||
| O VI 1032 | |||||
| O VI 1038 | |||||
| 0.40630 | Ly | weak | |||
| 0.43261 | Ly | noisy |