11email: Steve.Eales@astro.cf.ac.uk 22institutetext: Astronomy Centre, Dept. of Physics & Astronomy, University of Sussex, Brighton BN1 9QH, UK 33institutetext: Herschel Science Centre, European Space Astronomy Centre, Villanueva de la Cañada, 28691 Madrid, Spain 44institutetext: Dept. of Physics & Astronomy, University of California, Irvine, CA 92697, USA 55institutetext: Institute for Astronomy, University of Edinburgh, Royal Observatory, Blackford Hill, Edinburgh EH9 3HJ, UK 66institutetext: Laboratoire AIM-Paris-Saclay, CEA/DSM/Irfu - CNRS - Université Paris Diderot, CE-Saclay, pt courrier 131, F-91191 Gif-sur-Yvette, France 77institutetext: Astrophysics Group, Imperial College London, Blackett Laboratory, Prince Consort Road, London SW7 2AZ, UK 88institutetext: California Institute of Technology, 1200 E. California Blvd., Pasadena, CA 91125, USA 99institutetext: Jet Propulsion Laboratory, 4800 Oak Grove Drive, Pasadena, CA 91109, USA 1010institutetext: Laboratoire d’Astrophysique de Marseille, OAMP, Université Aix-marseille, CNRS, 38 rue Frédéric Joliot-Curie, 13388 Marseille cedex 13, France 1111institutetext: Space Science Building, Cornell University, Ithaca, NY, 14853-6801, USA 1212institutetext: Instituto de Astrofísica de Canarias (IAC), E-38200 La Laguna, Tenerife, Spain 1313institutetext: Departamento de Astrofísica, Universidad de La Laguna (ULL), E-38205 La Laguna, Tenerife, Spain 1414institutetext: Dept. of Astrophysical and Planetary Sciences, CASA 389-UCB, University of Colorado, Boulder, CO 80309, USA 1515institutetext: Observational Cosmology Lab, Code 665, NASA Goddard Space Flight Center, Greenbelt, MD 20771, USA 1616institutetext: Dipartimento di Astronomia, Università di Padova, vicolo Osservatorio, 3, 35122 Padova, Italy 1717institutetext: Institute of Astronomy, University of Cambridge, Madingley Road, Cambridge CB3 0HA, UK 1818institutetext: Department of Physics & Astronomy, University of British Columbia, 6224 Agricultural Road, Vancouver, BC V6T 1Z1, Canada 1919institutetext: 511 H street, SW, Washington, DC 20024-2725, USA 2020institutetext: ESO, Karl-Schwarzschild-Str. 2, 85748 Garching bei München, Germany 2121institutetext: Harvard-Smithsonian Center for Astrophysics, MS65, 60 Garden Street, Cambridge, MA02138, USA 2222institutetext: UK Astronomy Technology Centre, Royal Observatory, Blackford Hill, Edinburgh EH9 3HJ, UK 2323institutetext: Institut d’Astrophysique Spatiale (IAS), bâtiment 121, Université Paris-Sud 11 and CNRS (UMR 8617), 91405 Orsay, France 2424institutetext: National Radio Astronomy Observatory, P.O. Box O, Socorro NM 87801, USA 2525institutetext: Infrared Processing and Analysis Center, MS 100-22, California Institute of Technology, JPL, Pasadena, CA 91125, USA 2626institutetext: School of Physics and Astronomy, The University of Manchester, Alan Turing Building, Oxford Road, Manchester M13 9PL, UK and Institute for Astronomy, University of Hawaii, Honolulu, HI 96822, USA 2727institutetext: Canada-France-Hawaii Telescope, Kamuela, HI, 96743, USA 2828institutetext: Institut d’Astrophysique de Paris, UMR 7095, CNRS, UPMC Univ. Paris 06, 98bis boulevard Arago, F-75014 Paris, France 2929institutetext: Mullard Space Science Laboratory, University College London, Holmbury St. Mary, Dorking, Surrey RH5 6NT, UK 3030institutetext: Space Science & Technology Department, Rutherford Appleton Laboratory, Chilton, Didcot, Oxfordshire OX11 0QX, UK 3131institutetext: Institute for Space Imaging Science, University of Lethbridge, Lethbridge, Alberta, T1K 3M4, Canada 3232institutetext: Astrophysics, Oxford University, Keble Road, Oxford OX1 3RH, UK 3333institutetext: Centre for Astrophysics Research, University of Hertfordshire, College Lane, Hatfield, Hertfordshire AL10 9AB, UK
First results from HerMES on the evolution of the submillimetre luminosity function††thanks: Herschel is an ESA space observatory with science instruments provided by European-led Principal Investigator consortia and with important participation from NASA.
We have carried out two extremely deep surveys with SPIRE, one of the two cameras on Herschel, at 250 m, close to the peak of the far-infrared background. We have used the results to investigate the evolution of the rest-frame 250-m luminosity function out to . We find evidence for strong evolution out to but evidence for at most weak evolution beyond this redshift. Our results suggest that a significant part of the stars and metals in the universe today were formed at in spiral galaxies.
Key Words.:
Galaxies: evoluton – Galaxies: formation – Galaxies: high-redshift – Submillimetre: galaxies1 Introduction
The discovery that approximately half the energy ever radiated by galaxies is received on Earth in the far-infrared waveband (Puget et al. 1996; Fixsen et al. 1998) implies that galaxies must show strong evolution that is hidden from optical telescopes (Gispert, Lagache & Puget 2000). A decade ago, deep surveys with the SCUBA camera on the James Clerk Maxwell Telescope resolved much of the far-infrared background (FIRB) at 850 m into individual sources (Barger et al. 1998; Hughes et al. 1998). These sources are mostly extremely luminous dust-enshrouded galaxies at (Chapman et al. 2005) with an average implied star-formation rate (if the ultimate source of the energy is star formation) of 400 (Coppin et al. 2006), much greater than the star-formation rates in galaxies like our own.
However, the energy density in the FIRB at 850 m is 30 times less than at 200 m where the FIRB is at a maximum, and both the spectral shape of the FIRB and statistical ‘stacking’ analyses (Dole et al. 2006; Pascale et al. 2009) imply that much of the FIRB is actually produced by sources at lower redshift (Gispert et al. 2000; Dole et al. 2006; Pascale et al. 2009). The launch of the Herschel Space Observatory (Pilbratt et al. 2010) in May 2009 has given us the opportunity to resolve a significant fraction of the FIRB at wavelengths where its energy density is at a maximum. In this letter, using the first data from the Herschel Multi-tiered Extragalactic Survey (HerMES; Oliver et al., in prep), we investigate the evolution implied by the existence of the FIRB by measuring the evolution of the galaxy luminosity function at 250 m. We everywhere assume a standard concordance cosmology: .
2 The data
The images that we analyse in this letter were taken at 250 m with the SPIRE instrument on Herschel, whose in-orbit performance and scientific capabilities are described in Griffin et al. (2010). The calibration methods and accuracy of SPIRE are described by Swinyward et al. (2010). The three images consist of a shallow image of the Lockman Hole (LH) and deep images of the northern field of the Great Observatories Origins Deep Survey (GOODS-North) and of a field within the Lockman Hole (LH-North). For the latter two images the dominant source of noise is confusion due to numerous faint sources, which is 5.8 mJy beam-1 at 250 m (Nguyen et al. 2010).

| Field | GOODS-North | LH-North | LH |
|---|---|---|---|
| Area (deg2) | 0.031 | 0.371 | 5.17 |
| Flux limit (mJy) | 10 | 20 | 48 |
| No. sources | 83 | 276 | 551 |
| Spectroscopic z | 65 | 75 | 140 |
| Photometric z | 18 | 161 | 322 |
| No z (%) | 0 | 14 | 16 |
To measure robust fluxes for sources close to the confusion level, we have developed a source-extraction technique that is based on the assumption that sources detected at 250 m with SPIRE will also be detected in deep observations with Spitzer at 24 m. This assumption was suggested by the recent studies that concluded that galaxies detected in deep 24-m surveys with Spitzer produce most of the FIRB at 160 m (Dole et al. 2006) and at 250, 350 and 500 m (Marsden et al. 2009). This approach reduces the effective confusion noise by resolving some of the confusing background into the sources detected at 24 m. Our ‘cross-ID method’ starts from a list of the 24-m sources found in the field covered by the 250-m image. By using a matrix inversion technique, we then find the 250-m fluxes at these positions that provide the best fit to the 250-m image (Roseboom, in prep). A problem with methods like this is that there can be a large number of degenerate solutions when the surface-density of sources in the input catalogue is large, as it is with the deep Spitzer 24-m catalogues. We have addressed this problem by iteratively reducing the number of sources in the input catalogue in order to find the list of input sources that provides the best fit to the 250-m image. Full details of the method, its validation with simulations, and a comparison of the results with other methods of source extraction are given in Roseboom et al. (in prep).
Roseboom et al. (in prep) have assessed the completeness of the cross-ID method by inserting artificial sources onto the real images and then determining the fraction of these sources that are detected by the source-extraction method. Fig. 1 shows the results for the three fields as a function of flux density. Using these curves to choose the flux limits, we have used the cross-ID method to extract samples of sources from regions within each field for which the optical/IR data is particularly good (Table 1). We accepted a lower completeness level at the flux limit for GOODS-North (50%) in order to get the maximum range of luminosity at each redshift. When calculating the luminosity function (§3), we used the curves in Fig. 1 to correct for incompleteness. All the sources above these flux limits are detected at .
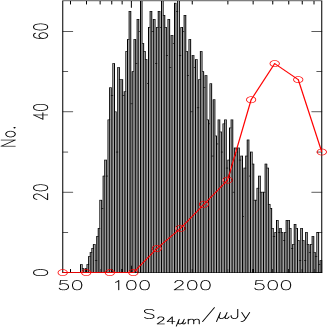
Fig. 1 does not account for any objects that are missing because their 24-m flux density falls below the limit of the Spitzer catalogue used in the cross-ID method. There are two arguments that suggest this is not a serious problem. First, Roseboom et al. show that the number-density of 250-m sources in the cross-ID catalogues agree well with the source counts determined by Oliver et al. (2010) down to 25 mJy in LH-North and 40 mJy in LH. Second, they compare the results of using a shallow and a deep Spitzer catalogue in several fields and conclude that using the deeper catalogue does not produce a large increase in the number of 250-m sources found by the cross-ID method. Fig. 2 illustrates this clearly for the LH-North field. The figure shows a histogram of the 24-m flux densities of the sources in the input Spitzer catalogue, whereas the red line shows the 24-m flux densities of the objects found by the cross-ID method. It is important to note that the 24-m flux densities of the sources in the input catalogue are not used as information in the cross-ID method, so the very different distributions for the input catalogue and for the objects found by the cross-ID method is evidence that the method is working well. The small number of objects with faint 24-m flux densities found by the cross-ID method, despite the very large number of faint 24-m sources in the input catalogue, strongly suggests that we are not missing objects that have too low 24-m flux densities to be included in the Spitzer catalogues.

We have used the optical and near-infrared images for these fields to find the counterparts to the 24-m sources. Table 1 shows we have redshifts for all of the GOODS-North sources, either a spectroscopic redshift from the catalogue of Barger et al. (2008) or, for 22% of the sources, a photometric redshift, which we have estimated from the available multi-wavelength images (in typically nine optical and near-infrared bands – Raymond et al., in prep). The situation for our other deep field is a little less satisfactory, although we still have redshifts for 86% of the sources, a mixture of spectroscopic redshifts and photometric redshifts, mostly taken from an unpublished catalogue of Owen and collaborators, which was produced from images in eight optical and near-infrared bands. The data for LH is described in Rowan-Robinson et al. (2008) and Vaccari et al. (in prep). Fig. 3 shows the redshift distributions for our two deep samples. The differences between the two can probably be explained by cosmic variance as the result of the small area of the GOODS-North sample. The similarity of the distributions at high redshift suggests that the sources without redshifts in LH-North are not preferentially at high redshift.
3 Estimates of the luminosity function
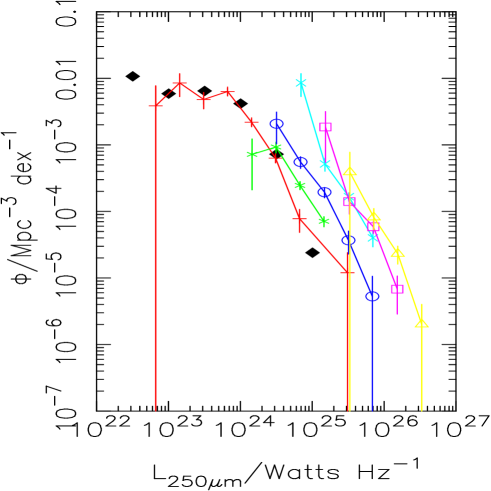
We have estimated the rest-frame 250-m luminosity function in six redshift intervals: , , , , , . Because the optical/IR data is less sensitive for this field than the other two, we have only used the LH sample for the two low-redshift intervals. We have not estimated the luminosity function at because of the low number of sources above this redshift.
At this early stage of the HerMES project, we do not have large numbers of measurements of the spectral energy distributions (SED) of individual galaxies. We have therefore made the assumption that all galaxies have the same SED, which we have taken to be a grey body with a dust-emissivity index of 1.5 and a temperature of 26 K, the average of the SEDs found for the galaxies detected at the same wavelength by the Balloon-borne Large-Aperture Sub-millimeter Telescope (BLAST; Dye et al. 2009). If the typical temperature of the dust in a SPIRE galaxy does change systematically with redshift, this will have little effect on the shape of a galaxy SED at and thus on the luminosity functions at but it might have a significant effect on the luminosity functions at higher redshift.
We have estimated the luminosity function using the estimator of Page and Carrera (2000), which is not only the ideal estimator in general but is particularly well-suited to situations where source confusion is an issue (Eales et al. 2009). For each source, we used the curves in Fig. 1 to estimate a correction factor, , which is the reciprocal of the completeness at the flux density of the source. Our estimate of the value of the luminosity function in a bin of the luminosity-redshift plane is then , where the sum is over the galaxies in this bin and is the accessible volume in this bin averaged over the width of the bin in luminosity. We have combined the data for the different HerMES fields by adopting the ‘coherent volume’ approach of Avni and Bahcall (1980). Our estimate of the luminosity function in a bin is then , where the sum in the numerator is now over all galaxies in the three fields in that bin and the sum in the denominator is the sum of the accessible volumes for the three fields. The fractional error on the luminosity function is then , in which is the uncorrected number of galaxies in that bin in the three fields. This error does not include the effect of cosmic variance, which we will consider in a later paper.
Fig. 4 shows our estimates of the luminosity function in the six redshift intervals and the HerMES estimate of the local luminosity function (Vaccari et al. 2010), which was estimated over two fields covering 14.7 deg2 (including our LH area) and agrees reassuringly with our estimate in the lowest redshift slice. The luminosity function shows steady evolution out to , in the sense that the space-density of the most luminous sources gradually increases with redshift. This agrees well with the evolution in the luminosity function determined from the BLAST results (Eales et al. 2009). There is evidence in Fig. 4 for at most weak evolution at .
There are a number of possible systematic errors that could affect our results. One of the nice properties of the cross-ID method is that simulations suggest it is relatively immune to the effect of flux boosting due to source confusion and Eddington bias (Roseboom et al., in prep). A second possible problem is that we do not have redshifts for all the sources in LH and LH-North. If the incomplete redshift information affects each redshift bin equally, the luminosity functions will all be slightly too low. However, if the incompleteness preferentially affects the high-redshift bins, we will have under-estimated the size of the evolution. Another potential problem is the large number of photometric redshifts in our analysis. We have used a Monte-Carlo simulation to generate artificial samples based on a no-evolution assumption, giving each source a photometric redshift with an accuracy equal to our least accurate redshifts, and then used the artificial samples to estimate the luminosity function in the six redshift slices. This analysis confirms that the large number of photometric redshifts does not generate spurious strong evolution. Finally, even if the dust in galaxies does not get systematically hotter with redshift, there will be a selection effect in our results, since at high redshift we are sampling a lower rest-frame wavelength, and the galaxies found in samples selected at shorter wavelengths tend to contain hotter dust. The effect of this selection effect is that we may have overestimated slightly the luminosity functions at .
4 Discussion
On the assumption that the star-formation rate is proportional to the rest-frame 250-m luminosity, the lack of evidence for any strong evolution at is consistent with investigations that have concluded that the overall star-formation rate per unit comoving volume was approximately constant at (Steidel et al. 1999; Gispert et al. 2000; Hopkins 2004). We estimate from the GOODS-North catalogue that we have resolved 20% of the FIRB at 250 m. Fig. 3 shows that the sources making up this top 20% of the FIRB are at moderate redshift (). Although we cannot say anything directly about the sources responsible for the missing 80% of the FIRB, the stacking analysis of Pascale et al. (2009) from BLAST data suggests that the remainder of the FIRB at this wavelength is also from sources at moderate redshift.
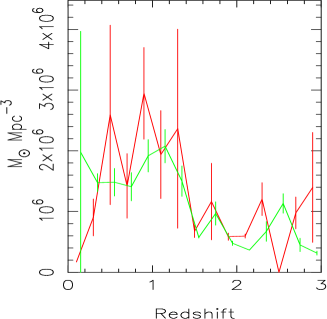
A revealing way to look at these early HerMES results is to use the relationship between the production of metals and the background radiation associated with this metal production (Peacock 1993). Using a value for the integrated FIRB of (Fixsen et al. 1998), we obtain a relationship between the mass of metals and the fraction, , of the FIRB produced in a particular redshift interval:
Fig. 5 shows the metals produced as a function of redshift on the assumption that the redshift distributions of GOODS-North and LH-North are representative of the FIRB as a whole. The figure suggests that most of the metals (and therefore most of the massive stars) formed at a moderate redshift (). This conclusion is consistent with the overall star-formation rate in the universe being constant at , and the apparent decline of metal production at high redshift is simply the consequence of the relationship between cosmic time and redshift. However, the decline in the figure at high redshifts is relatively small, and since we are making the large assumptions that the redshift distributions of our samples are characteristic of the FIRB as a whole, it is possible that observations that resolve more of the FIRB and at several wavelengths rather than a single wavelength will modify this conclusion.
The excellent images that exist from the Hubble Space Telescope for the GOODS-North Herschel sources mean that we can examine the nature of the galaxies responsible for this metal production. We have used the z-band images, since at this band corresponds in the rest-frame to the B-band. Of the 26 galaxies in the redshift interval , 12 show clear signs of spiral structure, and there may well be more if some of the galaxies have spiral arms that are below the surface-brightness detection threshold of the images. Thus the galaxies found in the first HerMES images appear to be quite different from the major mergers found in the SCUBA surveys (Ivison et al. 2000; Tacconi et al. 2008). Studies of galaxy evolution based on Spitzer 24-m surveys have also found that the Spitzer galaxies at are often spirals rather than major mergers (Elbaz et al. 2007) but the crucial advance that Herschel has made possible is that we can determine the cosmological importance of these objects, in terms of the total masses of stars and metals formed in them.
Acknowledgements.
SPIRE has been developed by a consortium of institutes led by Cardiff Univ. (UK) and including Univ. Lethbridge (Canada); NAOC (China); CEA, LAM (France); IFSI, Univ. Padua (Italy); IAC (Spain); Stockholm Observatory (Sweden); Imperial College London, RAL, UCL-MSSL, UKATC, Univ. Sussex (UK); Caltech, JPL, NHSC, Univ. Colorado (USA). This development has been supported by national funding agencies: CSA (Canada); NAOC (China); CEA, CNES, CNRS (France); ASI (Italy); MCINN (Spain); Stockholm Observatory (Sweden); STFC (UK); and NASA (USA).References
- (1) Avni, Y. & Bahcall, J.N. 1980, ApJ, 235, 694
- (2) Barger, A. et al. 1998, Nature, 394, 248
- (3) Barger, A., Cowie, L.L. & Wang, W.-H. 2008, ApJ, 689, 687
- (4) Chapman, S., Blain, A.W., Smail, I. & Ivison, R.J. 2005, ApJ, 622, 772
- (5) Coppin, K. et al. 2008, MNRAS, 384, 1597
- (6) Dole, H. et al. 2006, A&A, 451, 417
- (7) Dye, S. et al. 2009, ApJ, 703, 285
- (8) Eales, S.A. et al. 2009, ApJ, 707, 1779
- (9) Elbaz, D. et al. 2007, A&A, 408, 33
- (10) Fixsen, D.J., Dwek, E., Mather, J.C., Bennett, C.L. & Shafer, R.A., ApJ, 508, 123
- (11) Gispert, R., Lagache, G. & Puget, J.L. 2000, A&A, 360, 1
- (12) Griffin, G. et al. 2010, A&A, this volume
- (13) Hughes, D.H. et al. 1998, Nature, 394, 24
- (14) Huynh, M.T., Frayer, D.T., Mobasher, B., Dickinson, M., Chary, R.R. & Morrison, G. 2007, ApJ, 667, L9
- (15) Ivison, R.J. et al. 2000, MNRAS, 315, 209
- (16) Marsden, G. et al. 2009, ApJ, 707, 1729
- (17) Nguyen, H. et al. 2010, A &A, this volume
- (18) Hopkins, A.M. 2004, ApJ, 615, 209
- (19) Oliver, S. et al. 2010, A&A, this volume.
- (20) Pascale, E. et al. 2009, ApJ, 707, 1740
- (21) Pilbratt, G. et al. 2010, A&A, this volume
- (22) Puget, J.-L., Abergel, A., Bernard, J.-P., Boulanger, F., Burton, W.B., Desert, F.-X. & Hartmann, D. 1996, A&A, 308, L5
- (23) Page, M. and Carrera, F.J. 2000, MNRAS, 311, 433
- (24) Rowan-Robinson, M. 2008, MN, 386, 697
- (25) Steidel, C.C., Adelberger, K.L., Giavalisco, M., Dickinson, M. & Pettini, M. 1999, ApJ, 519, 1
- (26) Swinyard, B. et al. 2010, A&A, this volume
- (27) Tacconi, L. et al. 2008, ApJ, 680, 246
- (28) Vaccari, M. et al. 2010, A&A, this volume