Dipole strength in 144Sm studied via (,n), (,p) and () reactions
Abstract
Photoactivation measurements on 144Sm have been performed with bremsstrahlung endpoint energies from 10.0 to 15.5 MeV at the bremsstrahlung facility of the superconducting electron accelerator ELBE of Forschungszentrum Dresden-Rossendorf. The measured activation yield for the 144Sm(,n) reaction is compared with the calculated yield using cross sections from previous photoneutron experiments. The activation yields measured for all disintegration channels 144Sm(), () and () are compared to the yield calculated by using Hauser-Feshbach statistical models. A new parametrization of the photon strength function is presented and the yield simulated by using the modified photon strength parameters are compared to the experimental data.
pacs:
25.20.-x, 25.20.Dc, 26.30.-kI Introduction
The nuclei heavier than iron are synthesized mainly by neutron-capture reactions- the astrophysical r- and s-processes. There are about 35 neutron deficient stable isotopes between Se and Hg that are shielded from the rapid neutron capture by stable isobars. These nuclei, classically referred to as the p-nuclei, are produced via chains of photodisintegrations such as () () and () on r- or s-seed nuclei B2FH ; Lambert1992 . The best possible sites that have been proposed for the production of p-nuclei are the O/Ne-rich layers of type II supernova explosions Arnould2003 .
For the calculation of p-process abundances, a comprehensive network involving thousands of reaction rates is necessary. Despite the efforts in recent years, the experimental information on the reaction rates involved in the p-process nuclear flows is very scarce. The p-process reaction rates presently used in the astrophysical network calculations are based on the cross sections obtained from Hauser-Feshbach statistical model calculations.
For the network calculations involving the p-nuclei, the precise knowledge of the photon strength especially in the close-threshold regions is very important. In contrast to the rather detailed knowledge Dietrich1989 of the photon strength in the isovector giant dipole resonance (GDR) region well above the particle separation energies, the corresponding information for the excitation region near threshold is still surprisingly uncertain due to the much smaller cross section. Accurate information on weaker channels with protons or alpha particles in the exit channels is also necessary.
The experimental information available for the p-nucleosynthesis so far is either from the reactions that involve neutrons or charged particles. The work described here presents experimental data for the photodisintegration of one nucleus into four different channels as observed in a wide range of bremsstrahlung endpoint energies, i.e, the 144Sm() to 143Sm and 143mSm, the 144Sm() and 144Sm() reactions. The nuclide 144Sm has been discussed in the frame of the p-process chronometer 146Sm Audo72 ; Andr06 . There were several efforts to determine the 146Sm/144Sm production ratio experimentally which varies due to uncertainties in different inputs entering into the calculation, see Ref. Somo98 . The nuclear-physics-related uncertainties in the p-process model predictions were investigated recently by Rapp et al. Rapp06 . A list of the most critical p-process reaction rates (with their respective inverse reactions), which will influence the final p-abundances, have been given (see Table 2 and Table 3, Ref. Rapp06 ). In general, a systematic investigation of the (,) reactions in the mass region 140 is found to be very important. Therefore, experimental information on the photodisintegration rates in 144Sm helps to reduce the inherent nuclear model uncertainties.
The photoactivation experiments presented here cover a substantial range of excitation. The experimental setup is described in Sec. II and Sec. III explains the method of photoactivation yield determination. The experimental results of the 144Sm(), 144Sm() and 144Sm() reactions are discussed in detail under Sec. IV. The photoactivation experiments are performed such that an absolute yield can be extracted which allows the derivation of an absolute strength. This strength function is used in statistical calculations of Hauser-Feshbach type as an input parameter. This point is worked out in detail in Sec. IV.2 of this paper.
II Experimental Setup
The photodisintegration experiments discussed here were performed at the bremsstrahlung facility of the superconducting electron accelerator ELBE (Electron Linear accelerator of high Brilliance and low Emittance) of Forschungszentrum Dresden-Rossendorf. At ELBE, bremsstrahlung endpoint energies up to 20 MeV and average currents up to 1 mA are available which is appropriate for probing photon-induced reactions. The bremsstrahlung facility has been extensively used for photon scattering as well as photoactivation studies Rusev2006 ; Schwengner2007 ; Schwengner2008 ; Rusev2008 ; Rusev2009 ; Benouaret2009 ; Nair2008 . The experimental setup at ELBE has been described in detail elsewhere Schwengner2005 ; Wagner2005 .
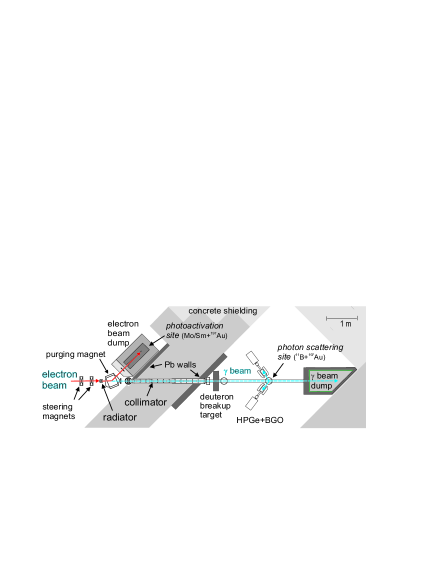
A schematic layout of the photoactivation facility is given in Fig. 1. The primary electron beam is focused onto a thin radiator foil which produces bremsstrahlung via deceleration of electrons. The radiator is made of niobium with areal densities varying between 1.7 mg/cm2 and 10 mg/cm2 corresponding to and radiation lengths. Behind the radiator, the electrons are deflected by a dipole magnet and dumped into a graphite cylinder with a conical recess (see Fig. 1, photoactivation site). The length of the cylinder is 600 mm and diameter is 200 mm. The photoactivation target (Sm) is irradiated here together with the activation standard target 197Au.
The bremsstrahlung beam goes straight ahead through the collimator to the photon scattering site. The photon-scattering site is separated from the photoactivation site by a 1.6 m thick heavy-concrete wall. The collimator made of high-purity aluminum is placed 1 m behind the radiator. The collimator shapes a beam with defined diameter from the spatial distribution of photons. For the energy range of interest, the flux at the photon scattering site is about 108 cm-2 s-1 MeV-1. The endpoint energy of the bremsstrahlung distribution is determined by measuring protons from the photodisintegration of the deuteron (see Fig. 1, deuteron breakup target) with silicon detectors. From the maximum energy of the emitted protons, the maximum energy of the incident photons was deduced. For a detailed description of the beam energy determination procedure, see Sec. III C of Ref. Nair2008 .
At the photon scattering site, a 11B sample is irradiated together with the activation standard target 197Au. The activation standard reaction 197Au() has been compared to photoneutron studies using monochromatic photons from positron annihilation in flight technique (see Nair2008 , and the references therein). The photon flux at this site is experimentally determined by means of the known integrated cross sections of the states in 11B depopulating via rays. The thin target bremsstrahlung and photon flux determination procedure has been discussed in detail in Ref. Nair2008 .
At the photoactivation site, the available photon flux is about 50 to 100 times higher compared to the photon scattering site. At this high-flux area, it is technically not possible to determine the photon flux online. The bremsstrahlung distribution by the graphite is described by MCNP4C2 MCNP simulations which are based on the bremsstrahlung cross sections by Seltzer and Berger Selt86 .
For the activation measurements, the Sm/Au samples used were of natural isotopic composition with masses 200 mg (Au) and 2 g (Sm). The Sm powder was pressed into samples of cylindrical shape and the masses were determined prior to the irradiation. After irradiation, the decay of the daughter nuclei resulting from photoactivation is studied with HPGe detectors of relative efficiency 90% or 60% situated in a lead-shielded low-background environment. Between the sample and the endcap of the detector, a cadmium absorber with a thickness of 1.535 mm is inserted to block the X-ray summing with the -rays. To maximize the absolute efficiency of the detector, the source/target is put on top of the Cd absorber which is situated directly on the HPGe capsule.
In case the resulting radioactive nuclei are short-lived, a rapid transport system (rabbit system) was used for activation experiments. The rabbit system uses compressed air to transport the samples between the photoactivation site and the measuring site Nair2007 . The samples to be irradiated are enclosed in polyethylene cassettes and are shot to the high photon flux area (photoactivation site, Fig. 1). After irradiation, the samples are transported within about 15 s to the detector for decay measurements. For the evaluation of fast decaying samples, a list mode data acquisition system has been used which enabled us to account for the rapidly changing dead time fractions during the course of the measurement.
The measurements demanding low background were performed at the underground laboratory ’Felsenkeller’ Koehl2009 in Dresden where 98% of the cosmic muons are shielded by a 47 m thick rock layer. At Felsenkeller, the -decay was measured with a HPGe detector of 30% relative efficiency.
III Data Analysis
The data analysis method is explained in the following sections. The discussion is divided into two parts:
-
(A)
the method of photoactivation and the photoactivation yield determination; and
-
(B)
the photodisintegration reactions (), () and () in 144Sm.
The decay properties of the radioactive nuclei resulting from photoactivation are given in Table 1.
| reaction | 111separation energy for the proton or neutron emission; Q-value for alpha emission (MeV) | decay | 222half-life of the corresponding decay with absolute uncertainty given in parentheses | 333-energy of the analyzed transitions (keV) | p 444photon emission probability per decay with absolute uncertainty given in parentheses |
|---|---|---|---|---|---|
| 144Sm | 10.5200(24) | 143Sm(EC+143Pm | 8.75(8) min | 1056.58 | 0.019(2) |
| 1173.18 | 0.004161(544) | ||||
| 1514.98 | 0.006593(75) | ||||
| 1403.06 | 0.003496(414) | ||||
| 143Sm IT decay | 66(2) s | 754.4 | 0.8988(6) | ||
| 144Sm | -0.145 | 140Nd(EC)140Pr(no ) | 3.37(2) d | 1596.11 | 0.0050(4) |
| 140Pr140Ce | |||||
| 144Sm | 6.295(3) | 143Pm(EC)143Nd | 265(7) d | 741.98 | 0.385(24) |
III.1 The photoactivation yield
The photoactivation method essentially consists of two steps
-
(i)
irradiation of the target nuclei (144Sm )
-
(ii)
measurement of decay of the daughter nuclei resulting from photoactivation
The irradiation is performed at the photoactivation site shown in Fig. 1. The number of activated nuclei produced is proportional to the integral of the absolute photon fluence (time integrated flux) times the photodisintegration cross section . The integral runs from the reaction threshold energy up to the endpoint energy of the bremsstrahlung spectrum. The symbol = denotes the emitted particle. The number of target atoms in the sample is denoted by .
| (1) |
After irradiation, the -rays following the -decays of the radioactive sample are measured using HPGe detectors. The number of activated nuclei is determined using the relation:
| (2) |
, and denote the dead-time and pile-up corrected full-energy peak intensity of the observed transition, the absolute efficiency of the detector at the energy and the emission probability of the photon with energy respectively.
The factor in Eq. (2) is given by
| (3) |
This expression determines the number of radioactive nuclei from their decays measured during the time . It also takes into account decay losses during irradiation () and in between end of irradiation and beginning of measurement (). denotes the mean life time of the radioactive nucleus formed during photoactivation.
For the ) reaction ( or ), the activation yield is denoted by and is expressed as the ratio of the number of activated nuclei to the number of target atoms in the sample. For example, for the 144Sm reaction,
| (4) |
Using Eq. (1), the activation yield can be calculated from data with the known bremsstrahlung spectrum. In this way measured activation yields can be compared with the experimental or theoretical cross section data.
To compare the activation yield measured at different endpoint energies with the calculated yield using cross sections from theory/previous experiments, the experimental data need to be normalized to the photon fluence at the irradiation site (the photoactivation site, see Fig. 1). As already mentioned, it is not possible to measure the photon fluence at this site directly. The fluence at a fixed energy is given by the ratio of the measured 197Au() activation yield and the calculated activation yield using the known from 197Au and a simulated thick target bremsstrahlung spectrum using the code MCNP. For the experiments discussed in this paper, the normalization has been done to the fluence at = 7.288 MeV which is well below the bremsstrahlung endpoint energies for the photodisintegration experiments under discussion.
For the precise and accurate analysis of the decay spectra, the HPGe detectors were calibrated with a certified set of calibration sources in the energy range from 0.12 to 1.9 MeV. The efficiency curve for the detector with 90% relative efficiency is shown in Fig. 2. For multi-gamma emitting nuclides, coincidence summing corrections have been applied. The fit to the data points is a curve based on a GEANT3 GEANT3 simulation with realistic detector geometry. The detector dimensions have been determined independently by performing a 200 keV X-ray scan. The simulated and measured efficiencies agree within 1.010.02 for the considered energy range. In the estimation of errors, both statistical and systematic uncertainties are taken into account. The systematic uncertainties in the activity as given in the source certificates amount to 0.6-1.5% in the energy range from 0.12 to 1.9 MeV. The statistical uncertainty mainly originates from the peak fit for the calculation of peak areas and the dead-time and pile-up corrections. The statistical uncertainty contribution is in the order of 0.2-0.5%. However, for the photoactivation experiment described here, the targets used were not point-like and the appropriate correction for volume-effects has been applied. This will be described in the next section.

III.2 Photodisintegration of 144Sm
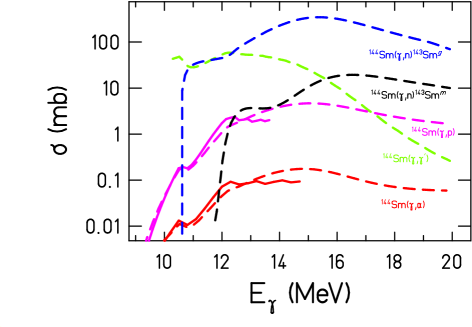
In this experiment, the photodisintegration reactions (), () and () on 144Sm were studied. The cross section predictions for the (), and reactions by the statistical models TALYS Koni05 and NON-SMOKER Raus04 are given in Fig. 3. The 144Sm reaction produces 143Sm or 143mSm. The NON-SMOKER model doesn’t provide the cross section data for the ground and isomeric states in 144Sm separately. Above 11 MeV, the () and () cross sections are orders of magnitude lower than the () cross sections due to the suppressive effect of the Coulomb barrier. The reaction thresholds and decay properties of the respective photodisintegrations in 144Sm are given in Table 1.
For studying the 144Sm reaction, the irradiation was performed for various endpoint energies starting with E0 = 11.00 MeV which is approximately 480 keV above the neutron separation energy. The daughter nucleus produced is 143Sm, partially in its isomeric state 143Smm. The 144Sm()143Smm reaction is identified with the isomeric transition at 754 keV and the 144Sm()143Smg with transitions above 1000 keV (see Table 1). Since both radionuclides are short-lived, the irradiation was carried out using the rabbit system. The activations for this experiment lasted between 15-45 minutes. The sample spectrum of an irradiated Sm target and the half-life measurement using the exponential decay of the ground state of 143Sm have been presented in Fig. 2 of Ref. Nair2007 .
For the activation using the rabbit system, the targets used were not point-like. For the irradiation of samarium, we used fine Sm2O3 powder filled in a cylinder (length 16 mm, diameter 10 mm) of about 2-3 g mass. The 197Au activation standard targets were made of Au-metal foils of about 200-250 mg mass rolled into a cylindrical shape (length 36 mm, diameter 5 mm). Therefore, the full-energy peak efficiencies measured with point sources have to be corrected for source-extension and self-absorption effects. To account for the volume source effect, detailed simulations using GEANT3 were performed. The absolute full-energy peak efficiency of the target is given by
| (5) |
denotes the efficiencies measured with point-like sources at a distance corresponding to the distance of the center of the volume source to the HPGe crystal. The simulated full-energy peak efficiencies for volume and point-like sources are denoted by and respectively. The ratio is the correction to be applied for the volume source effect. For example, for the transition at 754 keV resulting from the 143mSm decay, the correction factor amounts to about 0.970.03. For the transition at 356 keV following the decay of 196Au, the correction factor was about 0.930.02.

The 144Sm and 144Sm activation yields were measured for the first time at astrophysically relevant energies. In the context of this work, these are categorized as manual measurements, indicating that the rabbit system was not necessary for the transport of the rather long-lived isotopes to the counting setup.
For the energy range considered in these experiments, the 144Sm and cross sections are rather very small compared to the cross sections (see Fig. 3). This results in a decay spectrum with weak counting statistics. Therefore, the decay measurements were performed under optimized background conditions in the ’Felsenkeller’ underground laboratory.
In the photoactivation of 144Sm, the and reaction yields cannot be distinguished at high energies above the neutron separation energy ( MeV) since the daughter nucleus decays very quickly to the daughter nucleus. Therefore, to measure the pure reactions, we used bremsstrahlung energies sufficiently below 10.52 MeV.
A sample spectrum of an irradiated samarium target is given in Fig. 4. The Sm2O3 target was placed on top of the 30% HPGe detector. In this measurement, the target was irradiated at a bremsstrahlung endpoint energy of 15.0 MeV and was brought to the underground laboratory on the next day of irradiation. The spectrum shown here was recorded for a period of 1 day. The 144Sm reaction is identified by the transition at 742 keV from 143Pm decay (EC) with a half-life of 265 days, see figure. The 144Sm(,) reaction was identified by the transition at 1596 keV following the decay of 140Pr which is the daughter of the (,) product 140Nd. In the spectrum shown in Fig. 4, the 1596 keV transition is also marked. The other peaks in the spectrum stem from the contaminating reactions in the other samarium isotopes (e.g., 154Sm).
For the manual measurements, we used Sm2O3 powder filled into discs of radius 9 mm and thickness 5 mm. To correct the full-energy peak efficiencies for the volume source effect, we used the Monte-Carlo efficiency transfer code EFFTRAN Vidm05 . The point source efficiency has been measured with the point source shifted to a distance which corresponds to the center of the volume source. The point source efficiency is reduced by 7% when the point source is shifted and put in the middle of the volume target. The volume source effect is only 4%, comparing the point source at the center of the Sm2O3 sample and a volume target Sm2O3 placed on the top of the cadmium absorber. The 197Au activation standard targets were very thin discs (mass100 mg, thickness-0.2 mm, radius-9 mm) and the volume source effect was not significant.
The activation yield relative to the photon fluence are presented in the next sections in detail.
IV Results and Discussion
IV.1 Activation yield for 144Sm reaction: Comparison to previous experiments
The activation yield for the 144Sm() reaction was determined using the method discussed in Sec. III.1. The experimental activation yield for the 144Sm(,n)143Sm reaction () relative to the photon fluence is given in Fig. 5.
The activation yield is compared to the yield calculated using cross sections from previous experiments. The photoneutron cross sections of the Sm isotopes have been measured by Carlos et al. Carl74 using positron annihilation in flight beams at Saclay. In particular, Carlos et al. present a study of the transition from spherical to deformed shape for isotopes in the samarium region. The partial photoneutron cross sections - [(,n)+(,np)] and (,2n) of 144Sm are given in Fig. 2 of Carl74 .


For calculating the activation yield, the cross section data from Carlos et al. were renormalized by us to correct for two effects:
-
1.
The target used by Carlos et al. had a contamination of 11.4% of other Sm-isotopes. We have subtracted the possible contamination using earlier data obtained with natural Sm at the same laboratory Berg69 at the same photon energies. For the energy range 11-16 MeV, the correction factor for the isotopic contamination is 0.8 to 0.9.
-
2.
As shown in a precision experiment by Berman et al. Berm87 , the cross sections measured at Saclay for nuclei with are larger by approximately 20% in all cases except 141Pr for which a comparison was made. For this particular case, an additional correction factor of 0.8 was applied.
The corrected cross sections were then used to calculate the activation yield which compares to our experimental yield as shown in Fig. 5.
In addition, the activation yield for the 144Sm(,n)143mSm reaction has been determined using the method described in Sec. III.1. With known and , the isomeric yield ratio was determined (see Fig. 6).
In an activation experiment by Mazur et al. Mazu95 using bremsstrahlung beams from the M-30 microtron facility at Uzhgorod (Ukraine), the isomeric-state excitations have been investigated for several closed-shell nuclei in the energy range 8-18 MeV. The cross sections were deduced using the Penfold-Leiss method Penf59 , see Fig. 1 of Ref. Mazu95 . Mazur et al. have also measured the isomeric yield ratio Vans81 as a function of energy for the 144Sm(,n)143g,mSm reaction. The experimental isomeric yield ratio from the ELBE is in good agreement with the data from Mazur et al, see Fig. 6. At low energies close to the reaction threshold, the activation yield is influenced by the different experimental conditions (e.g, use of a hardener, thin/thick radiators etc).
IV.2 Model calculations in the Hauser-Feshbach formalism
This section is dedicated to the comparison of experimental results to the predictions of the two advanced model codes TALYS and NON-SMOKER which are based on the Hauser-Feshbach formalism. The NON-SMOKER code uses the neutron optical-model potential by Jeukenne et al. Jeuk77 with a low-energy modification by Lejeune Leje80 . The -ray strength function is taken from Thielemann and Arnould Thie83 . The low-energy modification of the GDR Lorentzian is by McCullagh et al. McCu81 . The nuclear level density implemented in the NON-SMOKER code is based on a global parametrization by Rauscher et al. Raus97 within the back-shifted Fermi-gas formalism.
The TALYS calculations presented in this paper were performed with the current version of the code TALYS-1.0. The default option of this code uses the neutron optical-model potential parameterizations by Koning and Delaroche Koni03 . The E1 photon strength function is from the compilation by Kopecky and Uhl Kope90 . The nuclear level density model is based on an approach using the Fermi-gas model Koni08 .
The measured activation yield () is compared to the simulated yield from Hauser-Feshbach models as shown in Fig. 7. It is observed that the experimental yield roughly agrees to the simulated yield using cross sections predicted by the default inputs to TALYS (agrees within 20%) and NON-SMOKER (agrees within a factor of 2).
The statistical model calculations are sensitive to the basic input ingredients like optical potentials, strength functions and level densities. In the case of (,n) reactions, the influence of the neutron optical potential is weak, whereas the photon strength function is a crucial ingredient of the model calculations. We modified the deformation dependent parameters of the E1 strength function used in TALYS according to a new parametrization explained below (see also Ref. Junghans2008 ).
The strength function is related to the average photoabsorption cross section over a large number of levels with same spin and parity by the equation
| (6) |
and denote the spins of ground and excited states respectively Bartholomew1973 . Eq. 6 can be applied to a wide energy range around the GDR, including the low energy tail of it. In even nuclei, the spin is equal to the multipolarity of the GDR, i.e., = 1.
In nearly all types of heavy nuclei, the GDR can be treated as splitted into two or three components, whose energies are well predicted by the finite range droplet model (FRDM) Myers1977 . Making use of the fact that the vibrational frequency along a given axis is inversely proportional to the corresponding semi-axis length , and the splitting Bush1991 is due to the three different axes of the ellipsoid, the nuclear shape with its quadrupole deformation parameter and triaxiality parameter is parameterized as:
| (7) |
Here, denotes the nuclear radius and is the GDR centroid energy. For a spherical nucleus with mass , is given by fm and is calculated with an effective nucleon mass = 874 MeV/c2.
In the proposed phenomenological ansatz we parameterize the strength function by a sum of three Lorentzians tailing down from the GDR. The centroid energy of the GDR is directly related to parameters of the finite range droplet model with one extra parameter which is equal for all heavy nuclei, the reduced nucleon mass m* Moll95 . As was shown theoretically Dover1972 a description of the photoabsorption cross section by a Lorentzian is appropriate although the total width of a GDR in a heavy nucleus is dominated by spreading and not by escape, i.e. direct decay.
The average absorption cross section in the GDR is given by
| (8) |
Here we assume that the GDR width to be used in the sum of the three Lorentzians depends on the resonance energy only, in contrast to earlier descriptions Kope90 ; Zanini2003 . The photon energy is given in MeV and in fm2.
In this description, the Thomas-Reiche-Kuhn sum rule as determined from general quantum mechanical arguments Eisen88 is included for obtaining the average photoabsorption cross section on an absolute scale. We use results from hydrodynamical considerations Bush1991 by adapting surface dissipation to the Goldhaber-Teller model of the GDR. This results in a power law dependence of the resonance width on the respective resonance energy . In general, for all stable nuclei with ,
| (9) |
For the exponent, the value = 1.6 was derived from the one-body dissipation model Bush1991 and the proportionality parameter stems from a fit to many nuclei including axially as well as triaxially deformed nuclei where the GDR is split into three components with well defined distances from the centroid and relative intensities. We generalize this by using the proposed Bush1991 power law dependence for different nuclei and thus reduce the number of parameters for the description of the GDR’s by relating the spreading width in all nuclei with mass to the respective resonance energy of their GDR. It is stressed here again that the Lorentzian photon strength function is parameterized in each nucleus by a constant spreading width not depending on the photon energy.
The above parametrization has been discussed in detail with examples from experimental studies of 8 nuclides between = 80 and 238 in a recent publication Junghans2008 . The new phenomenological description based on the ground state deformation parameters describes well the electric dipole excitations for nuclei with from 4 MeV up to several MeV above the GDR. In addition, the dipole strength function for the case of 197Au was determined using the proposed parametrization and compared with experimental results from ELBE Nair2008 .
The yield for the 144Sm reaction calculated using the TALYS code with modified E1 photon strength functions derived on the basis of the above discussion is shown in Fig. 7. As in the quasi-spherical 144Sm the three GDR components coincide, the splitting is negligible and the following resonance parameters were used: = 14.84 MeV, = 356.6 mb and = 3.74 MeV. In Fig. 8, the isomeric yield ratio measured at ELBE is compared to the isomeric yield ratio calculated using cross sections predicted by the TALYS code with default and modified inputs. The NON-SMOKER model does not provide the cross sections arising from the decay of the metastable state in 143Sm separately and hence it was not possible to calculate a yield ratio.


IV.3 Activation yield for 144Sm and 144Sm reactions


The activation yields for the 144Sm and 144Sm reactions compared to the simulated yields using cross sections predicted by the TALYS and NON-SMOKER calculations are shown in Fig. 9. The predictions given by the TALYS code with modified inputs to the E1 photon strength function is also shown.
The uncertainties in the experimental yield shown in Fig. 9 are mainly the statistical uncertainties. The systematic uncertainties arise from the photon emission probabilities for the decays stemming from the (6%) and (8%) reactions (see Table 1) and from the full-energy peak efficiency calculations (2%).
V Conclusions
Activation experiments of the kind described - especially when performed with a transport system allowing the study of short half-lives deliver exact photon strength data. Thus they allow a verification of data obtained previously by direct absorption experiments or by detecting the neutrons from the process. In Fig. 10, the photoneutron cross sections of the Sm-isotopes as described by the photon strength parametrization from Junghans et al. Junghans2008 is shown.
From the figure, it is obvious that the parametrization describes all the isotopes well except 144Sm in which the contribution from 144Sm and 144Sm is of significant magnitude at low energies close-around Sn (see Fig. 3). For all cross section data from Carlos et al., a correction factor of 0.8 based on Berman et al. Berm87 experiments was applied. For the 144Sm cross sections, the additional correction factor arising from isotopic contaminations was also necessary (see Sec. IV.1). The yield calculations using cross sections from the NON-SMOKER code with default nuclear physics inputs are also shown. It is clear the calculations incorporating the new parametrization provides a better description to the experimental data than default NON-SMOKER results.
The agreement between the parametrization and experimental data is surprisingly good- taking into account that all parameters (except ) were obtained from global fits to all nuclei with (as long as respective data are available for them). The only non-global parameter, the deformation was directly derived from the electric quadrupole transition strength to the first 2+ state Raman2001 . The approximation for the triaxiality is from the systematics presented by Andre93 . The values of and used for each isotope are shown in the respective figure. The Lorentzian resonance integral corresponds to the TRK sum rule and the resonance energies are calculated using the symmetry energy J=32.7 MeV and surface stiffness Q=29.2 MeV Moll95 .
To summarize, this paper presents the photodisintegration of 144Sm to four exit channels. The 144Sm(,n) reaction yield has been compared to the yield calculated using cross sections from previous photoneutron experiments and a comparison of the two data sets leads to a conclusion on the inaccuracies in previous data. It has been verified that the recommendations based on Berman et al. Berm87 experiments are necessary to correct the cross section measurements at Saclay.
The activation yield for all the photodisintegration reactions has been compared with TALYS and NON-SMOKER models. In general, the experimental activation yields agree within a factor of 2 to the simulated yield using statistical model predictions. In view of the fact, that the codes NON-SMOKER and TALYS are based on the same theory-the Hauser-Feshbach model, eventual differences appearing in the model predictions are strongly related to their nuclear physics inputs. The effect of using different photon strength functions in the TALYS model calculations has been discussed here. For the 144Sm(,)reaction, the statistical model description faces the additional problem of the possible emission of low energy photons prior to the alpha emission. In a forthcoming paper the respective data for 144Sm will be presented together with results for a different mass region, and the proper treatment of that process by the two codes will be examined.
The new proposed phenomenological parametrization describes very well the photoneutron cross section data for Sm isotopes. A similar investigation has been performed for the stable even isotopes of Mo and same effects has been observed Erhard2009 . It is thus worthwhile to point out again that this new fit only needs a very limited number of fit parameters to describe the electric dipole strength in all nuclei with , for which nuclear photoeffect data exist.
VI Acknowledgements
We thank P. Michel and the ELBE team for providing a stable beam during activation experiments. We are indebted to J. Klug for the MCNP simulations of the bremsstrahlung spectra at the photoactivation site. Special thanks are due to M. Köhler and D. Degering, for their help with the measurements at the underground laboratory Felsenkeller, Dresden. The technical assistance of A. Hartmann is gratefully acknowledged.
References
- (1) E. M. Burbidge, G. R. Burbidge, W. A. Fowler et al., Rev. Mod. Phys. 29, 547 (1957).
- (2) D. L. Lambert, Astron. Astrophys. Rev. 3, 201 (1992).
- (3) M. Arnould and S. Goriely, Phys. Rep. 384, 1 (2003).
- (4) S. S. Dietrich and B. L. Berman, At. Data Nucl. Data Tables 38, 199 (1988).
- (5) J. Audouze and D. N. Schramm, Nature 237, 447 (1972).
- (6) R. Andreasen and M. Sharma, Science 314, 806 (2006).
- (7) E. Somorjai, Z. Fülöp, A. Z. Kiss, et al., Astron. Astrophys. 333, 1112 (1998).
- (8) W. Rapp, J. Gorres, M. Wiescher, et al., Astrophys. J. 653, 474 (2006).
- (9) G. Rusev, R. Schwengner, F. Dönau et al., Phys. Rev. C 73, 044308 (2006).
- (10) R. Schwengner, G. Rusev, N. Benouaret et al., Phys. Rev. C 76, 034321 (2007).
- (11) R. Schwengner, G. Rusev, N. Tsoneva et al., Phys. Rev. C 78, 064314 (2008).
- (12) G. Rusev, R. Schwengner, F. Dönau et al., Phys. Rev. C 77, 064321 (2008).
- (13) G. Rusev, R. Schwengner, R. Beyer et al., Phys. Rev. C 79, 061302 (2009).
- (14) N. Benouaret, R. Schwengner, G. Rusev et al., Phys. Rev. C 79, 014303 (2009).
- (15) C. Nair, M. Erhard, A. R. Junghans et al., Phys. Rev. C 78, 055802 (2008).
- (16) R. Schwengner, R. Beyer, F. Dönau et al., Nucl. Instrum. Methods A 555, 211 (2005).
- (17) A. Wagner, R. Beyer, M. Erhard et al., J. Phys. G: Nucl. Part. 31, S1969 (2005).
- (18) MCNP - Monte Carlo N-Particle Transport Code, http://mcnp-green.lanl.gov/; Version 4C2 obtainable from http://www.nea.fr/abs/html/ccc-0701.html.
- (19) S. M. Seltzer and M. J. Berger, At. Data Nucl. Data Tables 35, 345 (1986).
- (20) C. Nair, A. R. Junghans, M. Erhard et al., J. Phys. G: Nucl. Part. 35, 014036 (2008).
- (21) M. Köhler, D.Degering, M.Laubenstein et al., Appl. Rad. Isot. 67, 736 (2009).
- (22) Evaluated Nuclear Structure Data Files (ENDSF). The database service of National Nuclear Data Center (NNDC). http://www.nndc.bnl.gov/ensdf/
- (23) GEANT3: CERN program Library Long Writeup Q121, CERN, Geneva (CH), 1994.
- (24) A.J. Koning, S. Hilaire and M.C. Duijvestijn, Proceedings of the International Conference on Nuclear Data for Science and Technology, April 22-27, 2007, Nice, France, editors O.Bersillon, F.Gunsing, E.Bauge, R.Jacqmin, and S.Leray, EDP Sciences, p. 211-214 (2008); http://www.talys.eu
- (25) T. Rauscher and F. -K. Thielemann, At. Data Nucl. Data Tables 88, 1 (2004).
- (26) T. Vidmar, Nucl. Instrum. Methods A 550, 603 (2005).
- (27) P. Carlos, H. Beil, R. Bergère, et al., Nucl. Phys. A 225, 171 (1974).
- (28) R. Bergère, H. Beil, P. Carlos, et al., Nucl. Phys. A 133, 417 (1969).
- (29) B. L. Berman, R. E. Pywell, S. S. Dietrich et al., Phys. Rev. C 36, 1286 (1987).
- (30) V. M. Mazur, V. A. Zheltonozhskii, and Z. M. Bigan, Phys. of Atomic Nuclei 58, 898 (1995).
- (31) A. S. Penfold and J. E. Leiss, Phys. Rev. 114, 1332 (1959).
- (32) R. Vanska and R. Rieppo, Nucl. Instrum. Methods 179, 525 (1981).
- (33) J. P. Jeukenne, A. Lejeune, and C. Mahaux, Phys. Rev. C 15, 10 (1977). J. P. Jeukenne, A. Lejeune, and C. Mahaux, Phys. Rev. C 16, 80 (1977). J. P. Jeukenne, A. Lejeune, and C. Mahaux, Phys. Rep. 25, 83 (1976).
- (34) A. Lejeune, Phys. Rev. C 21, 1107 (1980).
- (35) F. -K. Thielemann, and M. Arnould, Proc. Int. Conf. Nucl. Data for Science and Technology, edited by K. Böckhoff, D. Reidel Publ. Co, Brussels, 762 (1983).
- (36) C. M. McCullagh, M. L. Stelts, and R. E. Chrien, Phys. Rev. C 23, 1394 (1981).
- (37) T. Rauscher, F.-K. Thielemann, and K. L. Kratz, Phys. Rev. C 56, 1613 (1997).
- (38) A. J. Koning and J. P. Delaroche, Nucl. Phys. A 713, 231 (2003).
- (39) J. Kopecky and M. Uhl, Phys. Rev. C 41, 1941 (1990).
- (40) A. J. Koning, S. Hilaire and S. Goriely, Nucl. Phys. A 810, 13 (2008).
- (41) A. R. Junghans, G. Rusev, R. Schwengner et al., Phys. Lett. B 670, 200 (2008).
- (42) G. A. Bartholomew, E. D. Earle, A. J. Ferguson et al., Adv. Nucl. Phys. 7, 229 (Plenum Press, New York, 1973).
- (43) W. D. Myers, W. J. Swiatecki, T. Kodama et al., Phys. Rev. C 15, 2032 (1977).
- (44) B. Bush and Y. Alhassid, Nucl. Phys. A 531, 27 (1991).
- (45) P. Möller, J. R. Nix, W. D. Myers et al., At. Data Nucl. Data Tables 59 185 (1995).
- (46) C. B. Dover, R. H. Lemmer and F. J. W. Hahne, Ann. Phys. 70 458 (1972).
- (47) L. Zanini, F. Corvi, H. Postma et al., Phys. Rev. C 68, 014320 (2003).
- (48) J. M. Eisenberg and W. Greiner, Nuclear Theory Vol. 2: Excitation mechanisms of the nucleus, Third edition, North Holland Physics Publ., Amsterdam (1988).
- (49) S. Raman, C. W. Nestor, Jr., and P. Tikkanen, At. Data Nucl. Data Tables 78, 1 (2001).
- (50) W. Andrejtscheff and P. Petkov, Phys. Rev. C 48, 2531 (1993).
- (51) M. Erhard, A. R. Junghans, C. Nair et al., Phys. Rev. C 81, 034319 (2010).