Nanoscale Phenomenology from Visualizing Pair Formation Experiment
Abstract
Recently, Gomes et al. Gomes have visualized the gap formation in nanoscale regions (NRs) above the critical temperature in the high- superconductor . It has been found that, as the temperature lowers, the NRs expand in the bulk superconducting state consisted of inhomogeneities. The fact that the size of the inhomogeneity Pan is close to the minimal size of the NR Gomes leads to a conclusion that the superconducting phase is a result of these overlapped NRs. In the present paper we perform the charge and percolation regime analysis of NRs and show that at the first critical doping , when the superconductivity starts on, each NR carries the positive electric charge one in units of electron charge, thus we attribute the NR to a single hole boson, and the percolation lines connecting these bosons emerge. At the second critical doping , when the superconductivity disappears, our analysis demonstrates that the charge of each NR equals two. The origin of can be understood by introducing additional normal phase hole fermions in NRs, whose concentration appearing above increases smoothly with the doping and breaks the percolation lines of bosons at . The last one results in disappearing the bulk bosonic property of the pseudogap (PG) region, which explains the upper bound for existence of vortices in Nernst effect Wang . Since Gomes has demonstrated the absence of NRs at the PG boundary one can conclude that along this boundary, as well as in , all bosons disappear.
pacs:
74.20.De, 74.25.Dw, 74.72.Gh, 74.72.KfI Introduction
The origin of PG and high-temperature superconductivity phases in copper oxides is the most puzzling and challenging problem in condensed matter physics. Despite on the intensive experimental and theoretical studies we have no clear understanding of these phases so far. A relationship between two phases has become a subject of wide range theoretical proposals and their possible experimental testing. A precursor scenario for the PG state supposes pairing correlations without superconducting phase coherence Emery . This scenario has been confirmed by experiments Wang ; Corson . A description for the PG phase based on the electronic competing order mechanism with experimental arguments was given in Tallon . Other observations have associated the PG with a real space electronic organization Vershinin which is dominant at low dopings.
The fundamental property of the PG is a partial gap in the density of states Timusk which is observed in various experiments. To understand the nature of this gap the real space atomic scale scanning tunneling microscopy measurements of the copper oxide have been performed. For the case of high- superconductivity the spatial gap inhomogeneities have been observed in Howald ; McElroy , while Pan et al. Pan explicitly determine their minimal size. The evolution of the nanoscale gap formation with temperature decrease in the PG region has been investigated by Gomes et al. Gomes .
In the present paper we study the origin of minimal size NRs, which were visualized in Refs. Gomes ; Pan through the measurement of the energy gap. We use the experimental fact that PG and superconductivity phases are formed from the NRs. Particularly, we are interested in the electric charge of NRs. We will employ the information about the charge to understand some ingredients of doping-temperature phase diagram of copper oxide. The generalization of our consideration to other cuprates will be given as well. It is worth to notice that all physical findings in the paper are inferred from the analysis of data for the NRs in Gomes ; Pan . The most important fermionic nature of the second hole inside NR at and dopings below is implied from the meaning of the second critical doping : at this doping the superconductivity and hence, the bosonic property of the matter disappears.
The authors of Ref. Gomes have visualized the NRs in the PG region of compound at fixed hole dopings . It has been determined that for and the minimal size of the NRs is nm. The estimated minimal size of NRs, , is about 1.3 nm in the superconducting phase Pan (). Another notable result obtained in Ref. Pan is the observation of spatial localization of the dopped charges. The charges are localized in the same area as NRs Pan with the same coherence length . Below we will demonstrate that the next spatial parameter, the mean distance between two holes, , is important to understand the underlying physics. The experimental doping dependence of can be approximated by the relationship (see Fig. 34 in Ref. Kastner ), where is a lattice constant in the elementary structural plaquette for the plane of a copper oxide. This relationship is derived in Ref. Kastner for compound with . It is valid for our compound as well since the lattice constant of is (see the capture to Fig.2 in Ref. McElroy ). It is worth to mention that for the lattice constant of the same structural plaquette.
A principal part of our analysis is the doping dependence of the NR charge . We start with a case of zero temperature. The parameter contains an essential information in our consideration. The factor reduces to the expression which has a simple physical meaning: it is a total electric charge of number of plaquettes each of them having a charge . On the other hand, the parameter describes the average spatial overlapping degree of two or more holes by one NR. If then all NRs will be in close contact to each other providing by this the bulk superconductivity in percolation regime.
In the Table I we outline the doping dependencies for the function for fixed experimental values (the minimal size of the NR) and taken from Ref. Gomes and Ref. Pan , respectively, and for the function which fits to at and for provides . Numerical values of the are also shown in the table.
Since in Ref. Gomes every NR location in the sample is tracked with the precision , we suppose that the has been measured with a high enough accuracy. In addition, we assume that in Ref. Pan the is measured with the same accuracy at . Under this condition, we conclude that the tendency of to growth from to when decreases from to reflects quantitatively the underlying physics. The data for the resulting parameter is approximated by the function . The analytic equation for expressed in terms of the lattice constant is given by .
As seen from Table I, the charges , , and vary continuously with the doping . This is not surprising because they are functions of and . From the analysis at the first critical doping, , it follows that the charge of the visualized NR in Ref. Gomes equals . So that, it corresponds to the charge of a single hole. Notice, at the critical doping the percolation parameter is given by . That means the whole sample is entirely covered with mini areas contacting each other. It is unexpected that at the second critical doping, , the charge of the visualized NR takes the value . This implies that at one has a pair of holes inside the NR and, as a result, the superconductivity disappears completely. For we have , so that the charge conductivity of the fermions still remains.
Notice, that there are no particles in the nature with the fractional charge, except the quasiparticles which can be produced by many-body correlations like in the fractional quantum Hall effect Laughlin . Hence, the problem of the presence of the extra fractional charge inside the NR has to be solved yet. We remind Gomes ; Pan that PG visualized NRs constitute the bulk superconductivity phase below the critical temperature , and therefore, they are a precursor for that phase. This implies undoubtedly that the NRs represent bosons at least. At one has the charge , so that one may conjecture that the NR represents just a boson localized in the square box .
For the charge has an additional to fractional part. We assign the last one to the fractional part of the charge of fermion. Thus the total charge of the NR includes the charge of the boson and the fractional charge of the fermion. However, as it was mentioned above, the fractional charge can not exist. Therefore, we take the number of NRs to be equaled to the inverse value of the fractional part to form a charge of the fermion. As a result, we obtain one fermion surrounding by bosons. The values of are outlined in the last column of the Table 1.
The NRs introduced in such a manner allow to understand clearly the evolution of the fermions in the whole range of doping and to explain the origin of the second critical doping . It is clear, as increases, the number of fermions grows up inside the superconducting phase. By this, at , when the number of fermions becomes equal to the number of bosons, one has the breaking of the boson percolation lines, and, thus the superconductivity disappears.
It is worthwhile to compare with the lattice constant of compound when the doping varies. We have for variation of from to . However, it is well known that the antiferromagnetic dielectric parent materials are characterized by a strong short range magnetic interaction within the atomic length scale . Therefore, one may assume that is a length parameter for these compounds. The fact that the size is larger than leads to a conclusion that the visualized NRs are independent from the dielectric environment (the latter forms only the spatial square shape of the NR). Due to this, the numerical values and are universal for all hole doped cuprates. However, at the second critical doping the length scale of boson and fermion (the half of ) inside NR is comparable to . Therefore, the parent compound starts to play a role from the critical doping . Furthermore, since a coincidence of with the PG boundary at a zero temperature has been observed in various experiments and for all temperatures of this boundary no NRs, which exhibit gaps, were detected Gomes , the plausible intuitive finding would be the total disappearance of bosons along the PG bound line. So that two fundamental phenomena – the breaking of the boson percolation lines and the disappearance of bosons – occur at . The first phenomenon indicates the end of the bulk bosonic property and the end of the curve as well, whereas the second phenomenon corresponds to the end of the bosonic property in general. For the PG region the disappearance of the bulk bosonic property was detected by observing the onset temperature, , for the existence of vortices in the Nernst effect Wang . The vortices have been seen so far only in quantum Bose systems. Further evolution of fluctuations with temperature increase destroys the bosons which totally vanish at PG boundary.
| 0.28 | 1.939 | 3.277 | 10 | 1.939 | 1.393 | |
| 0.22 | 1.524 | 2.575 | 10 | 1.524 | 1.235 | |
| 0.16 | 1.108 | 1.873 | 11 | 1.341 | 1.158 | |
| 0.14 | 0.969 | 1.638 | 12 | 1.396 | 1.182 | |
| 0.10 | 0.693 | 1.170 | 13 | 1.170 | 1.082 | |
| 0.05 | 0.346 | 0.585 | 17 | 1.000 | 1.000 | |
| 0.04 | 0.277 | 0.468 | 18 | 0.897 | 0.947 | |
| 0.02 | 0.139 | 0.234 | 20 | 0.554 | 0.744 |
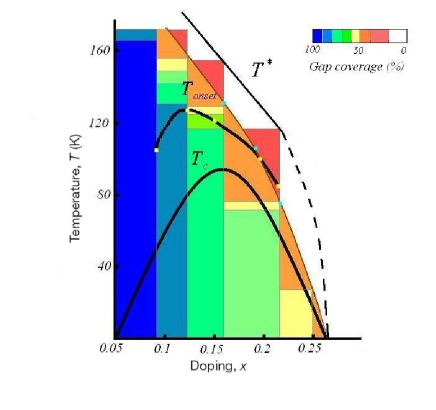
The schematic single hole bosonic phase diagram for is depicted in the Fig. 1. The coloured zones indicate the percentage of the sample that is gapped at given temperature and doping (in analogy with the phase diagram shown in Ref. Gomes ). The solid lines correspond to the following observed temperatures: PG boundary and onset temperature for Nernst effect signals taken from Ref. Wang , and the critical temperature from Ref. Gomes . The extrapolation of the connection of with the second critical doping, , is depicted by the dashed line. The yellow points correspond to fixed values from Ref. Wang , and the blue points represent the temperature data for of gapped area of the sample from Ref. Gomes measured at fixed dopings. The thin brown coloured solid line fits the blue points. The percentage for the gapped doping is calculated by using the equation under the assumption that the NRs overlap each other. It is remarkable that line is substantially located in the brown coloured zones which means there is no bulk bosonic property above these zones. It is worth to compare the homogeneous gap coverage observed in Ref. Gomes with our proposed varying one in Fig. 1 for low temperature and doping levels . Employing the doping changing dynamics of the gap coverage obtained in Ref. Gomes , we find that this percentage is applicable also at the second critical doping, , which is shown in Fig. 1 by yellow () and brown () colours. On the other hand, if we consider the NR charge for the above interval of doping with further its increasing up to , close to , then we will reproduce exactly the percentages observed in the phase diagram in Ref. Gomes .
The next interesting finding is that the number of external interstitial atoms sufficient to produce one doped hole in the dielectric parent material equals to . For compound it is a number of atoms, since the hole doping and the concentration of atoms are expressed by . In the interval this number varies from to .
We discuss on the percolation threshold of classical systems and compare it with our one used for bulk bosonic property. If we remind white and black cells of the chessboard and assume that the black ones represent a region in which the percolation should occur, it becomes clear that the percolation threshold consists of coverage by this colored region of the whole chessboard area. The experiment for some particular system indicates to more than coverage for its value Smith (the numerical simulation for the same system has confirmed this observed result Weinrib ).
Summarizing the paper, we have succeeded in understanding the following constituents of the doping-temperature phase diagram of the hole doped copper oxides: (i) the first and second critical dopings have been a result of emergence and disappearance of the single hole boson percolation lines, respectively; (ii) the disappearance of the percolation lines leads to the end of the PG bulk bosonic property or to the end of Nernst effect signals; (iii) the fact that the PG boundary was a bound, where the single hole bosons disappear, confirmed by Ref. Gomes . Our findings are consistent with the recent observation Gavrilkin of the superconducting phase consisted of the array of nanoclusters embedded in the insulating matrix and of percolative transition to this phase from the normal phase in . Superconducting islands introduced in insulating background have been used for the interpretation of the superconductor-insulator transition in compound Oh . In a recent paper tahir a significant role of the percolation of elementary structural plaquettes on universal properties of cuprates has been established. Using percolation mechanism the authors of Ref. tahir succeeded in explanation of the phase diagram, room-temperature thermopower, neutron spin resonance, and STM incommensurability. At the end, the boson and fermion mixing nature of PG region, derived from experiment Gomes , is consistent with our treatment and description of low temperature non-Fermi liquid heat conductivity and entropy Abdullaev2 .
II Acknowledgements
The work is partially supported by Korean Research Foundation (Grant KRF-2006-005-J02804).
References
- (1) K. K. Gomes et al., Nature 447 (2007) 569.
- (2) S. H. Pan et al., Nature 413 (2001) 282.
- (3) Y. Wang, L. Li, and N. P. Ong, Phys. Rev. B 73 (2006) 024510.
- (4) V. J. Emery and S. A. Kivelson, Nature 374 (1995) 434.
- (5) J. Corson et al., Nature 398 (1999) 221; Z. A. Xu et al., Nature 406 (2000) 486; Y. Wang et al., Phys. Rev. Lett. 95 (2005) 247002.
- (6) J. L. Tallon and J. W. Loram, Physica C 349 (2001) 53.
- (7) M. Vershinin et al., Science 303 (2004) 1995; T. Hanaguri et al., Nature 430 (2004) 1001; K. McElroy et al., Phys. Rev. Lett. 94 (2005) 197005.
- (8) N. Timusk and B. Statt, Rep. Prog. Phys. 62 (1999) 61.
- (9) C. Howald, P. Fournier, and A. Kapitulnik, Phys. Rev. B 64 (2001) 100504(R).
- (10) K. McElroy et al., Science 309 (2005) 1048.
- (11) M. A. Kastner, R. J. Birgeneau, G. Shirane, and Y. Endoh, Rev. Mod. Phys. 70 (1998) 897.
- (12) R. B. Laughlin, in The Quantum Hall Effect, Edited by R. E. Prange and S. M. Girvin, (Springer-Verlag, New York, 1987).
- (13) L. N. Smith and C. J. Lobb, Phys. Rev. B 20 (1979) 3653.
- (14) A. Weinrib, Phys. Rev. B 26 (1982)1352.
- (15) S. Yu. Gavrilkin, O. M. Ivanenko, V. P. Martovitskii, K. V. Mitsen, and A. Yu. Tsvetkov, Arxiv: 0909.0612.
- (16) S. Oh, T. A. Crane, D. J. Van Harlingen, and J. N. Eckstein, Phys. Rev. Lett. 96 (2006) 107003.
- (17) J. Tahir-Kheli and W. A. Goddard, J. Phys. Chem. Lett. 1 (2010) 1290.
- (18) B. Abdullaev, C. -H. Park, and K. -S. Park, cond-mat/0703290.