Wide radio beams from -ray pulsars
Abstract
We investigate the radio and -ray beaming properties of normal and millisecond pulsars by selecting two samples from the known populations. The first, Sample G, contains pulsars which are detectable in blind searches of -ray data from the Fermi Large Area Telescope. The second, Sample R, contains pulsars detectable in blind radio searches which have spin-down luminosities erg s-1. We analyse the fraction of the -ray-selected Sample G which have detectable radio pulses and the fraction of the radio-selected Sample R which have detectable -ray pulses. Twenty of our 35 Sample G pulsars have already observed radio pulses. This rules out low-altitude polar-cap beaming models if, as is currently believed, -ray beams are generated in the outer magnetosphere and are very wide. We further find that, for the highest- pulsars, the radio and -ray beams have comparable beaming factors, i.e., the beams cover similar regions of the sky as the star rotates. For lower- -ray emitting pulsars, the radio beams have about half of the -ray sky coverage. These results suggest that, for high- young and millisecond pulsars, the radio emission originates in wide beams from regions high in the pulsar magnetosphere, probably close to the null-charge surface and to the -ray emitting regions. Furthermore, it suggests that for these high- pulsars, as in the -ray case, features in the radio profile represent caustics in the emission beam pattern.
1 Introduction
The observed pulses from pulsars are interpreted as an emission beam, fixed relative to the rotating neutron star, sweeping across the Earth. The magnetospheric emission-region structure, the viewing angle with respect to the rotation axis and the angle between the magnetic and rotation axes define the shape of the observed pulse profile. Pulsar radio emission is generally thought to originate within a few percent of the light-cylinder radius () above the polar caps (e.g. Lyne & Manchester, 1988). Many pulsars exhibit a “radius-to-frequency” mapping (Cordes, 1978) which is indicative of polar cap emission. The increasing pulse width at lower radio frequencies is interpreted as emission at increasing heights above the poles along more widely directed field lines. The radio profiles of many young pulsars and millisecond pulsars (MSPs) have an “interpulse”, a second pulse component separated from the main pulse by close to of pulse phase, or widely separated pulse components. In most cases, such pulsars do not exhibit radius-to-frequency mapping, that is, they have frequency-independent pulse component separations (Hankins & Fowler, 1986).
The known population of -ray pulsars has recently been greatly expanded by the six-month data release of the Fermi Large Area Telescope (LAT) (Abdo et al., 2010b, hereafter A10). This sample of 46 -ray pulsars includes both young pulsars and MSPs, all with high spin-down luminosities:
| (1) |
where gm cm-2 is the assumed neutron star moment of inertia, is the rotation period in seconds and is the period time-derivative.
Recent studies indicate that -ray emission from pulsars originates at high altitudes in the pulsar magnetosphere, near and from the last open field lines (e.g., Abdo et al., 2009c, b, A10). Two classes of high-altitude particle acceleration and emission model are generally considered: slot-gap accelerators (Muslimov & Harding, 2004; Dyks & Rudak, 2003) from the polar cap outwards along the last open field lines, and outer-gap accelerators (Romani & Yadigaroglu, 1995; Cheng & Zhang, 1998) where the last closed field lines cross the null-charge surface defined by ( is the rotation velocity vector, and is the magnetic field vector). These models result in what we shall term wide-beam emission geometries. Low-altitude models for -ray emission have been largely ruled out by the generally wide and multi-component -ray pulse profiles and the existence of pulsed -ray emission at energies greater than a few GeV; at low altitudes such emission is precluded by electron-positron pair absorption. Furthermore, Romani & Watters (2009) find that outer-gap models are statistically preferred over slot-gap models based on fits to LAT pulse profiles for a sample of bright -ray pulsars.
Four of the five brightest -ray pulsars detected by the Energetic Gamma-Ray Experiment Telescope (EGRET) are also radio pulsars (Thompson, 2008). This, together with the similar radio and -ray pulse morphology for many young pulsars and MSPs, led Manchester (2005) to suggest that, for these high- pulsars, the radio emission is also emitted in wide beams from the outer magnetosphere near . Within the framework of polar cap emission, Johnston & Weisberg (2006) and Karastergiou & Johnston (2007, hereafter KJ07) proposed that the radio emission from young pulsars is emitted at intermediate altitudes of km or in order to account for wide profiles of young pulsars.
In this letter, we identify samples of -ray-selected and radio-selected pulsars and consider the pulsars in each sample that also emit radio and -ray pulses respectively. We then discuss the implications of our analysis for the radio beams of young pulsars and MSPs.
2 The -ray and radio pulsar samples
We examine two pulsar samples: a -ray-selected sample (Sample G) and a radio-selected sample (Sample R). Each sample consists of a set of pulsars detectable using “blind search” techniques in the relevant band.
2.1 The -ray-selected Sample G
A10 presented a catalogue of -ray pulsars detected using two different techniques. First, 29 -ray pulsars were found using timing ephemerides, mostly from contemporaneous radio observations of 218 pulsars with erg s-1 (Smith et al., 2008). Twenty of these were young pulsars, and nine were MSPs. The second method involved a blind search for -ray pulsars at the positions of 300 unidentified -ray sources in the six-month LAT all-sky image. This search was sensitive to periodicities between 0.15 s and 2 s, and yielded 16 -ray pulsar discoveries. A further two pulsars with existing -ray rotation ephemerides – Geminga and PSR J11245916 – were also re-detected. While Geminga is well known for its lack of radio pulses (Kassim & Lazio, 1999), PSR J11245916 is a radio pulsar for which a -ray rotation ephemeris was used because the extremely weak radio emission makes radio timing difficult (Camilo et al., 2002).
Sample G consists of all -ray pulsars found in the LAT blind search. We further include those pulsars found using radio ephemerides that have phase-averaged -ray fluxes above the blind search sensitivity limit.111The LAT blind search sensitivity limit is plotted as a function of the diffuse -ray background in Figure 10 of A10. This is a conservative estimate, as some of the LAT blind search pulsars are in fact below the limit. Our inclusion in Sample G of pulsars where the -ray pulses were first detected using radio-based ephemerides is justified because the blind search over the unidentified -ray point sources was carried out after the search using radio ephemerides. In total, we included the 18 pulsars found in the -ray blind search and 17 pulsars found using radio ephemerides, of which three are MSPs. Searches for radio pulses from 15 of the blind search pulsars by Camilo et al. (2009b) have revealed two detections. We do not discard the three blind search pulsars that have not been searched for radio emission by Camilo et al. (2009b) because their positions have already been searched by the Greenbank low-luminosity pulsar survey (Dewey et al., 1985) with a limiting flux density of 2 mJy at 400 MHz . Therefore, of the 35 -ray pulsars in Sample G, 20 are radio pulsars.
2.2 The radio-selected Sample R
Sample R was formed from the 218 high- radio pulsars observed by the LAT, of which 25 are also -ray pulsars. values were corrected for the Shklovskii effect (Shklovskii, 1970) using values of , proper motion and NE2001 distances (Cordes & Lazio, 2002) given in the ATNF Pulsar Catalogue222http://www.atnf.csiro.au/research/pulsar/psrcat (Manchester et al., 2005); only pulsars with corrected erg s-1 were included in Sample R. We note that the Sample G pulsars have already had the Shklovskii corrections applied (A10).
PSR B150958 was not detected in the LAT data, but was found by the AGILE -ray telescope (Pellizzoni et al., 2009) and so we include it in Sample R. Another pulsar, PSR J00340534, was detected using 13 months of Fermi LAT data (Abdo et al., 2010a). Fourteen of the high- pulsars were not detected in blind radio surveys, but were found in deep searches of supernova remnants (SNRs) (e.g. Camilo et al., 2009a) and EGRET error boxes (e.g. O’Brien et al., 2008). We discard these 14 pulsars from Sample R. This leaves 200 radio-selected pulsars in Sample R, of which 17 are -ray pulsars. Table 1 summarizes the two samples.
3 Implications for the radio beams
We consider the radio and -ray beams as being defined by emissivity functions , where the index indicates, respectively, the radio and -ray bands. The co-latitude angle is measured from the rotation axis and is the longitudinal angle. The “latitude coverage”, , of a beam is defined as the longitude integration of :
| (2) |
The fraction of the celestial sphere swept out by each beam – the “beaming fraction” – is given by
| (3) |
where the normalisation is such that .
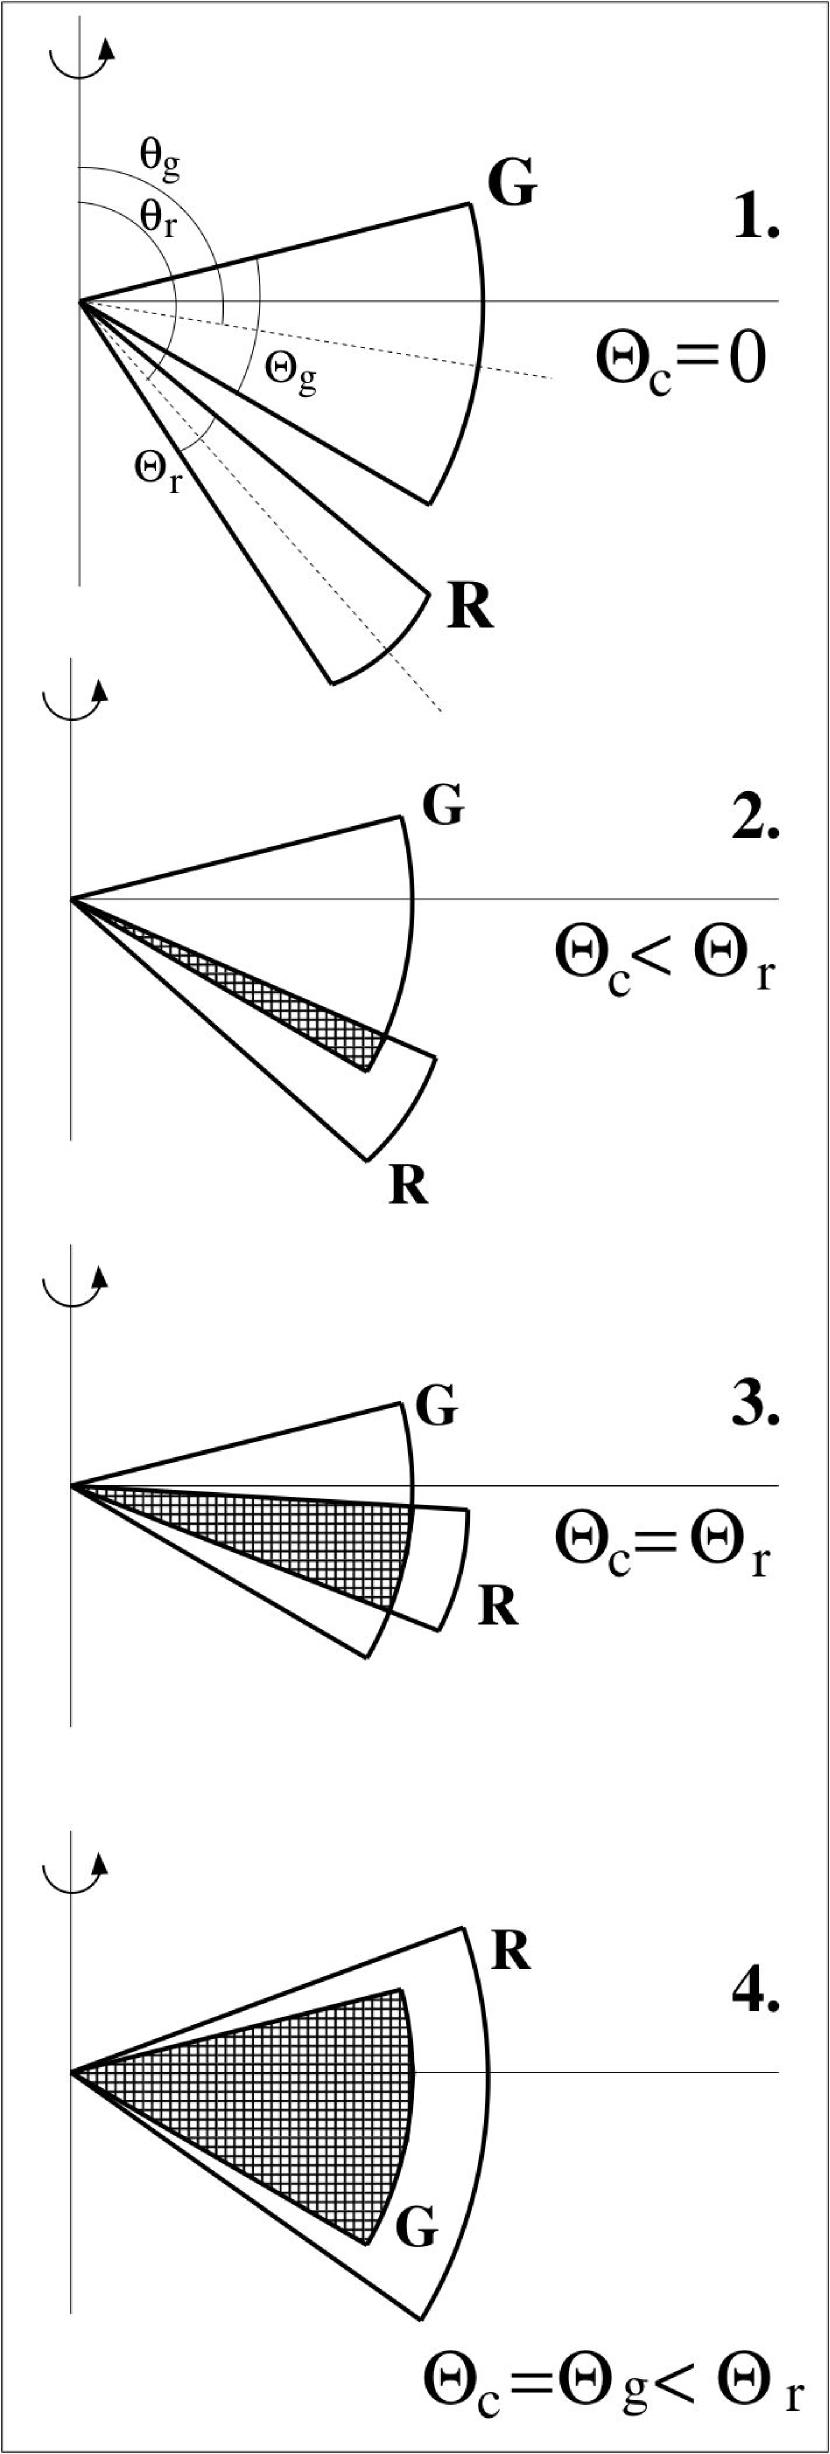
To assist with visualisation, we approximate the beams by “top-hat” functions where is constant (and non-zero) over some beamwidth and zero elsewhere as illustrated in Figure 1. is effectively the equivalent width of the beam in latitude. We note that the beaming fraction defined by Equation 3 corresponds to the term defined in Watters et al. (2009) for such a top-hat beam. There are four possible configurations for a pulsar emitting in both the radio and -ray bands: 1. The radio and -ray beams have no overlap. 2. Partial overlap of the beams. 3. The radio beam is narrower than the -ray beam and entirely overlapping. 4. The -ray beam is narrower than the radio beam and entirely overlapping.
If we assume that pulsar rotation axes are randomly oriented in space and that pulses are detectable for observer lines of sight within the beams, then the number of pulsars detectable in band is proportional to the beaming fraction . Furthermore, provided the beam co-latitude is not too small, then the number of pulsars detectable in band is approximately proportional to the beamwidth . Importantly, the number detected in both bands is proportional to the width of the overlap region .
The issue of pulsar detectability is of course critical. It is well-known that the -ray luminosity of a pulsar, , is strongly dependent on its spin-down luminosity . While some -ray emission models predict (e.g., Harding, 1981), we assume an empirical relation after Smith et al. (2008). This implies the commonly used -ray detectability metric of the pulsar spin-down flux at the telescope, , where is the pulsar distance. In contrast, the radio luminosity of pulsars is essentially uncorrelated with both and . Given that nearly 2000 radio pulsars are known compared to just 46 -ray pulsars, it is reasonable to assume that selection effects are much more significant in the -ray band and that all -ray pulsars are emitting potentially detectable radio beams.
Therefore, for the -ray-selected Sample G, the radio fraction, i.e., the ratio of the number of radio detections to the total, , is an estimate of the ratio . For configuration 3 in Figure 1, ; in all other configurations . Therefore,
Since the values of follow a binomial distribution, the standard error on this mean value is
where is the number of pulsars in the sample.
We conclude that, on average for -ray emitting pulsars, the radio beaming fraction is at least half the -ray beaming fraction. It is possible that some of the current Sample G pulsars will be detected in the radio band, which would increase . With the continued operation of the LAT, it is certain that the sample of -ray-selected pulsars will increase. The value of may either increase or decrease, but its uncertainty will decrease. The longitudinal geometries of the beams are not constrained; therefore the radio and -ray emission regions need not be co-located.
To quantify the true latitude coverage of the radio beams with respect to the -ray beams, as opposed to just constraining the overlapping area, we compare the radio-selected Sample R with Sample G. First, given that the LAT is only sensitive to pulsars with high values of , the -ray fraction in Sample R, , is not significant to this discussion. Instead, we order the pulsars in the two samples by decreasing and consider the ratios and as functions of . For each pulsar, we compute the ratios for the sub-sample of pulsars with greater than or equal to the value for that pulsar.
The results are shown graphically in Figure 2. It is striking that the seven highest- Sample G pulsars are detected in both bands. Within the same range, all four Sample R pulsars are also -ray emitters. It is therefore evident that and have comparable values in this high- regime. For lower- values and correspondingly lower- values in Sample R (shown in the bottom panel of Figure 2) reduces sharply, but this is entirely due the selection for -ray pulsar detections. However, it is significant that some radio-only pulsars with between and erg s-1 have high values of . These pulsars probably have -ray beams not directed toward us, suggesting that the radio beams for these high- pulsars are of comparable width to the -ray beams and do not always overlap with their latitude coverage. Any of configurations 1, 2, or 4 in Figure 1 could be applicable to this case.
In contrast, under the assumption that radio pulse detectability is independent of , Sample G is free of these selection effects and the drop in at erg s-1 can be interpreted as an evolution in from unity for high- -ray pulsars to for lower- -ray pulsars. In general, the highest- pulsars are among the youngest known pulsars, as determined, for example, by SNR associations (Kaspi, 2000). Furthermore, pulsars evolve toward lower values. It therefore appears that, for the highest- pulsars, the radio and -ray beams have comparable beaming fractions with largely overlapping radio and -ray beams. As these pulsars age, the radio beams evolve to overlap about half the latitude coverage of the -ray beams. Ultimately the pulsars become undetectable in the -ray band and the radio beams become even narrower as they evolve toward the beaming fractions of typical for older pulsars (Tauris & Manchester, 1998).
4 Millisecond pulsars
The lower- pulsars in Samples G and R include five MSPs,333While Abdo et al. (2009a) report the -ray detections of eight MSPs, three did not fall within either of the cutoffs applied to Samples G or R. marked with the letter ‘M’ in Figure 2. Despite the differences between normal pulsars and MSPs (e.g., surface magnetic field strength and rotation period) we do not isolate MSPs from our samples for three reasons. First, the three MSPs in Sample G were -ray-selected, which implies some commonalities with young -ray pulsars. Second, the nine MSPs detected with the LAT by Abdo et al. (2009a) and Abdo et al. (2010a) have values of that are among those of the top 18 MSPs searched, which gives a -ray fraction of 0.5, consistent with the lower bound on the radio fraction for the lower- Sample G pulsars (). Third, it has been suggested by Manchester (2005), based on pulse profile and giant pulse characteristics, that millisecond pulsars have wide radio beams similar to those of young pulsars. Therefore, in the discussion below on the radio beams of -ray emitting pulsars, we treat young pulsars and MSPs together.
5 Discussion
To test the consistency of our results with various empirical polar-cap models for pulsar beaming, we carried out a series of Monte Carlo simulations for the Sample G pulsars to calculate their values of . Sample R was not considered because of the selection effects discussed above. We assume that the -ray beams sweep the entire celestial sphere, that is, we assume , consistent with outer-magnetosphere models (e.g., Watters et al., 2009). For each pulsar, pairs of and were randomly chosen from sinusoidal distributions peaked at ( is the angle between the rotation and magnetic axes and is the angle between the rotation axis and the line of sight). The radio beam opening half-angle , measured from the magnetic axis, was calculated for each Sample G pulsar and beaming model. The beaming fraction was then derived by finding the fraction of points with . Since both and ranged between 0 and , emission from both magnetic poles was accounted for.
We first consider the model of Rankin (1993) with for which we obtain an average beaming fraction of for the Sample G pulsars, somewhat lower than our estimate of . We note that our assumption of is conservative in this context; other similar simulations by Romani & Yadigaroglu (1995) and Harding et al. (2007) using theoretical predictions of based on the outer-gap model find and respectively, much less than the observed value.
We then considered the model of KJ07 which, for young pulsars, has a radio emission height above the polar caps of km, along with beaming along the last open field lines. This model results in , larger than our lower bound of . Hence, the KJ07 radio beaming model is consistent with our results. However, the fact that the seven highest- pulsars in Sample G are all observed to emit radio pulses (i.e., have ) is not predicted by the KJ07 model. The product of the radio beaming fractions derived from the KJ07 model of these seven pulsars is 0.22; hence, the KJ07 model has a 22% chance of reproducing this result.
In contrast to the KJ07 model, outer-magnetosphere wide-beam models for the radio emission predict , consistent with our result that is near unity for the highest- pulsars. Besides this, there are other compelling reasons to consider wide-beam models for these high- pulsars (cf., Manchester, 2005). First, there is an excess of pulsars with widely separated pulse components or interpulses among young, high- pulsars (e.g., see Fig. 1 of Weltevrede & Johnston, 2008). Many of these pulsars have pulse profiles very similar to observed -ray profiles, with bridge emission between the main components. Furthermore, they have frequency-independent component separations, inconsistent with low-altitude polar-cap models. As was first pointed out by Narayan & Vivekanand (1983), polarization results from many young pulsars indicate beams elongated in the latitude direction, with impact parameters, , that are much greater than observed pulse widths. This is inconsistent with polar-cap models but fully consistent with outer-magnetosphere models.
We therefore propose that the radio emission region for young high- pulsars is located high in the pulsar magnetosphere, relatively close to the null-charge surface and to the -ray-emitting region. The evolution in with suggests a slot-gap model for the radio emission and hence that radio profile components represent caustics just as for the -ray profiles. This interpretation is also consistent with a transition to low-altitude polar-cap emission for older pulsars.
Not all -ray pulsars are seen in the radio and not all high- radio pulsars are seen in -rays. This implies that, while the radio and -ray emission regions may be in the same general region of the pulsar magnetosphere, they are not necessarily co-located. In the case of PSR J00340534 however, the radio and -ray profiles are almost identical and aligned in phase, suggesting that the emission regions are in fact co-located (Abdo et al., 2010a).
6 Conclusions
By comparing the relative occurrence of radio and -ray pulsed emission in -ray-selected and radio-selected samples, we find that the radio beaming fraction appears to be close to unity for the highest- pulsars, decreasing to for lower- -ray pulsars. Our estimated lower bound , averaged over all -ray-selected pulsars, of is inconsistent with low-altitude polar-cap models for the radio emission but is consistent with KJ07’s intermediate-altitude polar-cap model. However, the KJ07 model is marginally inconsistent with our result that for the highest- pulsars. With other evidence from radio and -ray pulse morphologies, these results suggest that, for high- pulsars, the radio emission originates in wide beams from the vicinity of the null-charge surface, possibly with a slot-gap configuration, with profile components representing caustics in the emission pattern.
Improved statistics from further -ray and radio discoveries will help to test our conclusions. Modelling of radio pulse profiles with slot-gap or other wide-beam emission geometries for both young high- pulsars and MSPs would be valuable. If outer-magnetoshpere wide-beam radio emission from these pulsars is confirmed, it would have profound implications for pulsar population and evolution studies as well as our understanding of radio and -ray pulse emission mechanisms.
References
- Abdo et al. (2010a) Abdo, A. A. et al. 2010a, ApJ, 712, 957
- Abdo et al. (2009a) Abdo, A. A. et al. 2009a, Science, 325, 848
- Abdo et al. (2010b) Abdo, A. A. et al. 2010b, ApJS, 187, 460
- Abdo et al. (2009b) Abdo, A. A. et al. 2009b, ApJ, 700, 1059
- Abdo et al. (2009c) Abdo, A. A. et al. 2009c, ApJ, 695, L72
- Camilo et al. (2002) Camilo, F., Manchester, R. N., Gaensler, B. M., Lorimer, D. L., & Sarkissian, J. 2002, ApJ, 567, L71
- Camilo et al. (2009a) Camilo, F., Ransom, S. M., Gaensler, B. M., & Lorimer, D. R. 2009a, ApJ, 700, L34
- Camilo et al. (2009b) Camilo, F. et al. 2009b, ApJ, 705, 1
- Cheng & Zhang (1998) Cheng, K. S. & Zhang, L. 1998, ApJ, 498, 327
- Cordes (1978) Cordes, J. M. 1978, ApJ, 222, 1006
- Cordes & Lazio (2002) Cordes, J. M. & Lazio, T. J. W. 2002, preprint (arXiv:astro-ph/0207156)
- Dewey et al. (1985) Dewey, R. J., Taylor, J. H., Weisberg, J. M., & Stokes, G. H. 1985, ApJ, 294, L25
- Dyks & Rudak (2003) Dyks, J. & Rudak, B. 2003, ApJ, 598, 1201
- Hankins & Fowler (1986) Hankins, T. H. & Fowler, L. A. 1986, ApJ, 304, 256
- Harding (1981) Harding, A. K. 1981, ApJ, 245, 267
- Harding et al. (2007) Harding, A. K., Grenier, I. A., & Gonthier, P. L. 2007, Astrophys. Space Sci., 309, 221
- Johnston & Weisberg (2006) Johnston, S. & Weisberg, J. M. 2006, MNRAS, 368, 1856
- Karastergiou & Johnston (2007) Karastergiou, A. & Johnston, S. 2007, MNRAS, 380, 1678
- Kaspi (2000) Kaspi, V. M. 2000, in Pulsar Astronomy - 2000 and Beyond, IAU Colloquium 177, ed. M. Kramer, N. Wex, & R. Wielebinski (San Francisco: Astronomical Society of the Pacific), 485–490
- Kassim & Lazio (1999) Kassim, N. E. & Lazio, T. J. W. 1999, ApJ, 527, L101
- Lyne & Manchester (1988) Lyne, A. G. & Manchester, R. N. 1988, MNRAS, 234, 477
- Manchester (2005) Manchester, R. N. 2005, Astrophys. Space Sci., 297, 101
- Manchester et al. (2005) Manchester, R. N., Hobbs, G. B., Teoh, A., & Hobbs, M. 2005, AJ, 129, 1993
- Muslimov & Harding (2004) Muslimov, A. G. & Harding, A. K. 2004, ApJ, 606, 1143
- Narayan & Vivekanand (1983) Narayan, R. & Vivekanand, M. 1983, A&A, 122, 45
- O’Brien et al. (2008) O’Brien, J. T. et al. 2008, MNRAS, 388, L1
- Pellizzoni et al. (2009) Pellizzoni, A. et al. 2009, ApJ, 695, L115
- Rankin (1993) Rankin, J. M. 1993, ApJ, 405, 285
- Romani & Watters (2009) Romani, R. W. & Watters, K. P. 2009, ArXiv e-prints
- Romani & Yadigaroglu (1995) Romani, R. W. & Yadigaroglu, I.-A. 1995, ApJ, 438, 314
- Shklovskii (1970) Shklovskii, I. S. 1970, Sov. Astron., 13, 562
- Smith et al. (2008) Smith, D. A., Guillemot, L., Camilo, F., Cognard, I., Dumora, D., Espinoza, C., Freire, P. C. C., Gotthelf, E. V., & et al. 2008, A&A, 492, 923
- Tauris & Manchester (1998) Tauris, T. M. & Manchester, R. N. 1998, MNRAS, 298, 625
- Thompson (2008) Thompson, D. J. 2008, Reports on Progress in Physics, 71, 116901
- Watters et al. (2009) Watters, K. P., Romani, R. W., Weltevrede, P., & Johnston, S. 2009, ApJ, 695, 1289
- Weltevrede & Johnston (2008) Weltevrede, P. & Johnston, S. 2008, MNRAS, 391, 1210
| Sample | -ray pulsars | Radio pulsars |
|---|---|---|
| -ray-selected (G) | 35 | 20 |
| Radio-selected (R) | 17 | 200 |