Probing the molecular interstellar medium of M82 with Herschel-SPIRE spectroscopy††thanks: Herschel is an ESA space observatory with science instruments provided by European-led Principal Investigator consortia and with important participation from NASA.
We present the observations of the starburst galaxy M82 taken with the Herschel SPIRE Fourier Transform Spectrometer. The spectrum (194–671 m) shows a prominent CO rotational ladder from = 4–3 to 13–12 emitted by the central region of M82. The fundamental properties of the gas are well constrained by the high lines observed for the first time. Radiative transfer modeling of these high-S/N 12CO and 13CO lines strongly indicates a very warm molecular gas component at K and pressure of K cm-3, in good agreement with the H2 rotational lines measurements from Spitzer and ISO. We suggest that this warm gas is heated by dissipation of turbulence in the interstellar medium (ISM) rather than X-rays or UV flux from the straburst. This paper illustrates the promise of the SPIRE FTS for the study of the ISM of nearby galaxies.
Key Words.:
Galaxies: ISM – Galaxies:starburst – galaxies: individual: M82 – ISM: molecules – Submillimeter1 Introduction
Starburst galaxies provide us with the opportunity to study star formation and its effect on the interstellar medium (ISM) in extreme environments. These galaxies combine large central gas concentrations and high ionizing radiation fields, resulting in bright molecular, neutral and ionized gas emission lines.
At a distance of 3.9 Mpc (Sakai & Madore 1999), M82 is the most well-studied starburst galaxy in the local universe, and it is widely used as a starburst prototype in cosmological studies. Its infrared luminosity ( L⊙, Sanders et al. 2003) corresponds to a star-formation rate of 9.8 M⊙ yr-1, which has almost certainly been enhanced by its interaction with M81 and NGC 3077 (Yun et al. 1993). With a reported molecular gas content of M⊙ (Walter et al. 2002), its bright emission lines of CO and other molecules allow us to study its ISM in great detail (Shen & Lo 1995; Walter et al. 2002; Ward et al. 2003).
Far-infrared fine structure lines were used to constrain the physical properties of the ionized gas and photo-dissociation regions (PDRs) in M82. Colbert et al. (1999) found that the ionized gas emission can be reproduced with a 3–5 Myr old instantaneous starburst and a gas density of 250 cm-3, while the PDR component is best fit with a density of 2 000 cm-3, in pressure equilibrium with the ionized phase.
Stellar evolution and photoionization models (Förster Schreiber et al. 2003) indicate a series of a few, Myr-duration starbursts with a peak of activity 10 Myr ago in the central regions, and 5 Myr ago in the circumnuclear ring. Models of the PDR and molecular emission as a set of non-interacting hot bubbles driving spherical shells of swept-up gas into a surrounding uniform medium also predict a starburst age of 5–10 Myr, but fail to match the observed far-infrared luminosity (Yao 2009).
The strengths of the CO lines place fundamental constraints on the physical properties of the molecular gas. Tilanus et al. (1991) fitted 12CO and 13CO lines from the central starburst up to = 3–2 with a single-component model with temperatures of 30–55 K and densities of 3–7 cm-3. Wild et al. (1992) used lines up to the CO = 6–5 transition to refine these parameters to 40–50 K and cm-3, while HCN and HCO+ lines suggested densities greater than cm-3 are present. Petitpas & Wilson (2000) showed evidence for a temperature or density gradient across the starburst region. Weiss et al. (2005) showed that CO emission up to = 3–2 is dominated by more extended regions while higher transitions originate in the central disk.
In this paper, we present observations of M82 with Herschel (Pilbratt et al. 2010) using the SPIRE Fourier Transform Spectrometer (FTS) (Griffin et al. 2010), which measures the complete far-infrared spectrum from 194 to 671 m. This spectral region is particularly interesting for probing the peak of the CO spectral line energy distribution (SLED) in gas-rich galaxies. The wealth of lines across a continuous spectral region allows for unprecedented precision in modeling the physical and chemical properties of the molecular ISM. Here, we focus on the measurement and analysis of the CO rotational transitions from the central starburst in M82.
2 Observations and data reduction
The galaxy M82 was observed by the SPIRE FTS in the high spectral resolution (FWHM=0.048 cm-1), point-source mode, on 2009 September 21 as a performance verification target. The total integration time was 1 332 seconds. The data were processed and calibrated as described in Swinyard et al. (2010). Only data from the central detectors in the two FTS bands are presented here.
The beam size of the FTS bolometers varies with wavelength across the individual bands (see Swinyard et al. 2010), and the spatial extent of the M82 central starburst is comparable to the beam size (mean FWHM 19″ and 35″ for the short- and the long-wavelength bands respectively). For a proper comparison with models, the spectrum must be scaled appropriately to a single beam size by a source-beam coupling factor (). This factor was obtained by convolving the M82 SPIRE photometer map at 250 m (Roussel et al. 2010), which has a beam FWHM of 181 (Griffin et al. 2010), with appropriate Gaussian profiles to reproduce the light distribution as seen by FTS bolometers at different beam sizes. The value of is then given by the ratio of the beam-integrated flux density of the map convolved to the beam size corresponding to the given frequency () to the beam-integrated flux density of the map with the largest beam size (434); its values goes from 1 to 0.42. This implicitly assumes that the dust and CO emission distributions within the beam are the same at all frequencies.
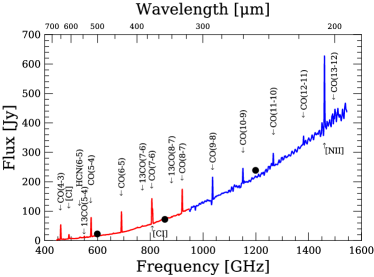
We opted to use the extended-source calibrated111 Extended-source flux calibration is derived from telescope emission measurements, while the point-source flux calibration is based on observations of known astronomical point sources. spectrum because the point-source calibration was more noisy and suffered from significant uncertainties below 600 GHz. We found, however, that the extended-source calibrated spectrum corrected for source-beam coupling is around a factor of 2 fainter than photometry for the same beam. We thus scaled the spectrum to match the photometry in the three bands by applying a single constant scaling factor for the short-wavelength band and a factor with a linear dependence on frequency for the long-wavelength band. The resulting spectrum is shown in Fig. 1 (for clarity, we show the spectrum apodized using the extended Norton-Beer function 1.5 from Naylor & Tahic 2007); we note that the short- and long-wavelength bands match very smoothly.
Line fluxes were recovered from the calibrated unapodized spectrum using a custom-written tool. It first subtracts the underlying continuum using a grey-body fit, then it removes any remaining large-scale ripples using a polynomial function. Emission lines were extracted by fitting sinc-convolved Gaussian line profiles. The strongest line is fitted first and then subtracted, with the process repeated until no line is found above a pre-set discrimination level. The integrated line fluxes were obtained by calculating the area under the fit. Table 1 lists the line fluxes and their 1 uncertainties derived from the fitting procedure. In addition to the reported uncertainties we should include the following contributions: (i) the uncertainty in the estimation of the source-beam coupling factor due to the uncertainty in the beam profile and the assumption of identical distributions for dust and CO emission, and (ii) the uncertainty involved in the scaling the spectrum to match the photometric data, and in the measurement of photometric data. We conservatively suggest an uncertainty of 30% for the line fluxes due to the above factors.
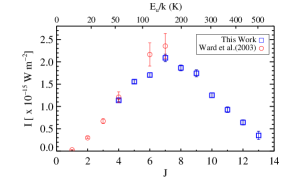
Fig. 2 shows the 12CO SLED, which peaks at the = 7–6 line. In the same plot, we draw ground-based data compiled by Ward et al. (2003) (W03 hereafter). These data were measured with a smaller beam size, but were given for two observed lobes. In the plot we used the sum of the fluxes measured in the two lobes (which have a small overlap, but fit within the 434 beam).
| Transition name | Frequency | Flux | |
|---|---|---|---|
| (rest, GHz) | (103 Jy km s-1) | (10-16 W m-2) | |
| 12CO = 4–3 | 461.041 | 74.1 2.2 | 11.32 0.33 |
| 12CO = 5–4 | 576.268 | 80.9 2.3 | 15.53 0.45 |
| 12CO = 6–5 | 691.473 | 74.0 2.0 | 17.04 0.46 |
| 12CO = 7–6 | 806.652 | 77.7 3.1 | 20.89 0.84 |
| 12CO = 8–7 | 921.800 | 60.7 2.1 | 18.64 0.65 |
| 12CO = 9–8 | 1036.912 | 50.5 2.3 | 17.44 0.79 |
| 12CO = 10–9 | 1151.985 | 32.6 1.3 | 12.51 0.50 |
| 12CO = 11–10 | 1267.014 | 21.9 1.5 | 9.28 0.63 |
| 12CO = 12–11 | 1381.995 | 14.0 1.2 | 6.44 0.57 |
| 12CO = 13–12 | 1496.922 | 7.1 1.9 | 3.53 0.93 |
| 13CO = 5–4 | 550.926 | 5.3 0.7 | 0.98 0.12 |
| 13CO = 7–6 | 771.184 | 3.2 0.6 | 0.81 0.16 |
| 13CO = 8–7 | 881.273 | 2.3 0.7 | 0.68 0.22 |
| HCN = 6–5 | 531.716 | 2.9 0.7 | 0.52 0.12 |
| C I | 492.161 | 20.6 1.6 | 3.38 0.26 |
| C I | 809.342 | 43.2 0.9 | 11.66 0.25 |
| N II | 1462.000 | 124.1 5.8 | 60.51 2.85 |
3 Radiative transfer modeling
We used RADEX (van der Tak et al. 2007), a non-LTE code that computes the intensities of molecular lines by iteratively solving for statistical equilibrium using an escape-probability formalism assuming a uniform expanding sphere, to model the CO line intensities. The main inputs to RADEX are the gas density (), the kinetic temperature (), and the CO column density per unit line width (CO)/). We ran the code for a large parameter grid in (20–1 000 K), (– cm-3), CO) (– cm-2), and CO) (–cm-2). From this grid of models, we generated likelihood distributions by adapting the method described in W03, for , , CO), CO), and pressure by comparing the RADEX and observed line fluxes.
To avoid any non-physical situation we applied two priors in this analysis following W03. The first one limits the 12CO column density in a way that the total mass of the molecular gas producing the CO lines cannot exceed the dynamical mass of the galaxy according to the following relation:
| (1) |
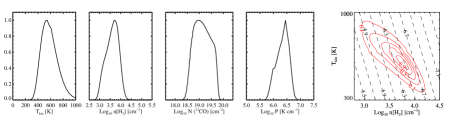
where the dynamical mass of the disk M☉, the radius of the disk , the abundance of CO relative to H2, (W03), and is the mean molecular weight in units of . The second prior limits the column length to be less than that of the entire molecular region according to . In this analysis we used all the 12CO and 13CO lines in Table 1 along with their 1 statistical errors. It was necessary to add 20% and 10% uncertainties for the CO 8–7 and 8–7 lines, respectively, to avoid un-physically narrow and noisy distributions (consistent with the additional 30% line flux uncertainty estimate in Sect. 2). The resulting distributions are shown in Fig. 3 for each variable, marginalizing over the other variables. The modeling only depends on the relative line fluxes, therefore the results will not be affected by the uncertainties in the absolute flux calibration.
4 Results and discussion
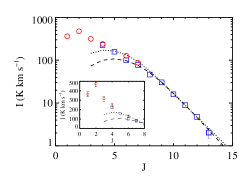
We found that the highest likelihood model (dotted line in Fig. 4) provides a good fit to our data (open squares), in particular for the higher lines ( 7–6). The likelihood contour plot of temperature and density in Fig. 3 (last panel) strongly indicates that the observed emission is coming from very warm gas with a kinetic temperature of 540 K and a pressure of K cm-3. The detailed physical characteristics of the warm gas are listed in Table 2, which are obtained from the likelihood distributions shown in Fig. 3.
The ISM of this galaxy has been well-studied using ground-based observations – in particular the lowest-lying CO rotational lines that provide constraints on the physical state of the cold molecular gas. Several studies from ground-based CO observations, including W03, have identified cold gas at 30 K. We show W03 data (open circles) over-plotted in Figure 4. From 7–6 lines, W03 deduced the presence of a warm component, in agreement with our finding, but with different temperature, mass and density. Having observations up to = 13–12 enables a much better constraint to be placed on these parameters than is possible from the lower lines. A colder gas component is also consistent with the deviation of our lower lines, especially CO = 4–3, from our highest-likelihood model. If we use only the higher- lines ( 7–6) in our likelihood analysis, we get a model in better agreement with these lines while underpredicting the lower- lines, supporting the hypothesis of a contribution of the colder component to those lines.
Assuming of and an intrinsic line width of 180 km s-1 (W03), and using our beam-averaged CO column density we find the mass of warm gas to be M☉ within a beam area of about 2140 square arcseconds, likely covering most of the molecular emission from the galaxy. Using the mass of the cold gas from W03 we find a ratio of cold gas to the SPIRE-observed warm gas mass of . The best-fitting model predicts the optical depth for the CO lines, which peaks at a value of 1.7 for = 6–5, and then drops to approximately for = 13–12.
Mid-IR H2 rotational lines are optically-thin and easily thermalized, so they provide an independent constraint on the mass of warm gas. Several transitions have been studied with ISO (Rigopoulou et al. 2002) and Spitzer (Beirão et al. 2008). Both studies agree that the S(1) to S(2) line ratio suggests K (assuming an ortho-to-para ratio of 3), in excellent agreement with our temperature. Using the Spitzer measurement of S(1) line flux corrected for our larger beam we calculate a mass of . Given the uncertainty on , and considerable extinction (; from dust models of Laor & Draine (1993) extrapolated to our wavelengths) of the S(1) line, we find it to be consistent with our mass range.
| Quantity | Most Probable Value | range† |
| (K) | 545 | 350 – 825 |
| (cm-3) | 3.7 | 3.0 – 4.1 |
| LogCO) (cm-2) | 19.0 | 18.5 – 19.8 |
| CO)‡ (cm | 17.4 | 17.2 – 17.9 |
| CO)/CO) | ||
| Log (K cm-3) | 6.4 | 5.8 – 6.7 |
| () | 1.2 | 0.7 – 3.6 |
| † Ranges are for 95% confidence intervals | ||
| ‡ Beam averaged column density where is an area filling factor | ||
Our inferred thermal pressure ( K cm-3) is comparable to both that of the M82 atomic gas as probed by the C II and O I transitions (Kaufman et al. 1999; Lord et al. 1995), and the UV-shielded dense gas (Naylor et al. 2010), although this does not imply pressure equilibrium between the phases. Our warm-component mass is also similar to the M☉ inferred from the photodissociation region (PDR) analysis based on the atomic gas lines (Kaufman et al. 1999). However, the CO emission in the warm molecular gas likely does not arise from PDRs. This is because we measure CO transitions that are much more luminous than predicted by the PDR models. These models require an extremely high density PDR (n ) to reproduce the = 6–5 and 7–6 intensities, a condition which is clearly ruled out by the atomic lines and their ratio to the far-IR flux.
At a temperature of about 500 K, H2 will be the dominant coolant compared to CO. This is evident from the observed H2 line luminosities, and agrees with the model predictions (Neufeld et al. 1995; Le Bourlot et al. 1998). The models predict H2 cooling of ergs s-1 per molecule for the temperature and density of SPIRE-observed warm gas. This implies a total molecular gas cooling of about 2.6 L☉/M☉; i.e., M☉ of gas will radiate about in H2 lines, in good agreement with the value derived from ISO and Spitzer data.
What is the heating source of this warm molecular gas? Hard X-rays from an AGN have the potential for heating molecular gas in an XDR (Maloney et al. 1996), but there is no strong evidence for an AGN in M82 (Strickland & Heckman 2007). Moreover, with a strong XDR component, such as seen in Mrk231 (van der Werf et al. 2010), the SLED becomes flat at high instead of decreasing as in M82. Another scenario is heating via the enhanced cosmic ray density generated by the high supernova rate in the nuclear starburst (Suchkov et al. 1993). With a cosmic ray energy deposition rate of 3.5– eV s-1 per H2 molecule in the Galaxy (Goldsmith & Langer 1978; van Dishoeck, & Black 1986), the energy input per mass in M82 is 0.09 to 0.3 L☉/M☉, too low to match the observed cooling.
A second possibility is heating from the dissipation of turbulence (Falgarone & Puget 1995; Mac Low 1999; Pan & Padoan 2009). Using a velocity gradient of 35 km s-1 pc-1 computed from our best fit RADEX model and a typical sizescale (or Jeans length) between 0.3 to 1.6 pc in the expression for turbulent heating per unit mass from Bradford et al. (2005), we can match the observed cooling of 2.6 L☉/M☉. Our velocity gradient is large, particularly when compared with the few km s-1 velocity spread found on 1 pc scales in Galactic star-forming sites, but may not be unreasonable in M82 given the powerful stellar winds known to be present in the starburst.
5 Conclusions
We have presented the Herschel-SPIRE spectroscopic observations of the starburst galaxy M82. The spectra show a prominent CO emission-line ladder along with C I and N II lines. Radiative transfer modeling of CO lines clearly indicates a warm gas component at 500 K in addition to the cold (30 K) component derived from ground-based studies. The properties of the warm gas are strongly constrained by the high lines, observed here for the first time. The temperature and mass of warm gas agree with the H2 rotational lines observations from Spitzer and ISO. At this temperature H2 is the dominant coolant instead of CO, and we argue that turbulence from stellar winds and supernovae may be the dominant heating mechanism.
Acknowledgements.
We are grateful to P. Maloney for his advices on radiative transfer modeling, and to the SPIRE FTS team for assistance with data reduction. SPIRE has been developed by a consortium of institutes led by Cardiff University (UK) and including Univ. Lethbridge (Canada); NAOC (China); CEA, OAMP (France); IFSI, Univ. Padua (Italy); IAC (Spain); Stockholm Observatory (Sweden); Imperial College London, RAL, UCL-MSSL, UKATC, Univ. Sussex (UK); and Caltech/JPL, IPAC, Univ. Colorado (USA). This development has been supported by national funding agencies: CSA (Canada); NAOC (China); CEA, CNES, CNRS (France); ASI (Italy); MCINN (Spain); SNSB (Sweden); STFC (UK); and NASA (USA). Additional funding support for some instrument activities has been provided by ESA.References
- Beirão et al. (2008) Beirão, P., Brandl, B. R., Appleton, P. N., et al. 2008, ApJ, 676, 304
- Bradford et al. (2005) Bradford, C. M., Stacey, G. J., Nikola, T., et al. 2005, ApJ, 623, 866
- Colbert et al. (1999) Colbert, J. W., Malkan, M. A., Clegg, P. E., et al. 1999, ApJ, 511, 721
- Falgarone & Puget (1995) Falgarone, E., Puget, J.-L. 1995, A&A, 293, 840
- Förster Schreiber et al. (2003) Förster Schreiber, N. M., Genzel, R., Lutz, D., & Sternberg, A. 2003, ApJ, 599, 193
- Goldsmith & Langer (1978) Goldsmith, P. F., Langer, W. D. 1978, ApJ, 222, 881
- Griffin et al. (2010) Griffin, M. et al. 2010, A&A, this volume
- Kaufman et al. (1999) Kaufman, M. J., Wolfire, M. G., Hollenbach, D J., & Luhman, M. L. 1999, ApJ, 527, 795
- Kaufman et al. (2006) Kaufman, M. J., Wolfire, M. G., & Hollenbach, D. J. 2006, ApJ, 644, 283
- Mac Low (1999) Mac Low, M.-M. 1999, ApJ, 524, 169
- Maloney et al. (1996) Maloney, P. R., Hollenbach, D. J., & Tielens, A. G. G. M. 1996, ApJ, 466, 561
- Naylor et al. (2010) Naylor B. J., Bradford, C. M., Aguirre, J. E., et al. 2010, ApJ, submitted
- Naylor & Tahic (2007) Naylor D. A., & Tahic M. K., 2007, J. Opt. Soc. Am. A, 24, 3644
- Neufeld et al. (1995) Neufeld, D. A., Lepp, S., Melnick, G. J. 1995, ApJS, 100, 132
- Laor & Draine (1993) Laor, A., & Draine, B. T. 1993, ApJ, 402, 441
- Le Bourlot et al. (1998) Le Bourlot, J., Pineau des Forêts, G., & Flower, D. R. 1999, MNRAS, 305, 802
- Lord et al. (1995) Lord, S. D., Hollenbach, D. J., Colgan, S. W. J. et al. 1995, ASPC, 73, 151
- Pan & Padoan (2009) Pan, L., & Padoan, P. 2009, ApJ, 692, 594
- Petitpas & Wilson (2000) Petitpas, G. R., & Wilson, C. D. 2000, ApJ, 538, L117
- Pilbratt et al. (2010) Pilbratt, G. et al. 2010, A&A, this volume
- Rigopoulou et al. (2002) Rigopoulou, D., Kunze, D., Lutz, D., Genzel, R., & Moorwood, A. F. M. 2002, A&A, 389, 374
- Roussel et al. (2010) Roussel, H. et al. 2010, A&A, this volume
- Sakai & Madore (1999) Sakai, S. & Madore, B. F. 1999, ApJ, 526, 599
- Sanders et al. (2003) Sanders, D. B., Mazzarella, J. M., Kim, D.-C., Surace, J. A., & Soifer, B. T. 2003, AJ, 126, 1607
- Seaquist et al. (2006) Seaquist, E. R., Lee, S. W., & Moriarty-Schieven, G. H. 2006, ApJ, 638, 148
- Shen & Lo (1995) Shen, J. & Lo, K. Y., 1995, ApJ, 445, L99
- Strickland & Heckman (2007) Strickland, D. K., & Heckman, T. M. 2007, ApJ, 658, 258
- Suchkov et al. (1993) Suchkov, A., Allen, R. J., & Heckman, T. M. 1993, ApJ, 413, 542
- Swinyard et al. (2010) Swinyard, B. G., Ade, P., Baluteau, J-P. et al. 2010, A&A, this volume
- Tilanus et al. (1991) Tilanus, R. P. J., Tacconi, L. J., Sutton, E. C., Zhou, S., Sanders, D. B., Wynn-Williams, C. G., Lo, K. Y., & Stephens, S. A., 1991, ApJ, 376, 500
- van der Tak et al. (2007) van der Tak, F. F. S., Black, J. H., Schöier, F. L., Jansen, D. J., & van Dishoeck, E. F. 2007, A&A, 468, 627
- van der Werf et al. (2010) van der Werf et al. 2010, A&A, this volume
- van Dishoeck, & Black (1986) van Dishoeck, E. F., Black, J. H. 1986, ApJS, 62, 109
- Walter et al. (2002) Walter, F, Weiss, A., & Scoville, N. 2002, ApJ, 580, L21
- Ward et al. (2003) Ward, J. S., Zmuidzinas, J., Harris, A. I., & Isaak, K. G. 2003, ApJ, 587, 171 (W03)
- Weiss et al. (2005) Weiss, A., Walter, F., & Scoville N. Z. 2005, A&A, 438, 533
- Wild et al. (1992) Wild, W., Harris, A. I., Eckart, A., et al. 1992, A&A, 265, 447
- Yao (2009) Yao, L. 2009, ApJ, 705, 766
- Yun et al. (1993) Yun, M. S., Ho, P. T. P., & Lo, K. Y., 1993, ApJ, 411, L17