22institutetext: Space Telescope Science Institute, 3700 San Martin Drive, Baltimore, MD 21218, USA
33institutetext: Steward Observatory, University of Arizona, 933 North Cherry Ave., Tucson, AZ 85721, USA
44institutetext: Centre d’Étude Spatiale des Rayonnements, CNRS, 9 av. du Colonel Roche, BP 4346, 31028 Toulouse, France
55institutetext: Department of Astronomy, Lab for Millimeter-wave Astronomy, University of Maryland. College Park, MD 20742-2421, USA
66institutetext: Department of Astronomy, University of Virginia, PO Box 3818, Charlottesville, VA 22903, USA
77institutetext: Sterrewacht Leiden, Leiden University, PO Box 9513, 2300 RA Leiden, The Netherlands
88institutetext: Astronomy & Space Science, Sejong University, 143-747, Seoul, South Korea
99institutetext: Department of Physics and Astronomy, University of Missouri, 314 Physics Building, Columbia, MO 65211, USA
1010institutetext: Jodrell Bank Centre for Astrophysics, Alan Turing Building, School of Physics and Astronomy, The University of Manchester, Oxford Road, Manchester, M13 9PL, UK
1111institutetext: Department of Astronomy, University of Michigan, 830 Dennison Building, Ann Arbor, MI 48109-1042, USA
1212institutetext: Departamento de Astronomia, Universidad de Chile, Casilla 36-D, Santiago, Chile
The Herschel revolution: unveiling the morphology of the high mass star formation sites N44 and N63 in the LMC††thanks: Herschel is an ESA space observatory with science instruments provided by European-led Principal Investigator consortia and with important participation from NASA.
Abstract
Aims. We study the structure of the medium surrounding sites of high-mass star formation to determine the interrelation between the H ii regions and the environment from which they were formed. The density distribution of the surroundings is key in determining how the radiation of the newly formed stars interacts with the surrounds in a way that allows it to be used as a star formation tracer.
Methods. We present new Herschel/SPIRE 250, 350 and 500 m data of LHA 120-N44 and LHA 120-N63 in the LMC. We construct average spectral energy distributions (SEDs) for annuli centered on the IR bright part of the star formation sites. The annuli cover 10100 pc. We use a phenomenological dust model to fit these SEDs to derive the dust column densities, characterise the incident radiation field and the abundance of polycyclic aromatic hydrocarbon molecules. We see a factor 5 decrease in the radiation field energy density as a function of radial distance around N63. N44 does not show a systematic trend. We construct a simple geometrical model to derive the 3-D density profile of the surroundings of these two regions.
Results. Herschel/SPIRE data have proven very efficient in deriving the dust mass distribution. We find that the radiation field in the two sources behaves very differently. N63 is more or less spherically symmetric and the average radiation field drops with distance. N44 shows no systematic decrease of the radiation intensity which is probably due to the inhomogeneity of the surrounding molecular material and to the complex distribution of several star forming clusters in the region.
Key Words.:
Magellanic Clouds, Galaxies: star formation, Infrared: ISM, Submillimeter: ISM, ISM: structure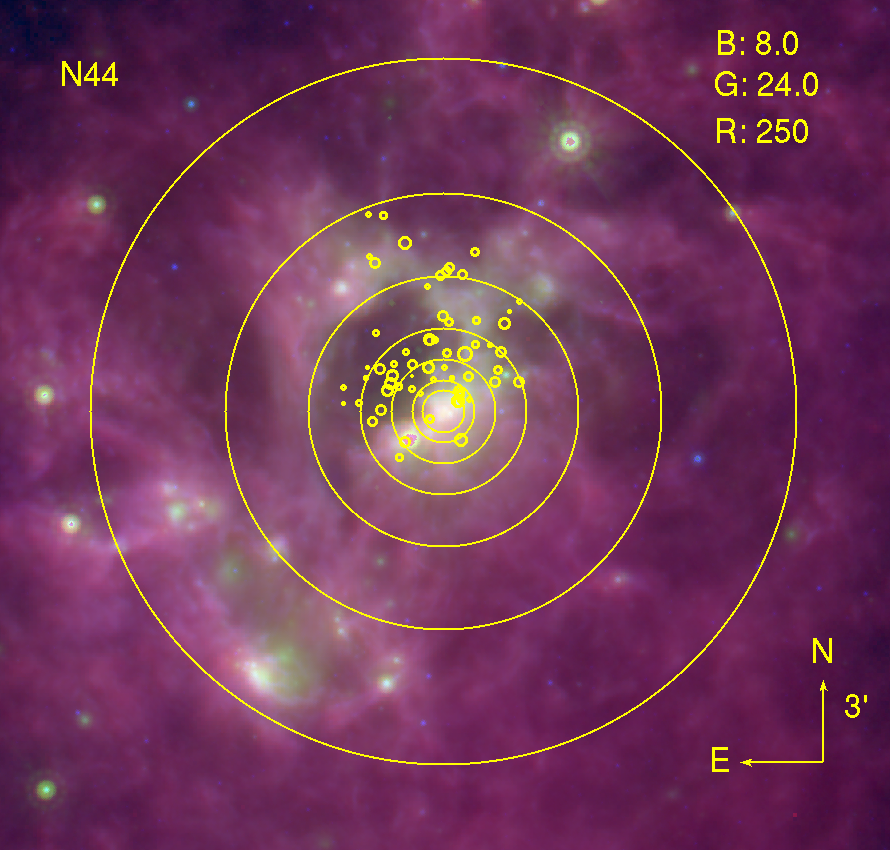
1 Introduction
High-mass star formation (SF) sites (hereafter HMSFSs) are the beacons by which we probe a large part of the physics of external galaxies. They generally represent the most important tracers of the properties of their host galaxies in terms of star formation rate (SFR) and general activity. The most frequent tracers of the star-formation activity generally use the fact that the abundant UV light coming from the hot, young stars is absorbed in the vicinity and reradiated in the form of line or continuum emission. This is true, for example, for H (e.g. Kennicutt, 1998), the aromatic emission bands in the mid-IR (e.g. Calzetti et al., 2007) or the IR continuum due to solid-state materials (dust, e.g. Soifer et al., 1986). These tracers work relatively well and are used to characterise nearby star forming regions and star forming galaxies out to large redshifts, although interesting discrepancies have been noted for dwarf galaxies at low SFR (see Lee et al., 2009). One of the main assumptions that enters into the quantitative interpretation of these data is the geometry of the material surrounding the newly formed stars, in particular, where the UV light is being reprocessed. For example, if the UV photons escape from the ionised medium this may boost the aromatic feature strengths and strongly influence the lines originating from the surrounding photo-dissociation regions (PDRs). There are indications that this geometry in external galaxies may qualitatively and quantitatively differ from that observed in the Milky Way (MW) (e.g. Madden et al., 2006; Galametz et al., 2009). One simple effect may be that at different metallicities the surrounding medium is more or less opaque and therefore the UV photons have a different mean free path. More complex scenarios are also discussed in the literature. For example, clumpiness of the molecular cloud may lead to small molecular cores surrounded by large PDRs. Herschel with its unprecedented wavelength coverage and angular resolution at submillimeter (submm) wavelengths provides a unique opportunity to probe the cold interstellar medium (ISM) and sample the effects of the environment on the resulting SF tracers. In particular, it is well suited to trace the distribution of matter around HMSFSs and to map the way the UV radiation permeates and heats the surroundings. Here we present a study of two HMSFSs in the Large Magellanic Cloud (LMC) based on data taken in the HERITAGE program (PI. Meixner, see Meixner et al., 2010).
2 Data treatment and modeling
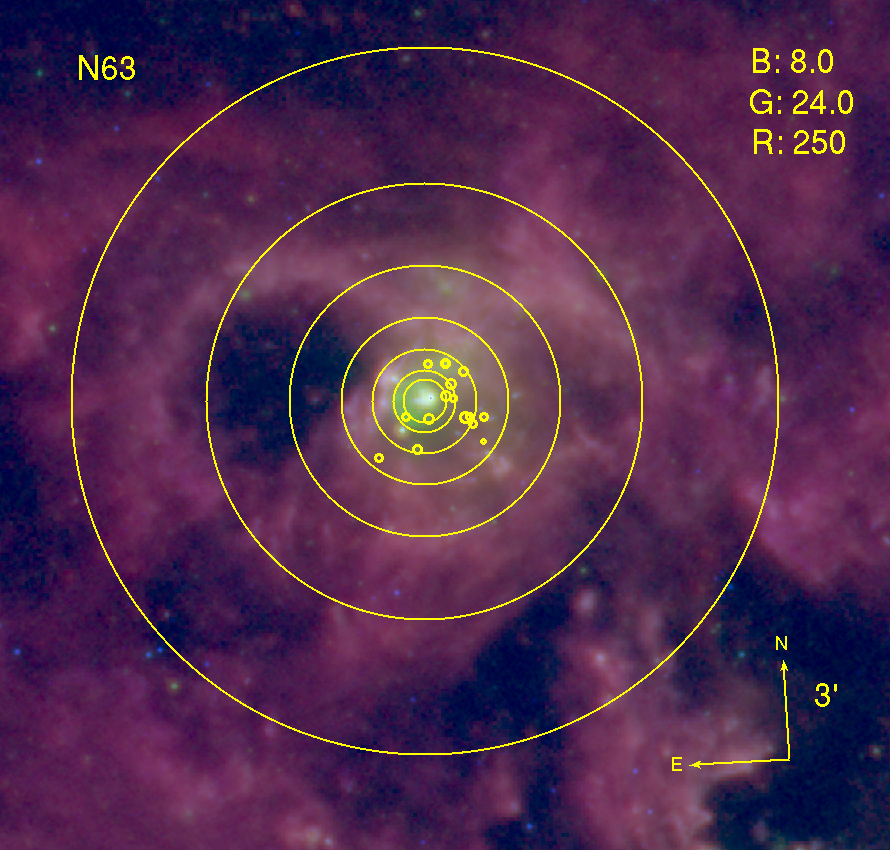
We construct spectral energy distributions (SEDs) of the environment of two distinct HMSFSs (LHA 120-N 44 and LHA 120-N 63 (Henize, 1956), hereafter N44 and N63, respectively) in the strip of the LMC that was mapped during the science demonstration phase. The two regions were chosen because they are the brightest and most isolated regions observed. N44 is the brightest H ii complex in the observed strip. Massive star formation has been active in this region; it contains three OB associations LH47, 48, and 49 with ages 10 Myr at the central super-bubble and 5 Myr at the super-bubble rims and surrounding dense H ii regions, as well as a large number of massive young stellar objects (YSOs) with ages 1 Myr (Lucke & Hodge, 1970; Oey & Massey, 1995; Chen et al., 2009). N44 is also the brightest source at all of the SPIRE wavelengths (250, 350, and 500 m) in the strip (Meixner et al., 2010). By contrast, N63 is a simple, roughly round H ii region. It contains one OB association LH83 with an age 5 Myr and a number of massive YSOs (Bica et al., 1996; Caulet et al., 2008). At SPIRE wavelengths, N63 is in a relatively isolated environment. Thus, we use N44 as an example of a prominent H ii regions seen in more distant galaxies and N63 as a comparison whose simple structure makes it more straightforward to relate dust properties with physical conditions of the ISM.
The data we use are: 2MASS J, H, Ks (Skrutskie et al., 2006), Spitzer IRAC1, 2, 3, 4 (Fazio et al., 2004), MIPS 24, 70 and 160 m (Rieke et al., 2004) and Herschel (Pilbratt et al., 2010) SPIRE 250, 350 and 500 m (Griffin et al., 2010). See Meixner et al. (2010) for a description of the SPIRE data treatment. We do not use the PACS information since the data we have until now does not allow us to extract extended source fluxes with sufficient accuracy. We have extracted maps of 40′40′ centered on each H ii region. We have convolved these data to a spatial resolution of 38′′ set by the MIPS 160 m/SPIRE 500 m data. The 2MASS data have been convolved with the beam of MIPS 160 m, the IRAC14, MIPS 24, 70 m have been convolved using custom-made kernels (Gordon et al., 2008). The SPIRE data have all been convolved to the SPIRE 500 m resolution assuming Gaussian beam profiles with FWHM of 18.1, 25.2 and 36.9′′ for SPIRE 250, 350 and 500, respectively. We have resampled the convolved images to the pixel scheme of the MIPS 160 m image using the IDL/astrolib routine hastrom.
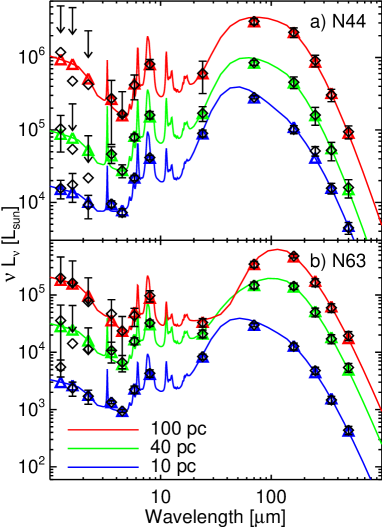
The center of the HMSFS is determined, by fitting a 2D Gaussian profile, as the brightest source in the total IR (TIR) image. The TIR image is obtained by simple integration from 8 to 500 m. The reasoning behind using this definition of the center is that this location (on a size scale of tens of parsecs ) probably hosts the most active site of embedded star formation. We extract flux densities (in Jy) for annuli around the given center (see Fig. 1). We use the following radii for the sizes of the annuli: 35, 47, 78, 125, 200, 330 and 530′′, corresponding to linear sizes of 8, 12, 19, 30, 48, 80 and 128 pc assuming a distance to the LMC of 50 kpc (e.g. Schaefer, 2008). The annuli were chosen to be larger than the apparent size of the HMSFS so as to be able to also study the regime in which the emission becomes dominated by the general LMC. Examples of the extracted SEDs for each region in different annuli are shown in Fig. 2a,b. There is a clear and systematic trend for the far-IR to peak at longer wavelength for the outer annuli. In the case of N44 this trend is to a large part offset by the broadness of the far-IR peak. This is an indication that the emission arises from a broad temperature distribution. We also note that we detect polycyclic aromatic hydrocarbon (PAH) emission (at 8 m) in all SEDs. Since we are, to first order, interested in the “shape” of the IR SED as a function of distance, we create relative flux density maps by dividing the maps at each wavelength by the TIR map in order to measure the scatter. The scatter inside each annulus of the relative intensity map was used to estimate the uncertainty (1) on the flux densities. Note, that this method for determining the variance causes a large scatter in the near-IR pixels which are dominated by stellar light. This is the reason for the large error-bars at these wavelengths in Fig. 2a,b.
We use a phenomenological dust model, which is described in detail in Galametz et al. (2009), to interpret the observed SEDs. This model consists of a quantity of dust, with a realistic composition (PAHs, silicate and graphite) and grain-size distribution (complex molecules, very small (VSG) and big grains) illuminated by a radiation field with a range of intensities. The main parameters that we aim to constrain are: 1) total dust mass, 2) the range of illumination intensities, and 3) the relative composition, in particular the mass fraction of PAHs. The radiation field distribution is represented by a power-law function that describes which fraction of the matter is exposed to what radiation field (Dale & Helou, 2002):
| (1) | |||
| (2) |
where is the intensity of the incident radiation field the dust is subjected to (=1 for the diffuse MW environment), and the minimum and maximum value of and U is the mass-weighted averaged radiation field intensity.
The starting point for the modeling is to adopt dust properties that fit the MW IR emission well (Zubko et al., 2004, distribution BARE-GR-S). The observed 24 m fluxes in the diffuse ISM force us to use a dust size distribution that is different from the MW values. The best fits are obtained by reducing the mass fraction of VSGs to total dust by 50 per cent. We use the MW interstellar radiation field as the shape of the radiation field and do not vary this. The derived dust masses are robust against the choice of interstellar radiation field and the mass fraction of VSGs. However, the relative mass fractions of the various dust constituents may depend on these choices.
In comparing the dust mass tracers with the gas tracers (Meixner et al., 2010; Gordon et al., 2010; Duval et al., 2010) some issues have been raised about the applicability of this composition to the LMC, in particular the graphitic component. We have verified that the derived mass and radiation field profiles (the shape as a function of annulus) are not sensitive to the choice of the carbon bearing grains. However, the absolute values of the derived parameters depend on this choice. Uncertainties on the derived parameters were estimated using a Monte-Carlo evaluation. The fitting routine was repeated 300 times with the observational constraints varied randomly, according to their standard deviations and new best fit parameters are determined. The ensemble of best fit parameters is used to calculate the error-bars on each parameter (see Fig. 2).
3 Results
Fig. 2 a,b show representative SEDs and the best fit models. The models fit the data very well over the entire wavelength range, for all annuli. Most parameters are well constrained with a distribution of best fit parameters which is roughly symmetric around the central value. One exception to this is the U in the two outer annuli of N44. We find a distribution around the mean which is heavily skewed to low values of U. We do not detect a systematic submm excess, i.e. the whole wavelength range up to 500 m is well fit by the standard model. The model and the 500 m surface brightness agree on average within 3% with a very small dispersion. The model is in accordance with the findings of Gordon et al. (2010), who show that the evidence in the LMC for a submm excess is weak and if present it is confined to the more diffuse and fainter environments.
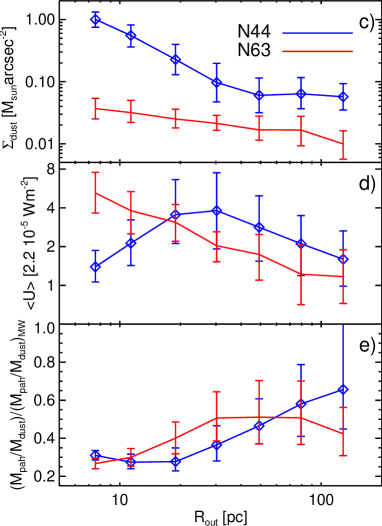
The SED fits allow us to study the derived properties as a function of annulus (projected distance). We show in Fig. 2c,d,e as a function of radius, the dust column density (), average radiation field intensity (U) and the mass fraction of PAHs normalised to the MW value. Both sources show a column density profile that decreases outwards, although the column density in the central region of N63 is not much higher than in the outer annuli. N63 causes an increase of a factor 23 of column density. The column density towards the central regions of N44 is 10 times higher than its environment.
The width of the IR SED, which is well determined using the SPIRE data, requires a significant dust mass at lower temperatures. This is reflected in the low values of U in panel d. U exhibits only a small range for the entire sample of SEDs. U decreases as a function of distance for N63. N44 does not exhibit any significant trend and the data are consistent with a constant U over a distance scale from 10100 pc. Note that U is weighted by dust mass and so it readily traces the radiation field as seen by the coldest dust along the line of sight.
We calculate the second moment of the radiation field distribution (), again weighted by dust mass in order to quantify the range of radiation field that the matter is exposed to. All SEDs require a wide range of . For N44 is roughly constant at the value of 30 meaning that the entire region is typified by a radiation field intensity ranging from 1 to 30. N63 shows an outward decreasing from 50 in the inner annulus to 2 in the outer. Thus the radiation field in N63 spans 5-55 (U-U+) on the inside and 1-3 in the outer annuli. This implies that the outer annuli in N63 closely resemble a diffuse environment.
The fraction of mass contained in PAHs increases with increasing radius out to about 50 per cent of the MW value. We find a significant depletion of the PAHs towards the central regions over 20 and 40 pc, for N44 and N63 respectively. Note that the smaller size of the depleted region is consistent with the fact that N63 is less prominent compared to its surroundings (see below). Interestingly, the radius of the depleted environment corresponds well to the area occupied by the ionising stars in Fig. 1. The fraction of the ionised PAHs is not well constrained but we have checked that there is no systematic effect of the fitting procedure that causes the observed trend in Fig. 2e.
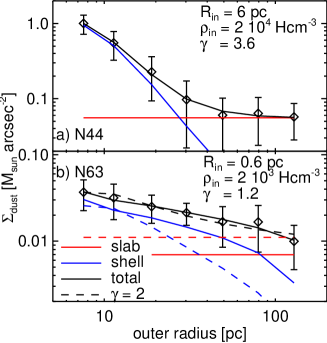
We construct a simple geometrical model to try to constrain the size and density of the matter in the HMSFSs, i.e. to deproject the observed column densities. We represent the molecular cloud around the H ii region as a geometrically thick shell. To this we add a slab that represents the disk of the LMC, i.e the diffuse extended emission. We assume a constant dust column density for the slab and a power-law profile for the shell ().
The dust mass profile and the best fit decomposition into these two components and the corresponding parameters are shown in Fig. 3. We have propagated the uncertainties on the dust column density in each annulus (see Fig. 3). The uncertainties are significant. We find in case N63, for which the over-density is weak compared to the slab (i.e. the disk of the LMC), that the geometrical parameters are not very well constrained. In particular, it is hard to constrain the parameter. The best fit model has which seems flat. If we fix at 2, the value expected for a cloud in hydrostatic equilibrium, we find that the distance where the slab component starts to dominate, i.e. the intersection of the blue and red lines in Fig. 3, reduces from 80 to 30 pc.
4 Discussion & Conclusion
Figs. 2 and 3 show the power of Herschel to determine the matter distribution around HMSFSs. We investigate the effect the new SPIRE constraints on the derived parameters and their uncertainties by also fitting the SEDs without using these SPIRE data. We find that the column density of dust is often very discrepant (by more than an order of magnitude) from the values derived using the SPIRE data. The derived profile for N44 (like Fig. 2 top panel) is virtually constant at a value of 0.1 M☉ arcsec-2 due to the fact that the cooler dust, is not well traced by the MIPS data. For N63 the model over-predicts the derived dust masses for the annuli between 20 to 60 pc by a large factor (5). In these cases the model tends to find very small values of . This artifact could perhaps be circumvented, when modelling those kind of regions, in cases where submm constraints are missing, by limiting the allowed range of in Eq. (1). The difficulty of constraining the radiation field parameters without the SPIRE bands is also reflected in the derived uncertainties. In particular the value of is ill-constrained which results in large, asymmetric error-bars on the derived column densities.
N44 and N63 exhibit strikingly different behaviour in the radiation intensity profile (Fig. 2d.) The lack of a systematic decrease of U around N44 indicates that we are observing dust with a wide range of temperatures along each line-of-sight. The inner annuli in N44 are affected by the superbubble to the NE of the OB association, where high values of U are expected. The low values of U for such a luminous SF region may reflect clumpiness. The profile is clearly incompatible with a centrally illuminated optically thin irradiation profile. It is clear from Fig. 1 that the studied regions are not very spherically symmetric (azimuthally smooth). In particular, N44 harbours several clusters and the peak of the X-ray emission is located in a cavity, 2030 pc away from the TIR peak (see Fig. 1). Measuring the azimuthally averaged properties smears out some of the characteristics. This smearing could have been the cause for the lack of trend seen in the average as seen by the dust (Fig. 2). We have verified that this small range of U is not simply an artifact of this averaging or a wrong choice of center of the annuli by studying the parameters we derive pixel by pixel in the maps which makes no assumptions about the geometry. Indeed the highest U in N44 is found close to the center we chose. Except for the very center all other values, with their scatter, are within the range as depicted in Fig. 2. We conclude that the choice of center does not dominate the lack of trend of N44 in the average radiation field. Thus this lack of trend reflects the true broad range of irradiation conditions along all lines of sight in N44 , which is an indication of the inhomogeneity of the ISM around N44. A simple dust model shows a deficit in PAHs toward the centers of these two regions. We find no evidence for a submm excess. We have used the observed dust column densities surrounding N44 and N63 to derive a 3-D model for these regions for the first time.
Acknowledgements.
We acknowledge financial support from the NASA Herschel Science Center, JPL contracts # 1381522 & 1381650. We thank the contributions and support from the European Space Agency (ESA), the PACS and SPIRE teams, the Herschel Science Center and the NASA Herschel Science Center (esp. A. Barbar and K. Xu) and the PACS and SPIRE instrument control centers, without which none of this work would be possible. We thank the referee, Glenn White, for comments that have improved the paper.References
- Bica et al. (1996) Bica, E., Claria, J. J., Dottori, H., Santos, Jr., J. F. C., & Piatti, A. E. 1996, ApJS, 102, 57
- Calzetti et al. (2007) Calzetti, D., Kennicutt, R. C., Engelbracht, C. W., et al. 2007, ApJ, 666, 870
- Caulet et al. (2008) Caulet, A., Gruendl, R. A., & Chu, Y. 2008, ApJ, 678, 200
- Chen et al. (2009) Chen, C., Chu, Y., Gruendl, R. A., Gordon, K. D., & Heitsch, F. 2009, ApJ, 695, 511
- Dale & Helou (2002) Dale, D. A. & Helou, G. 2002, ApJ, 576, 159
- Duval et al. (2010) Duval, J. et al. 2010, A&A, this volume
- Fazio et al. (2004) Fazio, G. G., Hora, J. L., Allen, L. E., et al. 2004, ApJS, 154, 10
- Galametz et al. (2009) Galametz, M., Madden, S., Galliano, F., et al. 2009, A&A, 508, 645
- Gordon et al. (2010) Gordon, K. et al. 2010, A&A, this volume
- Gordon et al. (2008) Gordon, K. D., Engelbracht, C. W., Rieke, G. H., et al. 2008, ApJ, 682, 336
- Griffin et al. (2010) Griffin, M. et al. 2010, A&A, this volume
- Henize (1956) Henize, K. G. 1956, ApJS, 2, 315
- Kennicutt (1998) Kennicutt, Jr., R. C. 1998, ARA&A, 36, 189
- Lee et al. (2009) Lee, J. C., Gil de Paz, A., Tremonti, C., et al. 2009, ApJ, 706, 599
- Lucke & Hodge (1970) Lucke, P. B. & Hodge, P. W. 1970, AJ, 75, 171
- Madden et al. (2006) Madden, S. C., Galliano, F., Jones, A. P., & Sauvage, M. 2006, A&A, 446, 877
- Meixner et al. (2010) Meixner, M. et al. 2010, A&A, this volume
- Oey (1996) Oey, M. S. 1996, ApJS, 104, 71
- Oey & Massey (1995) Oey, M. S. & Massey, P. 1995, ApJ, 452, 210
- Pilbratt et al. (2010) Pilbratt, G. et al. 2010, A&A, this volume
- Rieke et al. (2004) Rieke, G. H., Young, E. T., Engelbracht, C. W., et al. 2004, ApJS, 154, 25
- Schaefer (2008) Schaefer, B. E. 2008, AJ, 135, 112
- Skrutskie et al. (2006) Skrutskie, M. F., Cutri, R. M., Stiening, R., et al. 2006, AJ, 131, 1163
- Soifer et al. (1986) Soifer, B. T., Sanders, D. B., Neugebauer, G., et al. 1986, ApJ, 303, L41
- Zubko et al. (2004) Zubko, V., Dwek, E., & Arendt, R. G. 2004, ApJS, 152, 211