Asymmetric velocity correlations in shearing media
Abstract
A model of soft frictionless disks in two dimensions at zero temperature is simulated with a shearing dynamics to study various kinds of asymmetries in sheared systems. We examine both single particle properties, the spatial velocity correlation function, and a correlation function designed to separate clockwise and counter-clockwise rotational fields from one another. Among the rich and interesting behaviors we find that the velocity correlation along the two different diagonals corresponding to compression and dilation, respectively, are almost identical and, furthermore, that a feature in one of the correlation functions is directly related to irreversible plastic events.
I Introduction
In collections of particles with repulsive contact interaction there is a transition from a liquid to an amorphous solid state as the volume fraction increases — the jamming transition. It has been suggested that this transition is a critical phenomenon with universal critical exponents Liu_Nagel and the successful scaling of rheology data from simulations is strong evidence that that actually is the case Olsson_Teitel:jamming ; Hatano:2008 ; Otsuki_Hayakawa:2009b . The precise values of the critical exponents, however, continue to be a matter of discussionTighe_WRvSvH .
At the very heart of critical phenomena is the notion of a correlation length that diverges as the critical point is approached. It is therefore important to identify the proper correlation length. Several works have tried to look for a growing order in the static quantities, but without much success. Another possibility is to look for a growing length in the dynamics. Velocity correlations in sheared systems were studied in LABEL:Ono_Tewari_Langer_Liu though not revealing any growing length. A large correlation length was however found in LABEL:Lois_Lemaitre_Carlson and they also argued for a pronounced angular dependence of the velocity correlations Majmudar_Behringer:2005 .
In a previous work we reported the finding of a growing characteristic length from the transverse component of the velocity correlation function Olsson_Teitel:jamming . The extraction of the correlation length exponent, however, seems to be more complicated than presented there and we therefore set out to do a more thorough analysis of the velocity correlations. As an important step in that direction we here consider some symmetry properties of velocity correlations in a sheared system and find a surprisingly rich and interesting behavior
When shearing simulations are done slowly enough it becomes possible to separate the time evolution into elastic parts where the energy slowly increases and plastic contributions which are irreversible processes where the system rapidly evolves and dissipates energy Maloney_Lemaitre:2004 . We will argue below that the contribution from the plastic processes also may be seen in the velocity correlation function.
The content of the present paper is the following: In Sec. II we briefly describe the model and the simulations. Sec. III describes some rather direct measures of velocity correlations and how they depend on the direction of the separation between the particles whereas Sec. IV deals with a more involved correlation function designed to capture the difference between clockwise and counter-clockwise rotations of the velocity field. A summary and some concluding remarks are given in Sec. V.
II Model, simulations, and measured quantities
II.1 Shearing dynamics
Following O’Hern et al. OHern_Silbert_Liu_Nagel:2003 we simulate frictionless soft disks in two dimensions using a bi-dispersive mixture with equal numbers of disks with two different radii of ratio 1.4. Length is measured in units of the small particles (). With for the distance between the centers of two particles and the sum of their radii, the interaction between overlapping particles is
We use Lees-Edwards boundary conditions Evans_Morriss to introduce a time-dependent shear strain . With periodic boundary conditions on the coordinates and in an system, the position of particle in a box with strain is defined as which thus gives a shear flow in the direction. We simulate overdamped dynamics at zero temperature with the equation of motion Durian:1995 ,
which is integrated with the second order Heuns’ method.
This above expression is for the total velocity, including the shearing part. In the analyzes of the velocity correlations below we will use the non-affine part of the velocity excluding the trivial shearing part . This non-affine part of the velocity will be denoted by .
Our simulations are performed with with shear rates down to . The averages are typically from simulations during 1–3 days and nights with 128 cores on a massively parallel computer.
III Velocity correlations
III.1 Symmetry of a shearing system
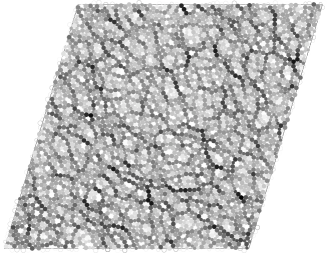
Figure 1 shows the presence of force chains in our system. The figure is a configuration with 4096 particles, color coded according to the elastic energy of each particle. Note that the force chainsMajmudar_Behringer:2005 tend to be along the direction, which is the direction of compression. This means that the force chains break the reflection symmetry along and that the system is only symmetric under the combined transformation and . The same conclusion is readily drawn from the expression for the shear stress,
where is the linear system size, the sum is over pairs of particles, is the -component of the force between particles and , and is the -component of their separation. Note that the shear stress changes sign under the transformation but remains unchanged under the combined transformation and .
III.2 Single particle properties
As we will see below several symmetries that hold in systems at equilibrium are broken in a shearing system. The simplest symmetry is however respected; there is no net velocity in the system, . As remarked above, is the non-affine part of the velocity. Here and in the following represents the average over all particles and a large number of configurations generated with our shearing dynamics. For the average velocity things are unusually simple since the same result holds for each individual configuration as a consequence of the overdamped dynamics and total force balance, as .
The conclusion of a vanishing average velocity may also be reached from the symmetry considerations. Since the combined transformation also implies the change of sign of both velocity components, and , it follows that , for , which gives .
In contrast to equilibrium results from symmetry that , one finds that this quantity does not vanish in the sheared system. Fig. 2 shows against . At low densities the correlation is negative which means that the particles tend to move more along than perpendicular to the force chains. The correlation changes sign at , reaches a peak at and then decrease towards zero. This means that there is a region around where the particles move slightly more in the direction perpendicular to the force chains.
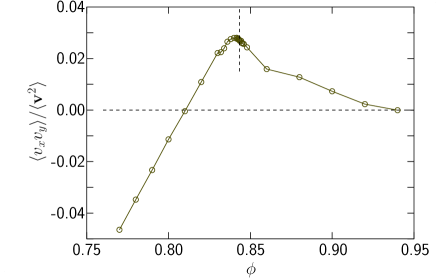
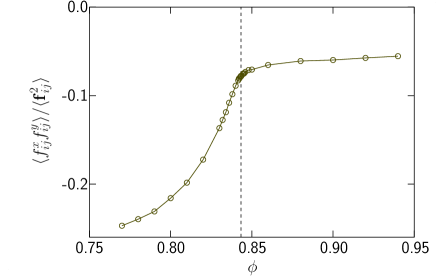
A related quantity is which is the correlation between the different components of the contact force . Note that there is a direct relation between the velocities and the contact forces: , where the sum extends over all particles in contact with . Nevertheless, behaves rather differently from the velocity correlations. Whereas has a peak at , Fig. 2(b) shows that the normalized changes at the same density from a rapid increase (which is a decrease in magnitude) to being almost constant.
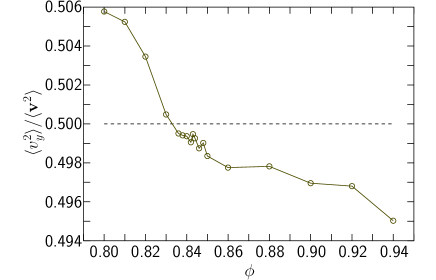
Another measure of the asymmetry is the relative magnitude of the two velocity components. From energy balance—that the dissipated power has to be equal to the supplied power—follows the result for the velocity squared: Ono_Tewari_Langer_Liu . This dissipated power needs however not be equal in the and directions. Fig. 3 shows that the fraction of the power dissipated by velocities along the direction is close to 50%, but also that there is a clear dependence on density: decreases from 0.506 to 0.495 when the density increases from to 0.94.
III.3 Spatial dependence
We now turn to the spatial velocity correlations, i.e. the correlations between pairs of particles with separation . We first focus on the total correlation function,
| (1) |
and examine how it depends on both magnitude and direction of . We will study this correlation function in four different directions: along the two main directions, , , and along the diagonals
In our shearing geometry is the direction of uniaxial compression and the direction of uniaxial dilation.
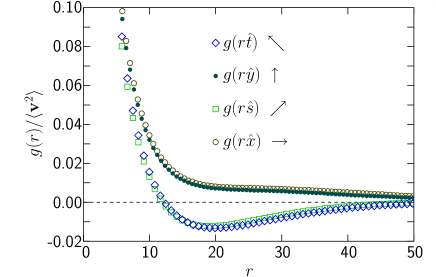
Figure 4 shows the correlation functions along these four different directions. The curves are pairwise equal with, on the one hand, the correlations along the main directions, and , and on the other hand the correlations along the diagonals. These results should be essentially without finite size effects since the system size is whereas only extends up to . In view of the density dependence in Figs. 2 and 3 we have confirmed that the general behavior remains the same for a wide range of densities around .
The result that behaves the same along both diagonals is different from the earlier finding of an angular dependence of the correlation length in shearing systems Lois_Lemaitre_Carlson with minimum and maximum along the different diagonals. The reason for this difference is not clear, but we speculate that it is related to the very different dynamics in their system, which is also reflected in the oscillatory behavior of their velocity correlation function.
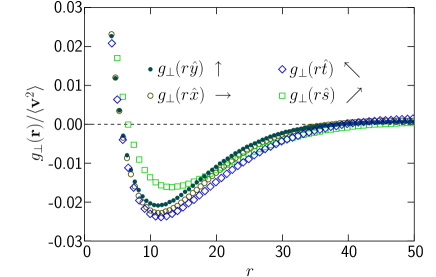
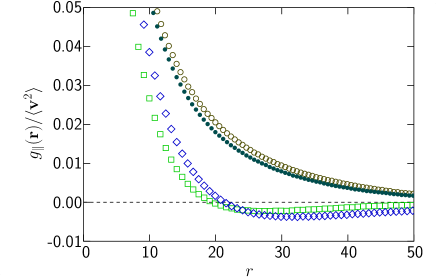
To investigate the reason for the dependence of on the direction of , we separate the correlations into longitudinal and transverse components, parallel and perpendicular to the separation, respectively. In the direction these components are
with obvious generalizations to the other directions. After this separation we find that the transverse component along these four different directions behave about the same, see Fig. 5(a). (The rather small differences in the transverse component for the two diagonal directions will be discussed further below.) The difference is largely due to the decay of the longitudinal component, see Fig. 5(b) which is monotonic along the main ( and ) directions but non-monotonic along the diagonals.
The result above is a different behavior along the diagonals compared to the main directions. We now instead focus on the difference between the two diagonal directions, and . From Fig. 4 we found that the total velocity correlations along these two directions are very similar. Nevertheless. as shown in Fig. 5 both and are clearly different. This suggests that this difference originates from the mixed correlations . To see this we use the definitions , and together with and for the velocities along the diagonals. This gives
where we have also made use of the symmetry which follows from considering the transformation , followed by a translation: .
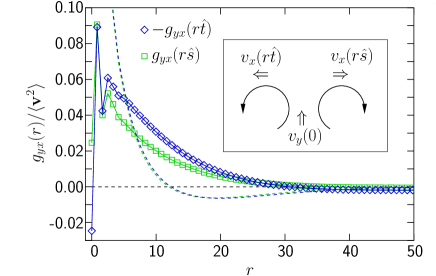
Figure 6 shows the mixed correlations along the two diagonal directions. The thick arrows in the inset illustrate the velocity fields one might expect as an effect of a particle with which is for separations in the direction and in the direction. Since we expect along , the correlations in that direction are shown with the opposite sign. Note that both functions start out at . The correlations then grow above this value and actually become stronger in the direction (though with opposite sign) than along . For a comparison, the dashed lines are the correlations of along the same directions. This difference between and is yet another example of a broken symmetry in the shearing system.
IV Rotational asymmetry
The previous section gave evidence for the importance of whirls in the velocity field. The inset of Fig. 6 shows two such whirls that are a consequence of , and there will also be whirls with the opposite orientation that will contribute to the correlation functions in much the same way. The question we now like to address is whether they contribute equally much or not. Is the system symmetric when considering whirls with clockwise and counter-clockwise rotations, respectively?
Since the shearing by itself introduces a rotational field, it could at first seem obvious that this symmetry is broken, but that is not correct. Our velocity correlations are calculated from the non-affine velocities and the net rotation is zero in the non-affine velocity field. The system could therefore in principle well be symmetric with respect to these different directions of rotation.
IV.1 Asymmetric correlations
There are at least two different ways to motivate the new correlation function that we are about to introduce. The first is to note that the direction of the rotational fields in the inset of Fig. 6 depend on the sign of . With the opposite sign of , and would also (typically) change sign and the rotations would be in the opposite directions.
A second point of departure is to consider the fact that the correlation function defined in Eq. (1) is symmetric under the transformation whereas the system itself is only symmetric under the interchange of both and . This suggests that some information is lost when calculating the standard correlation function and, furthermore, that a guiding principle in the definition of an ideal correlation function is that it should have the same symmetry as the system.
It is then possible to combine both these lines of thought and construct a function by restricting the average in Eq. (1) to only include terms with . For the transverse correlation function with along the direction, this becomes
| (2) |
This expression may further be generalized to including particles with both signs of by letting the direction of the separation ( or ) depend on the sign of the velocity,
| (3) |
The normalization is the number of terms in the sum. Written this way it becomes clear that indeed has the desired symmetry properties. The rational for this new asymmetric function is also discussed in conjunction with Fig. 11 below. Note also that the symmetric function is related to through
The quantities shown in the figures below (both symmetric and asymmetric) are, , normalized such that .
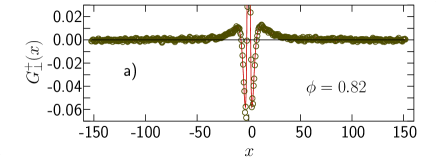
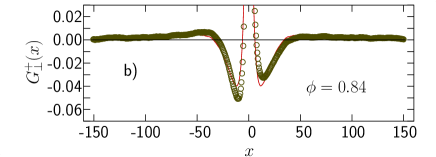
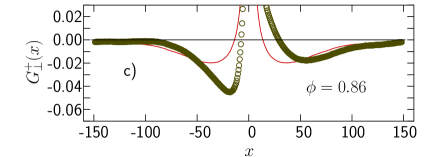
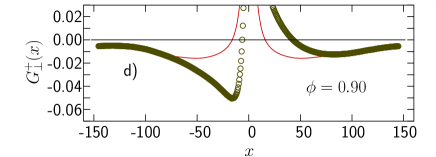
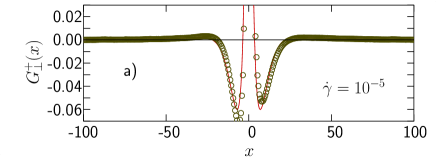
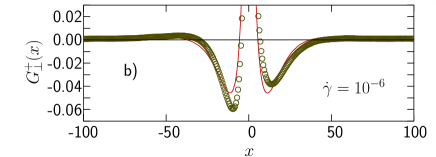
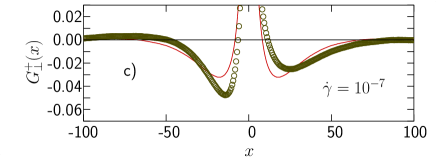
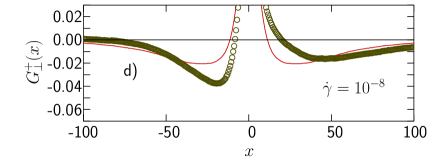
Figure 7 shows at four different densities both above and below , again from simulations with . For comparison, the symmetrized function is given by the solid line. At , panel (a), is almost symmetric. The other panels show that the asymmetry grows with increasing , and at well above , panel (d), the asymmetry is very pronounced. The part shows a sharp dip at whereas the part has a rather shallow minimum at .
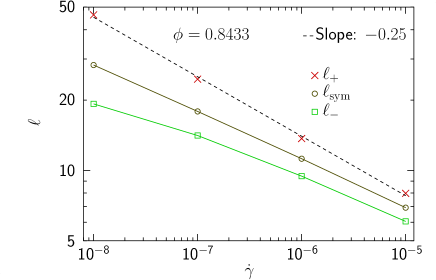
Another way to illustrate the growth of the asymmetry is through the position of the minima. Fig. 8 shows and , the absolute value of the position of the minima for and , respectively, together with from the minimum of the symmetrized function. The asymmetry grows rapidly above and the behavior of and turn out to be very different at higher densities; continues to increase whereas reaches a maximum at and then decreases slowly.
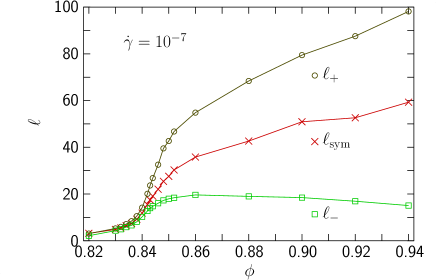
Fig. 9 is the same quantity obtained at Heussinger_Barrat:2009 with different shear rates. It is here found that the asymmetry grows with decreasing shear rate. The algebraic increase of , which suggest a divergence in the limit of vanishing shear rate, is clear from Fig. 10 whereas both and grow less rapidly.
IV.2 Origin of the rotational asymmetry
We now turn to the question of the origin of the asymmetry in and will argue that it is linked to the plastic processes. The reason for this is the manifest asymmetry of the velocity profile of an elementary plastic event, as shown in the inset of Fig. 11 Maloney_Lemaitre:2004 . Note that the orientation of this velocity profile with its quadrupolar structure is dictated by the direction of the shear. The velocity field corresponds to a compression along the direction together with an expansion in the orthogonal directions, which is equivalent to a simple shear. This implies that the mirror version of such an event is expected to be much less common, if at all present, and it is this effect that causes the asymmetry. Note that this agrees well with the enhanced anti-correlation at . When a particle has due to a plastic event one would expect that there should be one or more other particles with , and the inset of Fig. 11 shows that they should be found in the direction.
To further check this idea we have tried to separate the contribution to the correlation function from the plastic events from the rest, i.e. we have calculated separately for increasing and decreasing total energy Ono_Tewari_Langer_Liu , respectively. That study, which was done for particles, did indeed give evidence (not shown) that the part related to a decrease in total energy was the more asymmetric one. However, since the total energy is a global quantity that kind of analysis isn’t a very sensitive one, at least not at finite shear rates. In a large system one would expect some regions to be characterized by plastic events and a local decrease in energy whereas the motion in other regions is elastic, but we still have to classify the whole system as either plastic or elastic.
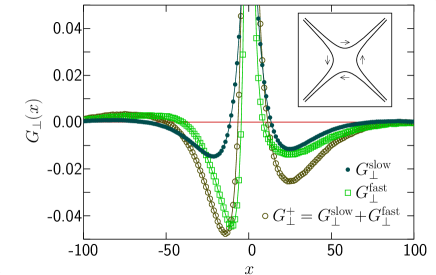
Instead of splitting up the contributions based on the change in the total energy we now consider the change in the local energy. That is done by classifying each term in Eq. (3) as “fast” or “slow”, corresponding to plastic and elastic respectively. Since the change in total energy is Ono_Tewari_Langer_Liu , the change in the local energy is related to the average in a certain region. On the average, one expects the energy to decrease locally if . As a reasonable and more sensitive way to split into two different contributions, (we drop the “+” in the “slow” and “fast” terms to simplify the notation) we therefore classify each of the terms in Eq. (3) according to the magnitude of the velocities. If both and are “slow”, (i.e. they both obey ), the term contributes to whereas it contributes to otherwise, i.e. if at least one of the particles is “fast”.
Figure 11 shows the splitting of the total (open circles) into slow and fast parts, respectively. Note that the contribution from the slow particles (solid dots) is almost symmetric whereas there is a very pronounced asymmetry from the fast particles (open squares). This is therefore evidence that the asymmetry is caused by the fast particles and that this typically is related to a local drop in energy which is often related to a plastic event.
V Summary
To summarize, we have examined velocity correlations in a sheared system with emphasis on the breaking of symmetries due to the shearing. We first find that for individual particles and that this correlation depends strongly on density. At low densities the particle motion is preferably along the force chains whereas it is preferably perpendicular to the force chains around . We then examine how the total velocity correlation depends on the direction of . Rather surprisingly the correlation along the two diagonals, corresponding to the direction of compression and dilation respectively, are almost identical. The decay along the diagonals is non-monotonic, in contrast to the monotonic decay along the main ( and ) directions.
We then argue that the usual correlation functions are more symmetric than the system itself and define a less symmetric velocity correlation function that also may be used to probe the differences between clockwise and counter-clockwise rotations. This function is asymmetric with respect to , and this is an asymmetry that increases rather dramatically when either the density increases above or the shear rate decreases at fixed . We attribute the asymmetry to elementary plastic events with quadrupolar symmetry and their orientation dictated by the direction of the shear as shown in the inset of Fig. 11.
I thank S. Teitel for helpful discussions and critical reading of an earlier version of the manuscript. This work was supported by the Swedish Research Council and the Swedish National Infrastructure for Computing.
References
- (1) A. J. Liu and S. R. Nagel, Nature (London) 396, 21 (1998)
- (2) P. Olsson and S. Teitel, Phys. Rev. Lett. 99, 178001 (2007)
- (3) T. Hatano, J. Phys. Soc. Jpn. 77, 123002 (2008)
- (4) M. Otsuki and H. Hayakawa, Phys. Rev. E 80, 011308 (Jul 2009)
- (5) B. P. Tighe, E. Woldhuis, J. J. Remmers, W. van Saarloos, and M. van Hecke, “Model for the scaling of stresses and fluctuations in flows near jamming,” (2010), arXiv:1003.1268
- (6) I. K. Ono, S. Tewari, S. A. Langer, and A. J. Liu, Phys. Rev. E 67, 061503 (2003)
- (7) G. Lois, A. Lemaître, and J. M. Carlson, Phys. Rev. E 76, 021302 (2007)
- (8) T. S. Majmudar and R. P. Behringer, Nature 453, 1079 (2005)
- (9) C. Maloney and A. Lemaître, Phys. Rev. Lett. 93, 016001 (2004)
- (10) C. S. O’Hern, L. E. Silbert, A. J. Liu, and S. R. Nagel, Phys. Rev. E 68, 011306 (2003)
- (11) D. J. Evans and G. P. Morriss, Statistical Mechanics of Nonequilibrium Liquids (Academic Press, London, 1990)
- (12) D. J. Durian, Phys. Rev. Lett. 75, 4780 (Dec 1995)
- (13) C. Heussinger and J.-L. Barrat, Phys. Rev. Lett. 102, 218303 (May 2009)