The central region of spiral galaxies as seen by Herschel††thanks: Herschel is an ESA space observatory with science instruments provided by European-led Principal Investigator consortia and with significant participation from NASA.
With appropriate spatial resolution, images of spiral galaxies in thermal infrared (10 m and beyond) often reveal a bright central component, distinct from the stellar bulge, superimposed on a disk with prominent spiral arms. ISO and Spitzer studies have shown that much of the scatter in the mid-infrared colors of spiral galaxies is related to changes in the relative importance of these two components, rather than to other modifications, such as the morphological type or star formation rate, that affect the properties of the galaxy as a whole. With the Herschel imaging capability from 70 to 500 m, we revisit this two-component approach at longer wavelengths, to see if it still provides a working description of the brightness distribution of galaxies, and to determine its implications on the interpretation of global far-infrared properties of galaxies.
We quantify the luminosity of the central component by both a decomposition of the radial surface brightness profile and a direct extraction in 2D. We find the central component contribution is variable within the three galaxies in our sample, possibly connected more directly to the presence of a bar than to the morphological type. The central component’s relative contribution is at its maximum in the mid-infrared range and drops around 160 m to reach a constant value beyond 200 m. The central component contains a greater fraction of hot dust than the disk component, and while the colors of the central components are scattered, colors of the disk components are more homogenous from one galaxy to the next.
Key Words.:
Infrared: galaxies – Submillimeter: galaxies – Galaxies: spiral – Galaxies: nuclei – Galaxies: fundamental parameters1 Introduction
The central region of spiral galaxies hosts a number of processes that have little or no counterpart in the disks. A nuclear starburst, triggered by bar instabilities and associated or not with an active galactic nucleus (AGN) can often be found. The stellar density is also enhanced with respect to the disk, leading to an increase in the interstellar radiation field (ISRF) intensity. It is thus no surprise that in the mid-infrared (MIR), spiral galaxies can often be seen as the sum of a central component, hereafter referred to as the core component as distinct from the bulge, and a disk component (see e.g. Bendo et al., 2007). Extraction of the core component from MIR brightness profiles have revealed that it can contribute up to 90% of the total MIR luminosity and that the distribution of core/total luminosity ratio is evenly spread between 0 and 1 (Roussel et al., 2001a). This study also showed that much of the scatter in the MIR global properties of spiral galaxies came from changes in the relative contribution of the core component and of its spectral energy distribution (SED), while disk components formed a much more homogenous group. In short, the scatter affecting the global MIR colors of galaxies is caused by a very local effect, i.e., the importance of the core component, rather than by a change in any single property of galaxies such as the ISRF throughout the disk. Taking this into account, Roussel et al. (2001b) showed that the MIR luminosity of galaxies could be turned into an accurate tracer of the star-formation rate, provided it was corrected for the core contribution. More recently, Chanial et al. (2007) extended this analysis by showing that the dispersion in the correlation between the infrared luminosity of galaxies and the dust temperature could be reduced by considering a compactness parameter, again related to the relative contribution of the core and disk components.
Care must therefore be taken when extrapolating locally established relations, such as the correlation of star-formation tracers in galactic disks, to global studies where galaxies are no longer resolved. One first needs to verify that the total luminosity of galaxies is indeed dominated by the component where these correlations have been established, or to design methods to correct for the existence of multiple contributors to the total luminosity. With its unprecedented sensitivity and spatial resolution, Herschel (Pilbratt et al., 2010) now allows us to carry this very investigation over the full thermal infrared peak, by combining the PACS instrument (Poglitsch et al., 2010), delivering spatial resolutions of , , and (FWHM) at 70, 100, and 160 m, and the SPIRE instrument (Griffin et al., 2010) delivering spatial resolutions of , , and (FWHM) in its three photometric bands at 250, 350, and 500 m.
2 The objects and data reduction methods
Galaxies studied here are part of the Herschel Reference Survey (Boselli et al., 2010), a SPIRE volume-limited imaging survey of 323 galaxies. Out of the 4 noninteracting spirals observed during the science demonstration phase, NGC 3683 and NGC 3982 are too small in apparent size for the present study, leaving M 99 and M 100 (see also Pohlen et al., 2010), to which we add M 81, which was observed as part of the Very Nearby Galaxies program (Bendo et al., 2010b). The properties of the objects that are relevant to this study are in Table 1.
Details of the SPIRE data reduction can be found in Pohlen et al. (2010) and Bendo et al. (2010b), while the PACS data reduction of M 81 is described in Bendo et al. (2010b). Photometric uncertainties are quoted at 15% for all SPIRE bands and at 10/20% for the PACS 70/160 m bands by the instrument teams. We also use Spitzer MIPS maps at 24, 70, and 160 m ( see Bendo et al., 2010a; Clements et al., 2010, for data reduction details). The SPIRE maps are calibrated in Jy/Beam, and we used a beam size of 9.28, 1.74, and 3.57 sr at 250, 350, and 500 m, respectively, to convert these into more conventional brightness units. The MIPS maps are calibrated in MJy/sr, and the PACS maps in Jy/pixel, with a pixel size of 14 and 285 for the 70 and 160 m bands.
| Name | Type | Nuca | (′) | available data |
|---|---|---|---|---|
| M 81 | SAab | Sy 1.5 | 26.92 | M(24, 70, 160 m), |
| P(70, 160 m), | ||||
| S(250, 350, 500 m) | ||||
| M 99 | SAc | HII | 5.37 | M(24, 70, 160 m) |
| S(250, 350, 500 m) | ||||
| M 100 | SABbc | T2 | 7.41 | M(24, 70, 160 m) |
| S(250, 350, 500 m) |
-
a
Nuclear classifications from Ho et al. (1997), T2 meaning a transition object between a starburst and a Sy 2.
3 Extraction of the core components
Our first approach uses radial surface brightness profiles measured inside concentric ellipses. For all maps of a given galaxy, we used the same parameters to build the integrating ellipses, namely the central coordinate, the ellipse axis ratio, and the position angle; i.e., these parameters are not fit to the data but obtained from NED111http://nedwww.ipac.caltech.edu/ .. This is a coarser approach than the one used by Pohlen et al. (2010), where the ellipse parameters are first fitted to the maps before the profile integration is made. A simpler approach is justified here since we are not searching for the most accurate structural description of the surface brightness distribution in galaxies, but rather for a method to systematically measure the contribution of the central region to the total galaxy luminosity. Errors in the computed average surface brightness are the quadratic sum of the error on the mean brightness, of the error derived by accounting for the corresponding error map on the same ellipses, and of the error on the background level. Generally, the total errors are much smaller than the computed brightness except close to the background. For all maps, we intentionally went significantly beyond the diameter. To obtain the galaxy’s brightness profile, we determined the background brightness as the mean of the brightness measured typically about 100 beyond the point where the galaxy emission ceased to be detected.
To search for and extract the core component, we obtained the best (in the least-square sense) combination of Gaussian or exponential functions that represent the measured radial profiles. Expressed in units of surface brightness as a function of radius, we fit the following function to the data:
| (1) |
with the central surface brightness, the scale length, for exponential or Gaussian functions222in the case of a Gaussian, we have FWHM., and 1 or 2. The fitting function was smoothed by the appropriate PSF, so the parameters we derived describe the intrinsic light distribution. It is important to recall that our aim is to build a robust and systematic method to get at the one parameter we are searching for: the relative contribution of the core component to the total flux, and not to achieve the best representation of the full profile.
The use of either Gaussian or exponential functions is a result of the fit, but that some of the disk profiles prefer a Gaussian to an exponential must not be overinterpreted because the presence of prominent spiral arms can create a distinctive bump in the disk part of the profile that is represented by a Gaussian better than by an exponential. In either case we did not use the fit parameters that describe the “disk” component in the rest of the analysis. The central component is almost always represented by a Gaussian profile very well, with the disk component also adequately fit at the location where the core profile merges into the disk profile (see Figure 1). We then decomposed the luminosity of the galaxies in the following way. The total luminosity was obtained by integrating the measured radial profile up to the background radius, the total luminosity of the core component was obtained by integrating the fitted profile of the core, and the disk luminosity is simply the difference between these two quantities. In Table 2 we list the core components’ scalelength and contribution to the total luminosity derived from the fits.
In a second approach, we performed 2D fitting on M81 (chosen because of the level of details available and the existence of a point-like component in the center), using the GALFIT code (Peng et al., 2002). Galactic structure (arms, bars, rings) is much more complex to represent mathematically in 2D, thus this method converges on the extraction of unresolved components. This provides a cross-check to the radial profile approach since, when the central component is resolved in the profile, the 2D method should underestimate it, but both methods should agree when it is unresolved. This is what we observe (see below).
| M 81 | M 100 | |||||
| Band | (′′) | Fit | (′′) | Fit | ||
| (1) | (2) | (3) | (4) | (5) | (6) | (7) |
| M 24 m | 7.2 | E+E | 8.8 | 10.3 | G+G | 20.1 |
| M 70 m | 38.8 | G+G | 6.2 | 13.2 | G+G | 12.2 |
| P 70 m | 27.9 | G+G | 6.3 | n.a. | ||
| M 160 m | 28.5 | G+G | 0.3 | 5.14 | G+G | 3.5 |
| P 160 m | 26.4 | G+G | 1.2 | n.a. | ||
| S 250 m | 25.2 | G+G | 0.3 | 9.5 | G+G | 7.8 |
| S 350 m | 10.2 | G+G | 0.2 | 5.4 | G+G | 7.4 |
| S 500 m | 11.8 | G+G | 0.2 | 6.5 | G+G | 7.6 |
-
Notes.– For M 99, the profile fit revealed no central component except at 24 m so we report this in the text. In column (1), M, P and S are MIPS, PACS and SPIRE, respectively, (2) and (5) the core component scale-length in arcseconds, (3) and (6) the best fit functions, E for exponential and G for Gaussian, and (4) and (7) the core component contribution to the total flux in %, respectively for M 81 and M 100. Relative uncertainties on the scale parameters are typically of , while on the core fractions these are typically
4 Discussion
In general, we observe that the same family of functions provides the best-fit models to a given galaxy, regardless of the wavelength. This is mostly because the same morphological features dominate the profile of galaxies over the explored spectral domain, a fact worth noting given the quite drastic changes in the thermodynamical state and physical nature of the mid to far IR-emitting grains, from out-of-equilibrium, nearly molecular-sized grains to thermalized sub-micron grains (but see Pohlen et al., 2010, for a discussion of the full profiles properties). However, the profiles already show that the relative importance of the core component is variable from one galaxy to the next (see Figure 1).
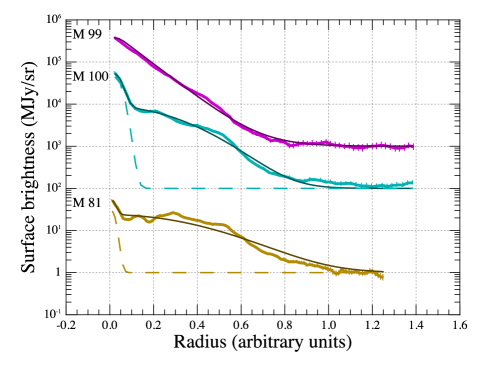
M 81 - This is the closest galaxy and thus its central region is observable with a high level of detail (see Bendo et al., 2010b). The core is compact, possibly the IR counterpart of the Seyfert nucleus, on which a bright arc, presumably the start of one of the spiral arms, connects. Moving away from the center, the brightness of the arm diminishes until it increases again to form a bright, almost ring-like structure. Thus all profiles, except the 24 m one, show a first local minimum at radius (1.4 kpc at 3.65 Mpc). With high enough resolution, the double nature of the core component (central unresolved source and spiral arm) is visible in the profile as a break in the slope of the core profile. The interplay between the resolved and unresolved parts of the core is clear in the comparison of the GALFIT and profile-fitting core-fraction estimates: as the former preferentially extracts the unresolved component, while the latter is able to extract both the unresolved and resolved components as a single structure departing from the disk, we expect both methods to agree, for a given band, when either the unresolved source is dominant or the whole core structure is unresolved. This is indeed observed for MIPS 24 m (where the unresolved component dominates) and for MIPS 160, SPIRE 350, and 500 m (where the whole core structure is not, or barely, resolved). In the other bands, the unresolved component is less dominant, and GALFIT computes core fractions that are a factor of 3 below those coming from the profile fitting. However, inspection of the corresponding images clearly shows the unresolved component sitting on a core structure distinct in brightness from the disk. The core contribution derived with the profile fitting method is also very compatible with what can be measured naively from the profile itself, inside the 80′′ radius. The core component is generally well represented by Gaussians and, when resolved, the derived scalelengths are compatible with one another, given typical uncertainties of 10%. We note a severe disagreement between the two 160 m core fraction measurements, but inspection of the profiles clearly shows that this stems from dilution of the barely resolved central component in the disk emission at the low resolution of Spitzer, thereby pointing to the intrinsic limitations of the MIPS 160 m band as the way to perform these decomposition studies. At increasing SPIRE wavelengths, we observe as well that the central component becomes gradually unresolved.
M 99 - Although this galaxy clearly shows a bright center and spiral arms in all available IR bands (see Pohlen et al., 2010), our fit of the profiles is usually adequate with a single exponential function; however: (1) an exponential does not accurately represent the disk profile that has a distinct break (at in Figure 1, see Pohlen et al., 2010, for a discussion of this feature), and (2) the 24 m image is sharp enough to reveal a barely resolved Gaussian component in the center () contributing less than 0.5% of the total 24 m flux.
M 100 - The barred nature of the galaxy clearly shows up as a bump in the high-resolution profiles (e.g. 24 m and 250 m, see also Pohlen et al., 2010), and as a result, the fitting function favors a double Gaussian profile, with very good fits of the central component achieved from 24 m to 500 m. Table 2, however, shows the central component is unresolved at 160, 350, and 500 m, while for the other wavelengths a scale-length of is indicated by the fits. When the central component is unresolved, our capacity to accurately measure its contribution will depend on how bright it is compared to the disk component. Thus it is possible that the core fraction we compute at 160 m (the band with the worst resolution) is in fact a lower limit to the actual core fraction, pointing again to the limited ability of the MIPS 160 m band to accurately measure core contributions.
The necessity to account for a core component to represent the surface brightness profile already appears weakly related to the morphological type: it is on the intermediate type galaxy M 100 that we observe the largest core fraction. It is quite tempting, and probably logical, to relate that to the presence of a weak bar in M 100, but this can only be asserted on a reasonable sample, as the presence of a bar does not guarantee there is a strong MIR core component (Roussel et al., 2001a).
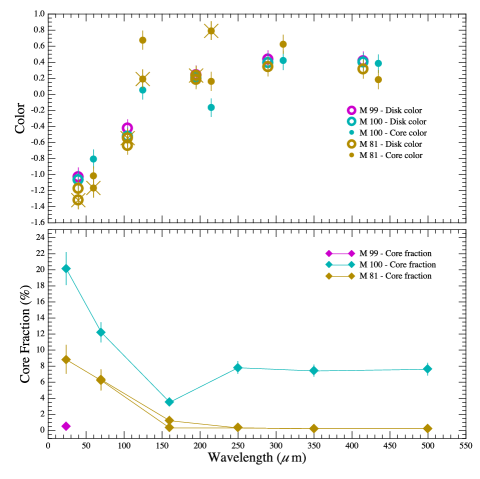
Interestingly, even though M 81 and M 100 have significantly different core fractions (by a factors 2), we observe in Figure 2 the same trend in the evolution of this fraction with wavelength: it is maximum at the shorter wavelengths and nearly constant beyond 200 m, with the transition occurring in the 70-200 m range. The evolution of the core fraction can be interpreted by inspecting the component’s colors. We show in Figure 2 the colors of the core and disk components built from neighboring bands. This figure first shows quite clearly that all the disk colors are very similar for the three galaxies studied here, even when the core component represents a substantial fraction of the emission (10-20% at ). It also shows that only the [70]/[160]333shorthand for . core colors, and to a lesser extent [160]/[250], significantly differ from the disk colors. The [70]/[160] core colors are systematically higher than those of disks, showing the core emission as coming from hotter dust than the disk emission. If the dust is hotter in the core than in the disk, then it will represent a larger fraction of the emission at shorter wavelengths. In the SPIRE range, we reach the Rayleigh-Jeans regime, where colors have no dependence on temperature. That color differences are more prominent in the 70-250 m range is simply because this is where the peak of the thermal emission of dust in galaxies occur, showing that this range is key to properly understanding the infrared emission of galaxies.
To reconcile the small [24]/[70] color variation between disks and cores with the larger core fractions at 24 m, we suggest that it is because the 24 m and some of the 70 m emission come from transiently heated grains, i.e., show little spectral variation with the ISRF intensity or hardness. A harder ISRF in the core could then explain the larger core fractions observed at 24 m by boosting the emission from transiently heated grains without significantly affecting their emission spectrum. The small AGN in M 81 is a natural explanation for this, as is a possible bar-driven starburst in the center of M 100. We also tested an alternative explanation in M81, namely a direct contribution of bulge stars in the 24 m band, as suggested by Bendo et al. (2008), by correcting the MIPS image using IRAC data (a correction to the total flux of ). The “dust-only” core fraction is almost unchanged, revealing that bulge stars are not responsible for the FIR core structure.
5 Conclusions
In this small set of galaxies, the core fractions are small (), therefore the correction to the full SED of the galaxies introduced by accounting for the different core properties would be minimum. Nevertheless we already observe both a significant variation in the core component contribution from one galaxy to the next and a systematic decrease with wavelength. We also find that the galactic disks studied here show remarkable color homogeneity over the 24-500 m range, while the core components are notably hotter as shown by their higher [70]/[160] color value. This opens the possibilities that (i) across the Herschel wavelength range, the global SED of a galaxy may be influenced as much by the relative importance of the core and disk components as by a global property, such as the star formation rate or the morphological type, and (ii) that this may depend on the observed wavelength. We shall thus examine this in larger samples such as the HRS set of resolved spiral galaxies.
Acknowledgements.
SPIRE has been developed by a consortium of institutes led by Cardiff University (UK) and including Univ. Lethbridge (Canada); NAOC (China); CEA, OAMP (France); IFSI, Univ. Padua (Italy); IAC (Spain); Stockholm Observatory (Sweden); Imperial College London, RAL, UCL-MSSL, UKATC, Univ. Sussex (UK); and Caltech/JPL, IPAC, Univ. Colorado (USA). This development has been supported by national funding agencies: CSA (Canada); NAOC (China); CEA, CNES, CNRS (France); ASI (Italy); MCINN (Spain); Stockholm Observatory (Sweden); STFC (UK); and NASA (USA). PACS has been developed by a consortium of institutes led by MPE (Germany) and including UVIE (Austria); KUL, CSL, IMEC (Belgium); CEA, OAMP (France); MPIA (Germany); IFSI, OAP/AOT, OAA/CAISMI, LENS, SISSA (Italy); IAC (Spain). This development has been supported by the funding agencies BMVIT (Austria), ESA-PRODEX (Belgium), CEA/CNES (France), DLR (Germany), ASI (Italy), and CICT/MCT (Spain). This research has made use of HIPE, a joint development by the Herschel Science Ground Segment Consortium, consisting of ESA, the NASA Herschel Science Center, and the HIFI, PACS and SPIRE consortia, and of the NASA/IPAC Extragalactic Database (NED) which is operated by the Jet Propulsion Laboratory, Caltech, under contract with NASA.References
- Boselli et al. (2010) Boselli, A., Eales, S., Cortese, L., Bendo, G., Chanial, P., et al. 2010, PASP 122, 261
- Bendo et al. (2007) Bendo, G., Calzetti, D., Engelbracht, C. W., Kennicutt, R. C., Meyer, M. J. et al. 2007, MNRAS 380, 1313
- Bendo et al. (2008) Bendo, G., Draine, B.T., Engelbracht, C. W., Helou, G., Thornley, M. D. et al. 2008, MNRAS 389, 629
- Bendo et al. (2010a) Bendo, G. J., Wilson, C. D., Warren, B. E., Brinks, E., Butner, H. M. et al. 2010a, MNRAS 402, 1409
- Bendo et al. (2010b) Bendo, G. et al. 2010b, this issue
- Chanial et al. (2007) Chanial, P., Flores, H., Guiderdoni, B., Elbaz, D. Hammer, F. et al. 2007, A&A 462, 81
- Clements et al. (2010) Clements et al. 2010, submitted
- Griffin et al. (2010) Griffin, M. et al. 2010, this issue
- Ho et al. (1997) Ho, L. C., Filipenko, A. V., Sargent, W. L. W. 1997, ApJ 112, 315
- Peng et al. (2002) Peng, C. Y., Ho, L. C., Impey, C. D., Rix, H.-W. 2002, AJ 124, 266
- Pilbratt et al. (2010) Pilbratt, G. et al. 2010, this issue
- Poglitsch et al. (2010) Poglitsch, A. et al. 2010, this issue
- Pohlen et al. (2010) Pohlen, M. et al. 2010, this issue
- Roussel et al. (2001a) Roussel, H., Sauvage, M., Vigroux, L., Bosma, A., Bonoli, C. et al. 2001a, A&A 372, 406
- Roussel et al. (2001b) Roussel, H., Sauvage, M., Vigroux, L., Bosma, A. 2001b, A&A 372, 427