Optimal branching asymmetry of hydrodynamic pulsatile trees
Abstract
Most of the studies on optimal transport are done for steady state regime conditions. Yet, there exists numerous examples in living systems where supply tree networks have to deliver products in a limited time due to the pulsatile character of the flow. This is the case for mammals respiration for which air has to reach the gas exchange units before the start of expiration. We report here that introducing a systematic branching asymmetry allows to reduce the average delivery time of the products. It simultaneously increases its robustness against the unevitable variability of sizes related to morphogenesis. We then apply this approach to the human tracheobronchial tree. We show that in this case all extremities are supplied with fresh air, provided that the asymmetry is smaller than a critical threshold which happens to fit with the asymmetry measured in the human lung. This could indicate that the structure is adjusted at the maximum asymmetry level that allows to feed all terminal units with fresh air.
pacs:
87.18.Wx , 89.75.Da , 89.75.Fb , 89.75.HcBranched transportation networks are ubiquitous in living systems. Such trees have been suggested to allow efficient feeding the body volume from a small source, the aorta for blood or the mouth for oxygen Weibel (1963); West et al. (1997); Mauroy et al. (2004); Bernot et al. (2008); Mauroy and Bokov (2010); Dodds (2010); Corson (2010). For example, the human tracheobronchial tree brings fresh air to the oxygen-blood exchange units, called the acini, that fill the majority of the volume of the thoracic cage Weibel (1963).
In the general perspective of how statistical physics may help to better understand the relation between structure and physiological function, we focus here on pulsatile trees in which the delivery of products has to be achieved in a limited time. For example in mammals respiration, the respiratory cycle is made on two successive steps, inspiration and expiration. The period of this cycle is about 5 seconds for humans at rest (2 s for inspiration, 3 s for expiration). And of course, the transit time from the mouth to the acini has to be short enough so that expiration does not start before the arrival of fresh air into the acini. The present work analyses the possible statistical constraints related to this last condition.
From the point of view of ventilation, the conducting airway system can be modelled as an arrangement of pipes defined by their diameter and length. The branchings are essentially dichotomous, each airway being divided into two smaller daughter airways. A branching defines the beginning of a new generation. The tracheobronchial tree starts at the trachea (generation 0) and ends in the terminal bronchioles (around generation 15) at the entrance of the acini Weibel (1963). Since no gas exchanges take place in the tracheobronchial tree, its volume is referred to as the dead space volume (DSV). Its value is around 170 mL in the human lung Weibel (1984). To better understand human respiration in relation with the tree structure, we discuss successively the general properties of two models, respectively symmetric and asymmetric, before discussing the real human airway system.
The first model has symmetrical branching. Although the human airway system is both non symmetric and exhibits some type of randomness, a basic step in describing its morphology has been the introduction of the so called Weibel’s “A” model Weibel (1963). In this first model, the tree is likened to a hierarchical network of cylindrical pipes with symmetrical branching and a uniform scaling ratio between the airway sizes of consecutive generations. This value corresponds to the classical Murray-Hess law Hess (1914); Murray (1926) for which the diameter of the mother branch and the diameters of both daughter branches and are linked by the relationship .
An important second step in modeling the human lung morphology has been the introduction from anatomical studies of a systematic asymmetry Horsfield et al. (1971); Raabe et al. (1976); Phillips and Kaye (1997); Majumdar et al. (2005). This is the second model studied in this paper. The branching asymmetry is characterized by two different scaling ratios, and Majumdar et al. (2005). Each parent airway gives rise to a larger daughter airway (the major airway) and a smaller daughter airway (the minor airway). Note that = 1 so that the asymmetric tree respects the above dissipation requirement. And so, the Weibel’s A model is the exact symmetrisation of the real asymmetric structure.
Those are the two models to be compared, including the possible role of a statistical noise associated to anatomical variability. Note that two different types of structural randomness can appear in these models: the first source of disorder, due to the systematic branching asymmetry, is found in the random succession of large and small airways along any given airway path. The second type of disorder (the variability) results from the statistical noise of the biological growth process Weibel (1984) and spreads the distribution of the branch sizes at a given generation even in the symmetric model.
The criterion that will be used in the following to quantify the delivery performance of the tree is the distribution of oxygenation times of fresh air into the acini. The oxygenation time in one acinus is obtained by substracting from the total duration of the inspiratory phase, , the time spent in the extrathoracic airways, (approximately constant and equal to 0.47 s at rest Sandeau et al. (2010)), and the transit time from the trachea to this acinus, :
The performances of symmetric and of asymmetric trees have been computed on 15 generations trees. The geometrical parameters used in our computations, are summarized in Table 1. These are the scaling ratios at each generation and the length to diameter ratio for each generation. It has to be noted that the values of the dead space volumes are kept almost similar. Due to the uniform motion of the thoracic cage, each acinus is assumed to act as an hydrodynamic pump draining the same flux. In other terms, the gas exchange units are equitably ventilated Weibel et al. (2005). As a consequence, starting from the bottom of the tree, any two daughters of a given mother branch create, independently of their sizes, the same additive flux in their mother branch. The time spent in a branch is then directly obtained from the flux and the branch size. In the inspiratory phase studied here, the total flow can be considered approximately constant in time with a velocity in the trachea of about 1 m/s Weibel (1984). Since the duration of the inspiration and the time spent in the extrathoracic airways are the same for all acini, the oxygenation times in the acini are thus entirely determined by the transit times of fresh air from the trachea to the terminal bronchioles.
| Model | Scaling ratio for | Ratio 111D and L: diameter and length of the airway. | DSV (mL) |
|---|---|---|---|
| Symmetric | 3.00 | 220 | |
| Asymmetric | 3.00 | 213 | |
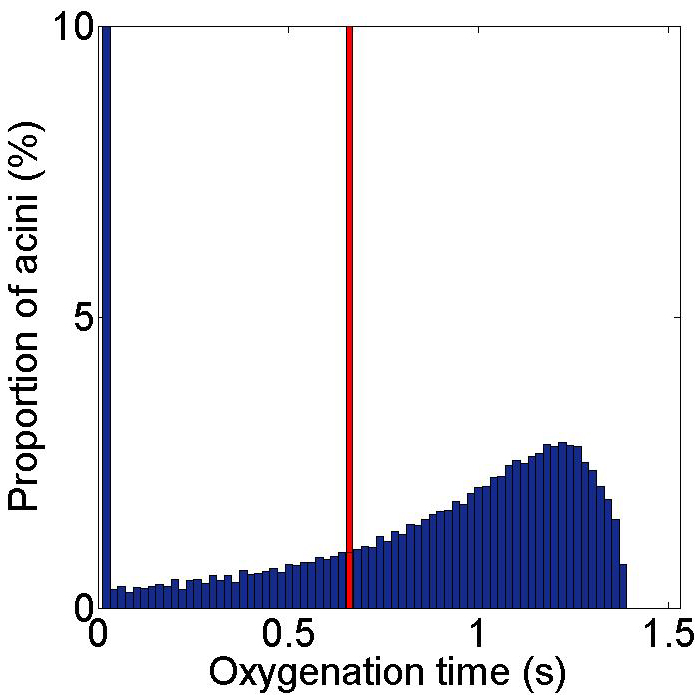
Fig. 1 shows the distribution of the acini oxygenation times for both models. The distribution for the symmetric tree trivially presents a single peak at s as all the pathways from trachea to a terminal bronchiole are identical. The distribution of oxygenation times for the asymmetric tree is spread around a mean value of 0.82 s and has a standard deviation of 0.43 s. Therefore, on average, fresh air arrives slighty sooner and remains longer in acini supplied by an asymmetric tracheobronchial tree than by a symmetric one. (Such an asymmetric tree structure can be described as multifractal Zamir (2001)).
We now study how the performances of these tree structures are robust or not with respect to anatomical variability. To mimic this variability, we introduce a “growth noise” by adding Gaussian variations of the scaling ratios. At each branching, the values of the scaling ratios are modified to become random variables:
| (1) |
being a centered gaussian random variable of standard deviation 1. The mean values and of these random variables correspond to the values given in table 1. Scaling ratios of different bifurcations are assumed to be independent random variables while in the same branching, scaling ratios and are anticorrelated. This means that if the random variable for take a larger (resp. smaller) value than its mean value, then is very likely to take a smaller (resp. larger) value than its mean value.
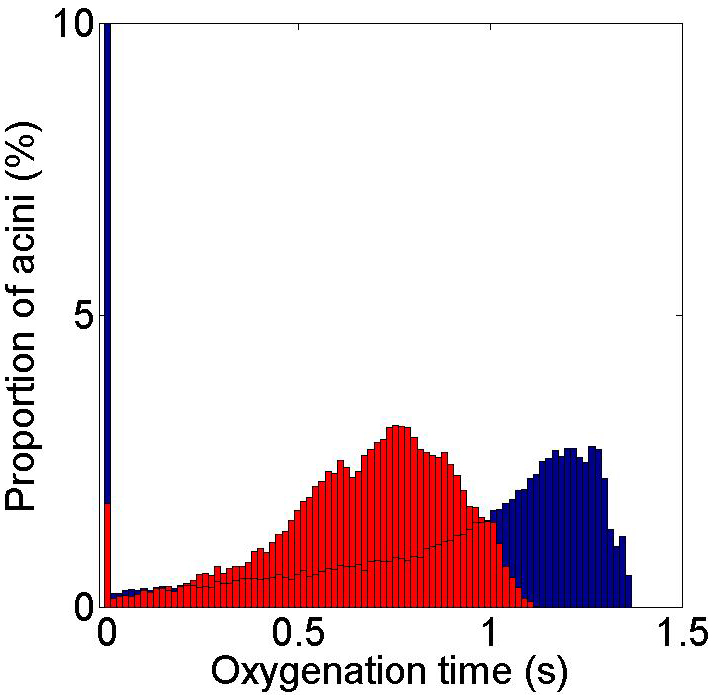
The results are shown in Fig. 2 which displays the distributions of oxygenation times for both symmetric and asymmetric trees with randomized scaling ratios (). The distribution for the symmetric tree is now also spread, with an average oxygenation time of 0.67 s and a standard deviation of 0.28 s. Unlike the symmetric case, the distribution of times in the asymmetric model is not modified by the randomization of the scaling ratios (mean value of 0.82 s and standard deviation of 0.44 s). The delivery of products through a dichotomous tree of constant depth thus appears to be more efficient both for average oxygenation time and immunity versus growth fluctuations.
So far, the two model trees that we have considered had an equal number of generations for all pathways. In fact, the real human tracheobronchial tree is even more complex because not only the branchings are asymmetric but also the number of generations is not uniform Horsfield et al. (1971); Raabe et al. (1976). The human tracheobronchial tree does not end at a constant generation but at a constant airway diameter, that of the terminal bronchioles, around mm Weibel (1984); Weibel et al. (2005). The terminal generations of the tree range from 8 to 22 Horsfield et al. (1971) and the length of the first generations airways also exhibits specific features linked to anatomical constraints Weibel (1963); Raabe et al. (1976); Phillips and Kaye (1995). The diameter scaling ratios keep equal to and for all generations. The aspect ratios (length over diameter) are specific for the first 4 generations (respectively equal to 3.07, 1.75, 1.43, and 1.85) and equal to 3.00 for higher generations (generations 6 to 22). The distribution of oxygenation times for the real human tree (not shown here) is found to have an average oxygenation time of 0.67 s and a standard deviation of 0.13 s.
The asymmetry level, namely and , used in the above computations was considered as a given fact drawn from anatomical measurements. It is a natural question to ask for a reason of such values. For obvious reasons, the branching asymmetry cannot be too strong because it would lead to a structure with only very few wide pathways surrounded by a large number of much narrower pathways with large hydrodynamic resistances. Moreover, due to flux conservation, the wider pathways correspond to larger transit times. If the asymmetry level were too important, a number of extremities would not be supplied with fresh air because the transit time in their pathway would be too long. We will now investigate the influence of the asymmetry level on the acini oxygenation. The question that naturally arises is thus the following: how much asymmetry can there be? In other words, can one define an optimal asymmetry level?
In order to investigate this question, trees of different asymmetry levels have been studied. In this study, the asymmetry level is characterized by one parameter such that:
| (2) |
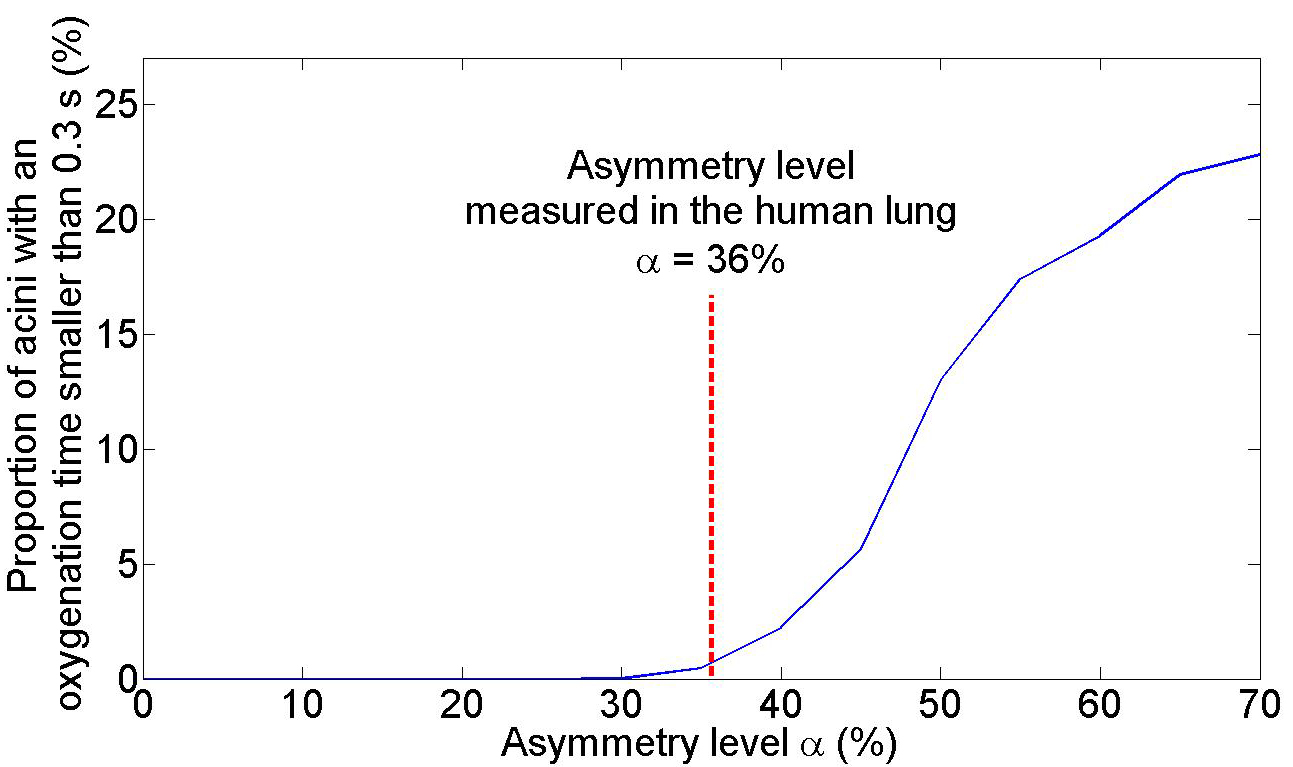
The scaling ratios 0.88 and 0.68 as measured in the human tracheobronchial tree would for instance correspond to an asymmetry level of 36% (). All computed trees are conditionned to have the same thoracic volume (dead space volume + acini volume) and the aspects ratios given above. Considering that fresh air has to remain at least 0.3 s in the acinar region in order to achieve the gas exchange process (a duration consistent with computations of the dynamical diffusion oxygen transport in the acinus Filoche et al. (2008)), we have computed for each asymmetry level the proportion of acini with an oxygenation time larger than 0.3 s. This corresponds to a total transit time from the mouth to the terminal bronchiole smaller than 1.7 s. Results are presented in Fig. 3. The proportion of acini fed with fresh air for more than 0.3 s is 100% for the symmetric tree (zero asymmetry level) and remains 100% until a threshold value of the asymmetry level. As one can see on Fig. 3, this threshold value is about 35%, almost identical to the value measured in the human tracheobronchial tree.
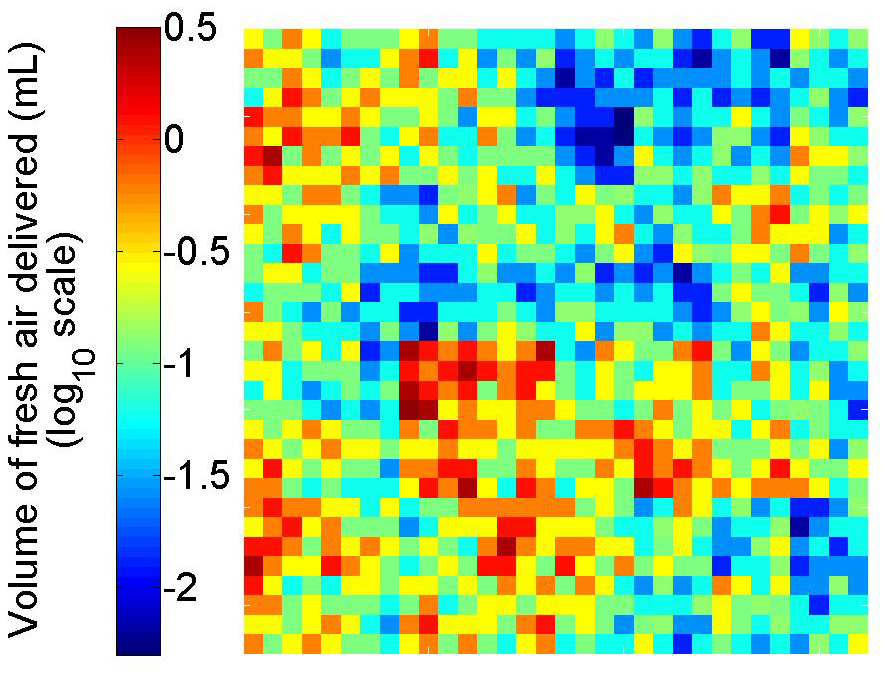
So it seems that the systematic asymmetry found in the tracheobronchial tree corresponds to the maximum value that allows to feed all acini. The advantages of such a structure are several: the number of acini with fresh air is 100%, and the distribution of the ventilated volumes is robust against anatomical variability. Note that the spread distribution of arrival times in the exchange units may contribute to smoothen the oxygen delivery to the blood. On the other hand, due to this spread distribution of transit times, all acini do not receive the same volume of fresh air. Even if all acini receive the same flux, the uneveness of branching creates an inhomogeneity of the volumes of supplied fresh air that multiplicatively increases at each generation. In the limit of an infinite tree, this would mathematically lead to a multifractal distribution of the volume of fresh air delivered in the extremities Sapoval (1997). This pre-multifractal behavior can be observed in Fig. 4 which shows a 2D representation of the distribution of volumes of fresh air delivered at generation 10. One observes a wide spread of the distribution of fresh air volumes. This could indicate that a dynamical regulation of airway diameters might be necessary to minimize such effects, as already suggested to fight inertial effects in the upper part of the airway tree Mauroy et al. (2003). Note that the spread in the distribution of external gas in the acini would also induce an inherent noise in NMR imaging of the lung.
In summary, numerical computations show that symmetric branching trees are not optimal to supply a volume when a constraint of limited delivery time is imposed. For trees of uniform depth, the average transit time is found to be smaller when the branching is asymmetric rather than symmetric. Moreover, the distribution of oxygenation times in the acini of the asymmetric tree is almost not modified by a stochastic variability of the sizes of the branches. This approach is then extended to the study of the role of variable asymmetry in trees, with the same trachea, the same ratio length over diameter, the same diameter of the terminal bronchioles and the same inner volume. It is shown then that there exists a maximum asymmetry level above which the number of terminal units, or acini, supplied with fresh air, departs from 100%. Interestingly, this maximum value corresponds almost exactly to the asymmetry level measured in the human lung. The geometry of the lung airways thus appears as if being adjusted to have the largest possible branching asymmetry, while still being able to feed efficiently all acini with fresh air. It may be considered as remarkable that an asymmetric tree works better and that the natural selection of mammalian seems to have found a level of asymmetry that can be considered as best from the physical point of view.
Acknowledgements.
The authors would like to thank Pr E.R. Weibel for fruitful discussions.References
- Weibel (1963) E. R. Weibel, Morphometry of the Human Lung (Springer-Verlag, Berlin Heidelberg / Academic Press, New York, 1963).
- West et al. (1997) G. B. West, J. H. Brown, and B. J. Enquist, Science 276, 122 (1997).
- Mauroy et al. (2004) B. Mauroy, M. Filoche, E. R. Weibel, and B. Sapoval, Nature 427, 633 (2004).
- Bernot et al. (2008) M. Bernot, V. Caselles, and J.-M. Morel, Optimal Transportation Networks: Models and Theory (Springer-Verlag, Berlin Heidelberg, 2008).
- Mauroy and Bokov (2010) B. Mauroy and P. Bokov, Phys. Biol. 7 (2010).
- Dodds (2010) P. S. Dodds, Phys. Rev. Lett. 104, 048702 (2010).
- Corson (2010) F. Corson, Phys. Rev. Lett. 104, 048703 (2010).
- Weibel (1984) E. R. Weibel, The Pathway for Oxygen, Structure and Function in the Mammalian Respiratory System (Harvard University Press, Cambridge, 1984).
- Hess (1914) W. R. Hess, Das Prinzip des kleinsten Kraftverbrauches im Dienste h modynamisher Forschung Archiv f r Anatomie und Physiologie (Physiologische Abteilung, 1914).
- Murray (1926) C. D. Murray, Proc. Natl. Acad. Sci. U.S.A. 12, 207 (1926).
- Horsfield et al. (1971) K. Horsfield, G. Dart, D. E. Olson, G. F. Filley, and G. Cumming, J. Appl. Physiol. 31, 207 (1971).
- Raabe et al. (1976) O. G. Raabe, H. C. Yeh, G. M. Schum, and R. F. Phalen, Tech. Rep. Publ. No. LF-53 (1976).
- Phillips and Kaye (1997) C. G. Phillips and S. R. Kaye, Resp. Physiol. 107, 85 (1997).
- Majumdar et al. (2005) A. Majumdar, A. M. Alencar, S. V. Buldyrev, Z. Hantos, K. R. Lutchen, H. E. Stanley, and B. Suki, Phys. Rev. Lett. 95 (2005).
- Sandeau et al. (2010) J. Sandeau, I. Katzb, R. Fodil, B. Louis, G. Apiou-Sbirlea, G. Caillibotte, and D. Isabey, J. Aero. Sci. 41, 281 (2010).
- Weibel et al. (2005) E. R. Weibel, B. Sapoval, and M. Filoche, Resp. Physiol. 148, 3 (2005).
- Zamir (2001) M. Zamir, J. Theor. Biol. 212, 183 (2001).
- Phillips and Kaye (1995) C. G. Phillips and S. R. Kaye, Resp. Physiol. 102, 303 (1995).
- Filoche et al. (2008) M. Filoche, A. A. Moreira, J. S. Andrade Jr., and B. Sapoval, Adv. Exp. Med. Biol. 605, 167 (2008).
- Sapoval (1997) B. Sapoval, Universalités et Fractales (Flammarion, Paris, 1997).
- Mauroy et al. (2003) B. Mauroy, M. Filoche, J. S. Andrade Jr., and B. Sapoval, Phys. Rev. Lett. 90 (2003).