11institutetext: Istituto di Fisica dello Spazio Interplanetario - INAF, via Fosso del Cavaliere 100, 00133 Rome
11email: davide.elia@ifsi-roma.inaf.it
22institutetext: Observatório Astronómico de Lisboa, Tapada da Ajuda, 1349-018 Lisboa, Portugal 33institutetext: Dipartimento di Scienze Fisiche, Università di Napoli “Federico II”, Naples, Italy 44institutetext: Harvard-Smithsonian Center for Astrophysics, 60 Garden Street, Cambridge, MA 02138, USA 55institutetext: Department of Physics, University of Arizona, 1118 E. 4th Street, Tucson, AZ 85721 66institutetext: University of Puerto Rico, Rio Piedras Campus, Physics Dept., Box 23343, UPR station, San Juan, Puerto Rico 77institutetext: Center for Astrophysics and Space Astronomy, University of Colorado, Boulder, CO 80309-0389, USA 88institutetext: NASA Herschel Science Center, IPAC, Caltech, Pasadena, CA 91125, USA 99institutetext: ASI Science Data Center, I-00044 Frascati (Rome), Italy 1010institutetext: National Astronomical Observatories, Chinese Academy of Sciences, Beijing 100012, China 1111institutetext: Canadian Institute for Theoretical Astrophysics, University of Toronto, 60 St. George Street, Toronto, ON M5S 3H8, Canada 1212institutetext: Department of Astronomy & Astrophysics, University of Toronto, 50 St. George Street, Toronto, ON M5S 3H4, Canada 1313institutetext: Astrophysics Research Institute, Liverpool John Moores University, Twelve Quays House, Egerton Wharf, Birkenhead CH41 1LD 1414institutetext: Laboratoire AIM, CEA/IRFU CNRS Université Paris Diderot, Service d Astrophysique, 91191 Gif-sur-Yvette, France 1515institutetext: School of Physics, University of Exeter, Stocker Road, Exeter, EX4 4QL, United Kingdom 1616institutetext: INAF, Osservatorio Astrofisico di Arcetri, Largo E. Fermi 5, I-50125, Firenze, Italy 1717institutetext: Spitzer Science Center, IPAC, MS 220-6, California Institute of Technology, Pasadena, CA 91125, USA 1818institutetext: Centre for Astrophysics and Planetary Science, University of Kent, Canterbury CT2 7NH, UK 1919institutetext: Dipartimento di Fisica, Università del Salento, CP 193, I-73100 Lecce, Italy 2020institutetext: ESO, Karl Schwarzschild-Strasse 2, 85748 Garching bei München, Germany 2121institutetext: Centre for Astrophysics Research, University of Hertfordshire, College Lane, Hatfield AL10 9AB, UK 2222institutetext: Dipartimento di Fisica, Università di Roma 2 “Tor Vergata”, Rome, Italy 2323institutetext: Dipartimento di Fisica, Università di Roma 1 “La Sapienza”, Rome, Italy

A Herschel study of YSO evolutionary stages and formation timelines in two fields of the Hi-GAL survey thanks: Herschel is an ESA space observatory with science instruments provided by European-led Principal Investigator consortia and with important participation from NASA.

D. Elia A Herschel study of YSO evolutionary stages and formation timelines in two fields of the Hi-GAL survey thanks: Herschel is an ESA space observatory with science instruments provided by European-led Principal Investigator consortia and with important participation from NASA.A Herschel study of YSO evolutionary stages and formation timelines in two fields of the Hi-GAL survey thanks: Herschel is an ESA space observatory with science instruments provided by European-led Principal Investigator consortia and with important participation from NASA.A Herschel study of YSO evolutionary stages and formation timelines in two fields of the Hi-GAL survey thanks: Herschel is an ESA space observatory with science instruments provided by European-led Principal Investigator consortia and with important participation from NASA.A Herschel study of YSO evolutionary stages and formation timelines in two fields of the Hi-GAL survey thanks: Herschel is an ESA space observatory with science instruments provided by European-led Principal Investigator consortia and with important participation from NASA.    E. Schisano A Herschel study of YSO evolutionary stages and formation timelines in two fields of the Hi-GAL survey thanks: Herschel is an ESA space observatory with science instruments provided by European-led Principal Investigator consortia and with important participation from NASA.A Herschel study of YSO evolutionary stages and formation timelines in two fields of the Hi-GAL survey thanks: Herschel is an ESA space observatory with science instruments provided by European-led Principal Investigator consortia and with important participation from NASA.A Herschel study of YSO evolutionary stages and formation timelines in two fields of the Hi-GAL survey thanks: Herschel is an ESA space observatory with science instruments provided by European-led Principal Investigator consortia and with important participation from NASA.A Herschel study of YSO evolutionary stages and formation timelines in two fields of the Hi-GAL survey thanks: Herschel is an ESA space observatory with science instruments provided by European-led Principal Investigator consortia and with important participation from NASA.    S. Molinari A Herschel study of YSO evolutionary stages and formation timelines in two fields of the Hi-GAL survey thanks: Herschel is an ESA space observatory with science instruments provided by European-led Principal Investigator consortia and with important participation from NASA.A Herschel study of YSO evolutionary stages and formation timelines in two fields of the Hi-GAL survey thanks: Herschel is an ESA space observatory with science instruments provided by European-led Principal Investigator consortia and with important participation from NASA.    T. Robitaille A Herschel study of YSO evolutionary stages and formation timelines in two fields of the Hi-GAL survey thanks: Herschel is an ESA space observatory with science instruments provided by European-led Principal Investigator consortia and with important participation from NASA.A Herschel study of YSO evolutionary stages and formation timelines in two fields of the Hi-GAL survey thanks: Herschel is an ESA space observatory with science instruments provided by European-led Principal Investigator consortia and with important participation from NASA.    D. Anglés-Alcázar A Herschel study of YSO evolutionary stages and formation timelines in two fields of the Hi-GAL survey thanks: Herschel is an ESA space observatory with science instruments provided by European-led Principal Investigator consortia and with important participation from NASA.A Herschel study of YSO evolutionary stages and formation timelines in two fields of the Hi-GAL survey thanks: Herschel is an ESA space observatory with science instruments provided by European-led Principal Investigator consortia and with important participation from NASA.    J. Bally A Herschel study of YSO evolutionary stages and formation timelines in two fields of the Hi-GAL survey thanks: Herschel is an ESA space observatory with science instruments provided by European-led Principal Investigator consortia and with important participation from NASA.A Herschel study of YSO evolutionary stages and formation timelines in two fields of the Hi-GAL survey thanks: Herschel is an ESA space observatory with science instruments provided by European-led Principal Investigator consortia and with important participation from NASA.    C. Battersby A Herschel study of YSO evolutionary stages and formation timelines in two fields of the Hi-GAL survey thanks: Herschel is an ESA space observatory with science instruments provided by European-led Principal Investigator consortia and with important participation from NASA.A Herschel study of YSO evolutionary stages and formation timelines in two fields of the Hi-GAL survey thanks: Herschel is an ESA space observatory with science instruments provided by European-led Principal Investigator consortia and with important participation from NASA.    M. Benedettini A Herschel study of YSO evolutionary stages and formation timelines in two fields of the Hi-GAL survey thanks: Herschel is an ESA space observatory with science instruments provided by European-led Principal Investigator consortia and with important participation from NASA.A Herschel study of YSO evolutionary stages and formation timelines in two fields of the Hi-GAL survey thanks: Herschel is an ESA space observatory with science instruments provided by European-led Principal Investigator consortia and with important participation from NASA.    N. Billot A Herschel study of YSO evolutionary stages and formation timelines in two fields of the Hi-GAL survey thanks: Herschel is an ESA space observatory with science instruments provided by European-led Principal Investigator consortia and with important participation from NASA.A Herschel study of YSO evolutionary stages and formation timelines in two fields of the Hi-GAL survey thanks: Herschel is an ESA space observatory with science instruments provided by European-led Principal Investigator consortia and with important participation from NASA.    L. Calzoletti A Herschel study of YSO evolutionary stages and formation timelines in two fields of the Hi-GAL survey thanks: Herschel is an ESA space observatory with science instruments provided by European-led Principal Investigator consortia and with important participation from NASA.A Herschel study of YSO evolutionary stages and formation timelines in two fields of the Hi-GAL survey thanks: Herschel is an ESA space observatory with science instruments provided by European-led Principal Investigator consortia and with important participation from NASA.    A. M. Di Giorgio A Herschel study of YSO evolutionary stages and formation timelines in two fields of the Hi-GAL survey thanks: Herschel is an ESA space observatory with science instruments provided by European-led Principal Investigator consortia and with important participation from NASA.A Herschel study of YSO evolutionary stages and formation timelines in two fields of the Hi-GAL survey thanks: Herschel is an ESA space observatory with science instruments provided by European-led Principal Investigator consortia and with important participation from NASA.    F. Faustini A Herschel study of YSO evolutionary stages and formation timelines in two fields of the Hi-GAL survey thanks: Herschel is an ESA space observatory with science instruments provided by European-led Principal Investigator consortia and with important participation from NASA.A Herschel study of YSO evolutionary stages and formation timelines in two fields of the Hi-GAL survey thanks: Herschel is an ESA space observatory with science instruments provided by European-led Principal Investigator consortia and with important participation from NASA.    J. Z. Li A Herschel study of YSO evolutionary stages and formation timelines in two fields of the Hi-GAL survey thanks: Herschel is an ESA space observatory with science instruments provided by European-led Principal Investigator consortia and with important participation from NASA.A Herschel study of YSO evolutionary stages and formation timelines in two fields of the Hi-GAL survey thanks: Herschel is an ESA space observatory with science instruments provided by European-led Principal Investigator consortia and with important participation from NASA.    P. Martin A Herschel study of YSO evolutionary stages and formation timelines in two fields of the Hi-GAL survey thanks: Herschel is an ESA space observatory with science instruments provided by European-led Principal Investigator consortia and with important participation from NASA.A Herschel study of YSO evolutionary stages and formation timelines in two fields of the Hi-GAL survey thanks: Herschel is an ESA space observatory with science instruments provided by European-led Principal Investigator consortia and with important participation from NASA.A Herschel study of YSO evolutionary stages and formation timelines in two fields of the Hi-GAL survey thanks: Herschel is an ESA space observatory with science instruments provided by European-led Principal Investigator consortia and with important participation from NASA.A Herschel study of YSO evolutionary stages and formation timelines in two fields of the Hi-GAL survey thanks: Herschel is an ESA space observatory with science instruments provided by European-led Principal Investigator consortia and with important participation from NASA.    L. Morgan A Herschel study of YSO evolutionary stages and formation timelines in two fields of the Hi-GAL survey thanks: Herschel is an ESA space observatory with science instruments provided by European-led Principal Investigator consortia and with important participation from NASA.A Herschel study of YSO evolutionary stages and formation timelines in two fields of the Hi-GAL survey thanks: Herschel is an ESA space observatory with science instruments provided by European-led Principal Investigator consortia and with important participation from NASA.    F. Motte A Herschel study of YSO evolutionary stages and formation timelines in two fields of the Hi-GAL survey thanks: Herschel is an ESA space observatory with science instruments provided by European-led Principal Investigator consortia and with important participation from NASA.A Herschel study of YSO evolutionary stages and formation timelines in two fields of the Hi-GAL survey thanks: Herschel is an ESA space observatory with science instruments provided by European-led Principal Investigator consortia and with important participation from NASA.    J. C. Mottram A Herschel study of YSO evolutionary stages and formation timelines in two fields of the Hi-GAL survey thanks: Herschel is an ESA space observatory with science instruments provided by European-led Principal Investigator consortia and with important participation from NASA.A Herschel study of YSO evolutionary stages and formation timelines in two fields of the Hi-GAL survey thanks: Herschel is an ESA space observatory with science instruments provided by European-led Principal Investigator consortia and with important participation from NASA.    P. Natoli A Herschel study of YSO evolutionary stages and formation timelines in two fields of the Hi-GAL survey thanks: Herschel is an ESA space observatory with science instruments provided by European-led Principal Investigator consortia and with important participation from NASA.A Herschel study of YSO evolutionary stages and formation timelines in two fields of the Hi-GAL survey thanks: Herschel is an ESA space observatory with science instruments provided by European-led Principal Investigator consortia and with important participation from NASA.    L. Olmi A Herschel study of YSO evolutionary stages and formation timelines in two fields of the Hi-GAL survey thanks: Herschel is an ESA space observatory with science instruments provided by European-led Principal Investigator consortia and with important participation from NASA.A Herschel study of YSO evolutionary stages and formation timelines in two fields of the Hi-GAL survey thanks: Herschel is an ESA space observatory with science instruments provided by European-led Principal Investigator consortia and with important participation from NASA.A Herschel study of YSO evolutionary stages and formation timelines in two fields of the Hi-GAL survey thanks: Herschel is an ESA space observatory with science instruments provided by European-led Principal Investigator consortia and with important participation from NASA.A Herschel study of YSO evolutionary stages and formation timelines in two fields of the Hi-GAL survey thanks: Herschel is an ESA space observatory with science instruments provided by European-led Principal Investigator consortia and with important participation from NASA.    R. Paladini A Herschel study of YSO evolutionary stages and formation timelines in two fields of the Hi-GAL survey thanks: Herschel is an ESA space observatory with science instruments provided by European-led Principal Investigator consortia and with important participation from NASA.A Herschel study of YSO evolutionary stages and formation timelines in two fields of the Hi-GAL survey thanks: Herschel is an ESA space observatory with science instruments provided by European-led Principal Investigator consortia and with important participation from NASA.    F. Piacentini A Herschel study of YSO evolutionary stages and formation timelines in two fields of the Hi-GAL survey thanks: Herschel is an ESA space observatory with science instruments provided by European-led Principal Investigator consortia and with important participation from NASA.A Herschel study of YSO evolutionary stages and formation timelines in two fields of the Hi-GAL survey thanks: Herschel is an ESA space observatory with science instruments provided by European-led Principal Investigator consortia and with important participation from NASA.    M. Pestalozzi A Herschel study of YSO evolutionary stages and formation timelines in two fields of the Hi-GAL survey thanks: Herschel is an ESA space observatory with science instruments provided by European-led Principal Investigator consortia and with important participation from NASA.A Herschel study of YSO evolutionary stages and formation timelines in two fields of the Hi-GAL survey thanks: Herschel is an ESA space observatory with science instruments provided by European-led Principal Investigator consortia and with important participation from NASA.    S. Pezzuto A Herschel study of YSO evolutionary stages and formation timelines in two fields of the Hi-GAL survey thanks: Herschel is an ESA space observatory with science instruments provided by European-led Principal Investigator consortia and with important participation from NASA.A Herschel study of YSO evolutionary stages and formation timelines in two fields of the Hi-GAL survey thanks: Herschel is an ESA space observatory with science instruments provided by European-led Principal Investigator consortia and with important participation from NASA.    D. Polychroni A Herschel study of YSO evolutionary stages and formation timelines in two fields of the Hi-GAL survey thanks: Herschel is an ESA space observatory with science instruments provided by European-led Principal Investigator consortia and with important participation from NASA.A Herschel study of YSO evolutionary stages and formation timelines in two fields of the Hi-GAL survey thanks: Herschel is an ESA space observatory with science instruments provided by European-led Principal Investigator consortia and with important participation from NASA.    M. D. Smith A Herschel study of YSO evolutionary stages and formation timelines in two fields of the Hi-GAL survey thanks: Herschel is an ESA space observatory with science instruments provided by European-led Principal Investigator consortia and with important participation from NASA.A Herschel study of YSO evolutionary stages and formation timelines in two fields of the Hi-GAL survey thanks: Herschel is an ESA space observatory with science instruments provided by European-led Principal Investigator consortia and with important participation from NASA.    F. Strafella A Herschel study of YSO evolutionary stages and formation timelines in two fields of the Hi-GAL survey thanks: Herschel is an ESA space observatory with science instruments provided by European-led Principal Investigator consortia and with important participation from NASA.A Herschel study of YSO evolutionary stages and formation timelines in two fields of the Hi-GAL survey thanks: Herschel is an ESA space observatory with science instruments provided by European-led Principal Investigator consortia and with important participation from NASA.    G. S. Stringfellow A Herschel study of YSO evolutionary stages and formation timelines in two fields of the Hi-GAL survey thanks: Herschel is an ESA space observatory with science instruments provided by European-led Principal Investigator consortia and with important participation from NASA.A Herschel study of YSO evolutionary stages and formation timelines in two fields of the Hi-GAL survey thanks: Herschel is an ESA space observatory with science instruments provided by European-led Principal Investigator consortia and with important participation from NASA.    L. Testi A Herschel study of YSO evolutionary stages and formation timelines in two fields of the Hi-GAL survey thanks: Herschel is an ESA space observatory with science instruments provided by European-led Principal Investigator consortia and with important participation from NASA.A Herschel study of YSO evolutionary stages and formation timelines in two fields of the Hi-GAL survey thanks: Herschel is an ESA space observatory with science instruments provided by European-led Principal Investigator consortia and with important participation from NASA.    M. A. Thompson A Herschel study of YSO evolutionary stages and formation timelines in two fields of the Hi-GAL survey thanks: Herschel is an ESA space observatory with science instruments provided by European-led Principal Investigator consortia and with important participation from NASA.A Herschel study of YSO evolutionary stages and formation timelines in two fields of the Hi-GAL survey thanks: Herschel is an ESA space observatory with science instruments provided by European-led Principal Investigator consortia and with important participation from NASA.    A. Traficante A Herschel study of YSO evolutionary stages and formation timelines in two fields of the Hi-GAL survey thanks: Herschel is an ESA space observatory with science instruments provided by European-led Principal Investigator consortia and with important participation from NASA.A Herschel study of YSO evolutionary stages and formation timelines in two fields of the Hi-GAL survey thanks: Herschel is an ESA space observatory with science instruments provided by European-led Principal Investigator consortia and with important participation from NASA.    M. Veneziani A Herschel study of YSO evolutionary stages and formation timelines in two fields of the Hi-GAL survey thanks: Herschel is an ESA space observatory with science instruments provided by European-led Principal Investigator consortia and with important participation from NASA.A Herschel study of YSO evolutionary stages and formation timelines in two fields of the Hi-GAL survey thanks: Herschel is an ESA space observatory with science instruments provided by European-led Principal Investigator consortia and with important participation from NASA.

We present a first study of the star-forming compact dust condensations revealed by Herschel in the two 2°×2°2°2°2\degr\times 2\degr Galactic Plane fields centered at [,b]=[30,0]𝑏superscript30superscript0[\ell,b]=[30^{\circ},0^{\circ}] and [,b]=[59,0]𝑏superscript59superscript0[\ell,b]=[59^{\circ},0^{\circ}], respectively, and observed during the Science Demonstration Phase for the Herschel infrared Galactic Plane survey (Hi-GAL) Key-Project. Compact source catalogs extracted for the two fields in the five Hi-GAL bands (70, 160, 250, 350 and 500μ𝜇\mum) were merged based on simple criteria of positional association and spectral energy distribution (SED) consistency into a final catalog which contains only coherent SEDs with counterparts in at least three adjacent Herschel bands. These final source lists contain 528 entries for the =30superscript30\ell=30^{\circ} field, and 444 entries for the =59superscript59\ell=59^{\circ} field. The SED coverage has been augmented with ancillary data at 24 μ𝜇\mum and 1.1 mm. SED modeling for the subset of 318 and 101 sources (in the two fields, respectively) for which the distance is known was carried out using both a structured star/disk/envelope radiative transfer model and a simple isothermal grey-body. Global parameters like mass, luminosity, temperature and dust properties have been estimated. The Lbol/Menvsubscript𝐿bolsubscript𝑀envL_{\textrm{bol}}/M_{\textrm{env}} ratio spans four orders of magnitudes from values compatible with the pre-protostellar phase to embedded massive zero-age main sequence stars. Sources in the =59superscript59\ell=59^{\circ} field have on average lower L/M𝐿𝑀L/M, possibly outlining an overall earlier evolutionary stage with respect to the sources in the =30superscript30\ell=30^{\circ} field. Many of these cores are actively forming high-mass stars, although the estimated core surface densities appear to be an order of magnitude below the 1 g cm-2 critical threshold for high-mass star formation.

Key Words.:
Stars: formation – stars: pre-main sequence

1 Introduction

The chance to observe the far-infrared emission from cold dust condensations in star-forming regions is one of the most important improvements offered by the PACS (Poglitsch et al., 2010) and SPIRE (Griffin et al., 2010) cameras on board the ESA Herschel Space Observatory (Pilbratt et al., 2010). The Herschel Infrared Galactic Plane Survey (Hi-GAL Molinari et al., 2010a, b) is a Herschel Key-Project that maps the inner Galaxy (||<60,|b|<1formulae-sequencesuperscript60𝑏superscript1|\ell|<60^{\circ},|b|<1^{\circ}) in five photometric bands (centered at 70, 160, 250, 350, and 500 μ𝜇\mum) and has been designed mainly for observing star-forming regions and cold interstellar medium (ISM) structures with unprecedented spatial resolution. Thanks to its capabilities in terms of spectral coverage, resolution and sensitivity, it is expected to provide a huge progress in the study of the early stages of star formation, and in particular for disclosing new knowledge about the formation of massive stars.

Indeed, the mass of a young stellar object (YSO) plays a critical role in distinguishing between various possible regimes and the timescales of evolutionary paths. Whereas the sequence for the formation of Solar mass objects is quite well-defined, for high-mass protostars (M8M𝑀8subscript𝑀direct-productM\geq 8\leavevmode\nobreak\ M_{\odot}) it is not completely clear yet, due to the rarity of these sources in the Solar neighborhood (d1𝑑1d\leq 1 kpc) and their shorter evolutionary timescales (it is expected that such stars begin burning hydrogen while still accreting mass from the parental gas envelope).

The analysis of the infrared spectral energy distribution (SED) is a powerful method used to classify YSOs from the evolutionary point of view, and indeed the classification scheme (coded in Classes from 0 to III) proposed by Lada & Wilking (1984) and refined by André et al. (1993) is now well-established and commonly used for characterizing the population of star-forming regions. Saraceno et al. (1996) derived physical properties from SED fits, and plotted in a diagnostic diagram the bolometric luminosity vs the envelope mass to easily categorize the YSOs and describe the entire Class 0-II evolution. More recently Molinari et al. (2008) extended this analysis to massive YSOs, and demonstrated that it is applicable and meaningful also in this case. In this paper, we intend to apply the same methodology to the source samples extracted from the Hi-GAL maps obtained during the Herschel Science Demonstration Phase (SDP), and to perform a very first test on its ability to describe the star formation timeline of the investigated regions. We describe how the SEDs were assembled and how models were fitted to data to estimate the physical parameters of the sources. Finally, we briefly discuss the Lbol/Menvsubscript𝐿bolsubscript𝑀envL_{\rm bol}/M_{\rm env} vs Menvsubscript𝑀envM_{\rm env} diagram.

2 SED building

For each of the two SDP fields, a first catalog based on the Hi-GAL image photometry has been compiled, identifying the sources detected in the five different bands (see Molinari et al., 2010b, for details) based on simple positional association. Starting from the source extraction list at the longest wavelength, namely 500 μ𝜇\mum, an association with the previous band (in this case, 350 μ𝜇\mum) was established if a source was found within a search radius corresponding to the Herschel half-power beam-width at the longer of the two considered wavelengths; if multiple associations were found, the closest source was kept. Other counterparts fulfilling the positional association criterium were not merged, but were added anyway as independent sources and considered as such in the following steps. The celestial coordinates assigned to the merged sources are those corresponding to the shorter wavelength association, which is by definition characterized by higher spatial resolution. After having correlated the first two wavelengths, a list composed by associated sources (hereafter considered as the same source) and by unassociated single-band detections in both wavelengths was obtained. Entries in this list were then correlated with the next wavelength source list according to the same criteria, and so on, down to 70 μ𝜇\mum. The occurrences of multiple associations tend to be more frequent with decreasing wavelength (and increasing resolution), but for the time being we did not attempt to split up the flux at any given band into the contributions by different counterparts detected at the shorter wavelengths.

The catalogs resulting at the end of this procedure (which we will call Stage 1 catalogs) contain 2022 entries for the =30superscript30\ell=30^{\circ} field, and 1322 entries for the =59superscript59\ell=59^{\circ} field. Entries in these catalogs are in principle SEDs exhibiting a variable number of counterparts for the various Herschel bands for which the positional association was successful. An investigation of the resulting SEDs reveals a variety of situations in which the positional association clearly did not work properly; this is apparent in SEDs which have missing bands and/or deep concavities due to a flux that is inconsistent with adjacent ones. This may happen either because the simple positional association failed, or because the flux extracted for that source in the detection and photometry stage Molinari et al. (2010b) in that particular band was corrupted (e.g. the source fitting did not converge because of source crowding or particularly difficult background conditions). These irregular SEDs were excluded from further analysis, as they are unreliable. The remaining sources populate the so-called Stage 2 catalog (see Table 1). The subsequent selection step is two-fold and generates on the one hand a Stage 3a catalog containing sources detected in at least the four 70,160, 250 and 350 μ𝜇\mum bands, which will be used for the color-color analysis. On the other hand, for the purpose of SED modeling (see Sect. 3) we choose sources which have at least three bands, but for which a distance is available (Russeil et al., 2010); this will generate the Stage 3b catalogs.

Table 1: Source catalog statistics
=30superscript30\ell=30^{\circ} =59superscript59\ell=59^{\circ}
Stage 1 All sources detected in at least one PACS/SPIRE band 2022 1322
Stage 2 Stage 1 sources excluding those with irregular SEDs 528 444
Stage 3a Stage 2 sources identified in at least the 70, 160, 250 and 350μ𝜇\mum bands 236 141
Stage 3b Stage 2 sources identified in at least three bands, but also with a known distance 318 101

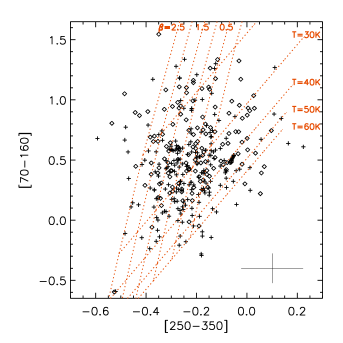
In Fig. 1 a [70–160] vs [250–350] two-color diagram is presented for the Stage 3a catalog. For comparison, a grid representing the isothermal greybody model loci is also overplotted. The analytical expression of a greybody is

Sν=Mκ0d2(νν0)βBν(T),subscript𝑆𝜈𝑀subscript𝜅0superscript𝑑2superscript𝜈subscript𝜈0𝛽subscript𝐵𝜈𝑇S_{\nu}=\frac{M\leavevmode\nobreak\ \kappa_{0}}{d^{2}}\left(\frac{\nu}{\nu_{0}}\right)^{\beta}B_{\nu}(T)\;, (1)

where M𝑀M is the total (gas + dust) core mass, κ0subscript𝜅0\kappa_{0} is the total mass absorption coefficient evaluated at a fixed frequency ν0subscript𝜈0\nu_{0} (in this case κ0=0.005subscript𝜅00.005\kappa_{0}=0.005 cm2 g-1 at ν0=230subscript𝜈0230\nu_{0}=230 GHz, Preibisch et al., 1993), d𝑑d is the distance to the object, β𝛽\beta is the dust emissivity index, and Bν(T)subscript𝐵𝜈𝑇B_{\nu}(T) is the Planck function.

Although there is no evidence of segregation, we can affirm that the colors are consistent with greybodies having temperatures in the range of 20T60less-than-or-similar-to20𝑇less-than-or-similar-to6020\lesssim T\lesssim 60 K. We note however that a noticeable fraction of sources lies in the region of the plot corresponding to negative β𝛽\beta values. One possibility is that the single temperature assumption in Eq. 1 is incorrect and that a multicomponent fit would be warranted. This is in line with the accepted scenario in which envelopes around YSOs show a radial temperature gradient. The other possibility is that we are overestimating the flux at longer wavelengths (thus flattening the SED in the submillimeter range and mimicking a low or negative β𝛽\beta) because we are associating counterparts whose size is increasing at increasing wavelengths. Both effects are probably playing a role here.

An alternative approach in building SEDs would have been to use the same size at all wavelengths, but this would have meant either degrading the map resolution to a common grid (the 500μ𝜇\mum one), or forcing the detection at 350 and 500μ𝜇\mum using the sources detected shortward of 250μ𝜇\mum and constraining the flux estimates to the same source size as measured at 250μ𝜇\mum (and taking the different beam sizes into account). There are disadvantages in both cases; besides, the flux extraction from the 350 and 500μ𝜇\mum maps on the locations of the 250μ𝜇\mum detected sources is not at all straightforward. These alternative possibilities will be investigated in subsequent works.

Refer to caption
Figure 1: Two-color diagram [70–160] vs [250–350] for the Stage 3a sources cataloged in the two investigated fields (crosses for =30superscript30\ell=30^{\circ}, and diamonds for =59superscript59\ell=59^{\circ}, respectively).  Red dotted lines represent the loci of greybodies for various constant values of temperature and emissivity law exponent. In the bottom right corner the average error bar is reported.

3 SED fitting

To obtain a first estimate of the physical parameters of the catalog sources, the observed SEDs were fit using both i) the grid of models from Robitaille et al. (2006) and the SED-fitting tool of Robitaille et al. (2007), based on the YSO/disk/envelope model of Whitney et al. (2003), and ii) the simple greybody model (see Eq. 1). The Stage 3b source catalog (Table 1) was used for the analysis: this reduced the final investigated subsample to 318 objects for =30superscript30\ell=30^{\circ}, and 101 at =59superscript59\ell=59^{\circ}, respectively.

In order to achieve a wider SED coverage, ancillary data from other Galactic plane surveys were exploited to find possible counterparts and associate them according to the same criteria described above. In particular, on MIPSGAL maps at 24 μ𝜇\mum (Carey et al., 2009) a source extraction was performed in the same way as for the Hi-GAL bands (Molinari et al., 2010b), returning 294 counterparts at =30superscript30\ell=30^{\circ}, and 89 at =59superscript59\ell=59^{\circ}, respectively. In addition, sources in the 1.1 mm band were retrieved from the Bolocam Galactic Plane Survey catalog (BGPS, Rosolowsky et al., 2009; Aguirre et al., 2010). A large difference in number is found between the millimeter counterparts available in the =30superscript30\ell=30^{\circ} and =59superscript59\ell=59^{\circ} regions; the final number of BGPS counterparts associated with Stage 3b sources in these two fields is 105 and only 4, respectively. This discrepancy arises because the =59superscript59\ell=59^{\circ} field is relatively far from the inner Galaxy, compared with =30superscript30\ell=30^{\circ}, then a smaller number of millimeter sources along the line of sight is reasonably expected.

The model grid of Robitaille et al. (2006) covers a large range of stellar masses (from 0.1 to 50 Msubscript𝑀direct-productM_{\odot}), and evolutionary stages (from embedded protostars to pre-main-sequence stars with low-mass circumstellar disks). The fitting tool uses linear regression to identify the best fitting models, allowing the interstellar extinction AVsubscript𝐴𝑉A_{V} and distance to be free parameters within user-defined ranges. All Herschel and MIPS 24 μ𝜇\mum fluxes were assigned 20% uncertainties, and all models that fit with a χ2superscript𝜒2\chi^{2} value satisfying χ2χbest23×ndatasuperscript𝜒2superscriptsubscript𝜒best23subscript𝑛data\chi^{2}-\chi_{\rm best}^{2}\leq 3\times n_{\rm data} were considered good fits. An interstellar extinction range of 0 to 20 was explored. Examples of a good and bad fits are shown in the top two panels of Fig. 2. Given the high number of free parameters in the models and the relatively limited number of SED points we concentrated our attention on the macroscopic indications that can be provided by the model, namely the bolometric luminosity and the envelope mass. We took all values of these two parameters for the set of fits considered acceptable (see above) and the median values are estimated and used as Menvsubscript𝑀envM_{\rm env} and Lbolsubscript𝐿bolL_{\rm bol} in our subsequent analysis.

Refer to caption
Figure 2: Panels (a) and (b): example of good and bad fit for two sources from =30superscript30\ell=30^{\circ}, respectively, obtained with the Robitaille et al. (2006) fitting procedure. The black filled circles with error bars show the MIPS and Herschel data. The black solid line represents the best fit; the grey solid lines in panel (a) show all other models providing a good fit to the data. For the badly fit source only the best fit is shown. Panel (c): the same SED of panel (a), but this time fitted with a greybody. Panel (d): the SED of a source from =59superscript59\ell=59^{\circ}, with only SPIRE+BGPS data, again fitted with a greybody. Physical parameters resulting from the greybody fit are also reported in panels (c) and (d), respectively.

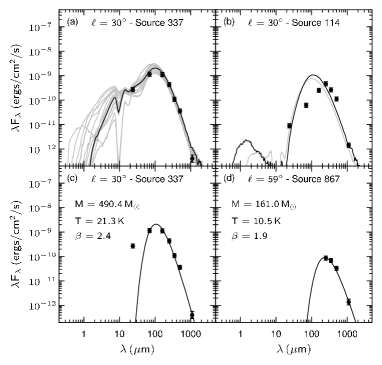
The SED-model fit provides acceptable results according to the above criteria for 127 source in the =30superscript30\ell=30^{\circ} field, and 43 sources in the =59superscript59\ell=59^{\circ} field. For the remaining sources no acceptable fits were found in the entire grid of models. A visual inspection showed that they are mostly sources where the SED peaks at λ𝜆absent\lambda\geq170μ𝜇\mum. These situations generally correspond to cold envelopes with an important fraction of the gas at temperatures T\leq30K, not considered in the model grid of Robitaille et al. (2006). These SEDs were fitted with a greybody function (Eq. 1) which is probably more adequate to describe early-stage (or pre-stellar) cores than the complex case of a protostar embedded in a dense envelope. The free parameters derived from weighted least-squares fitting (corresponding to the minimum χ2superscript𝜒2\chi^{2} value) are mass, β𝛽\beta index and temperature. The lower panels of Fig. 2 show two examples of SED best fit from =30superscript30\ell=30^{\circ} and =59superscript59\ell=59^{\circ}, respectively. They are chosen to display two different SED typologies: i) a source detected in all bands, with a 24 μ𝜇\mum flux, which suggests an embedded warm YSO, and ii) a source whose SED is composed only of SPIRE (250, 350 and 500 μ𝜇\mum) and BGPS (1.1 mm) fluxes that can be more reliably fitted with a greybody model.

As in the case shown in panel (c) of Fig. 2, in our sample the greybody fits generally fail in reproducing fluxes at wavelengths 70μabsent70𝜇\leq 70\leavevmode\nobreak\ \mum, where the approach based on Robitaille et al. (2007) turns out to be more appropriate.

From the fitted Stage 3b sample of sources, average temperatures and dust emissivity indices were calculated. No noticeable differences emerge from the temperature distribution: the average temperature and standard deviation are T30=23.7Kdelimited-⟨⟩subscript𝑇3023.7𝐾\langle T_{30}\rangle=23.7\leavevmode\nobreak\ K, σT30=13.8Ksubscript𝜎subscript𝑇3013.8𝐾\sigma_{T_{30}}=13.8\leavevmode\nobreak\ K, and T59=22.0Kdelimited-⟨⟩subscript𝑇5922.0𝐾\langle T_{59}\rangle=22.0\leavevmode\nobreak\ K, σT59=8.7Ksubscript𝜎subscript𝑇598.7𝐾\sigma_{T_{59}}=8.7\leavevmode\nobreak\ K for the two fields, respectively. On the other hand, the distribution of β𝛽\beta values appears to be more peaked for =59superscript59\ell=59^{\circ} (β59=1.0Kdelimited-⟨⟩subscript𝛽591.0𝐾\langle\beta_{59}\rangle=1.0\leavevmode\nobreak\ K, σβ59=0.8Ksubscript𝜎subscript𝛽590.8𝐾\sigma_{\beta_{59}}=0.8\leavevmode\nobreak\ K) than for =30superscript30\ell=30^{\circ} (β30=1.6Kdelimited-⟨⟩subscript𝛽301.6𝐾\langle\beta_{30}\rangle=1.6\leavevmode\nobreak\ K, σβ30=1.0Ksubscript𝜎subscript𝛽301.0𝐾\sigma_{\beta_{30}}=1.0\leavevmode\nobreak\ K), and centered on smaller values.

4 Evolutionary timeline for massive YSOs

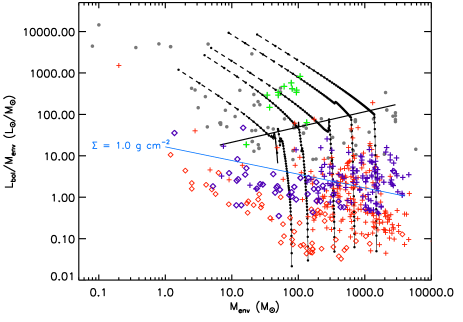
The physical parameters obtained from the SED fitting can be used to infer the evolutionary stage of the observed sources by means of tools like the plot of the bolometric luminosity Lbolsubscript𝐿bolL_{\rm bol} of a YSO and the total envelope mass Menvsubscript𝑀envM_{\rm env} as resulting from the fits. It has been exploited by Saraceno et al. (1996) and Molinari et al. (2008) to describe the evolutionary sequence for YSOs in the low mass and high mass regimes, respectively. Indeed, sources in different stages are expected to occupy different regions of this diagram: objects dominated by emission at large wavelengths (λ250μ𝜆250𝜇\lambda\geq 250\leavevmode\nobreak\ \mum) should have a Lbol/Menvsubscript𝐿bolsubscript𝑀envL_{\rm bol}/M_{\rm env} ratio smaller than that of more evolved ones. Here we prefer to plot the Lbol/Menvsubscript𝐿bolsubscript𝑀envL_{\rm bol}/M_{\rm env} ratio vs Menv (Fig. 3), also adapting predictions obtained from Molinari et al. (2008) using the McKee & Tan (2003) model of collapse in turbulence-supported cores. This model describes the standard free-fall accretion of an envelope onto a central core as a function of time, depicting evolutionary tracks that depend on the initial value of Menvsubscript𝑀envM_{\rm env} and on the final value of the central star mass msubscript𝑚m_{\star} when it supposedly joins the ZAMS. For the sake of brevity we refer the reader to the two papers mentioned above for a more exhaustive explanation; here we provide a brief and qualitative description. Each track starts from its right-bottom end, and at first proceeds almost vertically. In a region of the plane corresponding to the last third of the ascending tracks Molinari et al. (2008) found sources (open grey circles in Fig. 3) whose SEDs were not consistent with an embedded ZAMS star, and were then proposed as young and accreting pre-ZAMS protostars. The end of the accretion determines the end of the rapidly ascending tracks. In this region of the plot, where sources similar to YSOs associated with UCHII regions are found, their SED is compatible with embedded ZAMS. Starting from here, the tracks are essentially determined by residual accretion and envelope dispersal due to molecular outflows and stellar winds. This region is populated with ZAMS objects whose circumstellar envelope is of lesser and lesser importance.

Most of the points representing the sources of the present paper occupy a region Fig. 3 which corresponds to the accretion phase part of the evolutionary tracks. Crosses and diamonds represent sources for the =30superscript30\ell=30^{\circ} and =59superscript59\ell=59^{\circ} fields, respectively. In red are the objects which were fitted with a greybody. In blue we plot the sources which are successfully fitted with Robitaille et al. (2006) models, and where the parameters of the central embedded forming object are not compatible with a ZAMS star for more than 60% of the models deemed acceptable. In green we plot the sources which could still be fitted as above, but where this time the central object has the properties characteristic of ZAMS stars in more than 40% of the acceptable models. It is reassuring that this first attempt at source classification confirms earlier results, in that objects presently modeled as embedded ZAMS are indeed located where ZAMS are predicted to be found.

A quite clear distinction emerges in Fig. 3 between sources of =30superscript30\ell=30^{\circ} and =59superscript59\ell=59^{\circ}. On the one hand, an evident selection effect is present on luminosities and masses for =30superscript30\ell=30^{\circ} due to the higher typical distance (a factor 3 compared with the sources in the =59superscript59\ell=59^{\circ} field), on the other hand almost all the sources from =59superscript59\ell=59^{\circ} have luminosities below 103Lsimilar-toabsentsuperscript103subscript𝐿direct-product\sim 10^{3}\leavevmode\nobreak\ L_{\odot}, despite a wide range of mass values. This would suggest a global difference from the evolutionary point of view between the population detected in the two considered Hi-GAL fields, influenced by the properties of the star-forming regions they host. For example, evidence of star formation in a more advanced stage in the =30superscript30\ell=30^{\circ} field are found in Bally et al. (2010).

Refer to caption
Figure 3: Lbol/Menvsubscript𝐿bolsubscript𝑀envL_{\rm bol}/M_{\rm env} vs Menvsubscript𝑀envM_{\rm env} plot for fitted SEDs in the two investigated fields (crosses for =30superscript30\ell=30^{\circ}, and diamonds for =59superscript59\ell=59^{\circ}, respectively). The blue and red colors refer to fits obtained using the Robitaille et al. (2006) method (except the green points identifying models compatible with a central ZAMS star) and the greybody, respectively. The remaining grey filled circles represent the sources studied in Molinari et al. (2008) (see their Fig. 9) and are plotted for comparison. Black lines represent the models (see text); dots mark 104superscript10410^{4} yr intervals. The colored line represents the L/M𝐿𝑀L/M threshold from Krumholz & McKee (2008)

.

Figure 3 then suggests that most of the objects detected at present and for which the SED could be reliably determined are in a very early (pre-ZAMS) phase of evolution. With the present data it is not possible to ascertain if all detected cores are actively forming stars (and of which mass) or if the population fraction at very low L/M𝐿𝑀L/M may be in a pre-protostellar phase. High L/M𝐿𝑀L/M ratios, however, are difficult to explain without an actively forming high-mass star. To be more quantitative we show in Fig. 3 the L/M𝐿𝑀L/M threshold corresponding to the critical core surface density of 1 g cm-2 for the formation of massive stars as can be derived according to Krumholz & McKee (2008).

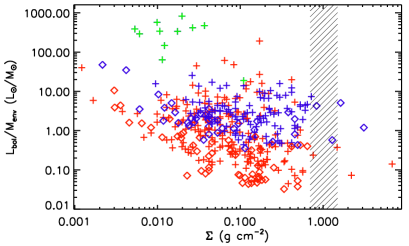
Based on this threshold, the fraction of cores actively forming massive stars would amount to 47% for =30superscript30\ell=30^{\circ} and 13% for =59superscript59\ell=59^{\circ}. However, after having calculated the surface density ΣΣ\Sigma as the ratio between the core mass and its area in the sky at 250 μ𝜇\mum, we find it quite puzzling that the cores we model exhibit surface densities well below the critical value. Figure 4 shows that the surface densities calculated for most of the cores are lower than the critical values needed to form stars in the range between 10 and 200 Msubscript𝑀direct-productM_{\odot} (the shaded area in the figure). It can be argued that the adoption of different dust mass opacities κ0subscript𝜅0\kappa_{0} could shift the distribution of points to the right, and partially beyond, the critical threshold. It is, however, difficult to explain why sources with L/M𝐿𝑀L/M above the critical threshold (above the sloping blue line in Fig. 3) do not occupy a specific region of the plot, but instead exhibit a scatter similar to the other sources in each region.

Refer to caption
Figure 4: Plot of Lbol/Menvsubscript𝐿bolsubscript𝑀envL_{\rm bol}/M_{\rm env} vs core surface density in the two investigated fields (symbols are the same as in Fig. 3, except for green crosses, which are not plotted here). The hashed area marks Σ=1Σ1\Sigma=1 g cm-2.
Acknowledgements.
Data processing and maps production has been possible thanks to ASI generous support via contract I/038/080/0.

References

  • Aguirre et al. (2010) Aguirre et al. 2010, submitted
  • André et al. (1993) André, Ph., Ward-Thompson, D., & Barsony M. 1993, ApJ, 406, 122
  • Bally et al. (2010) Bally, J. et al. 2010, this volume
  • Carey et al. (2009) Carey, S. J. et al. 2009, PASP, 121, 76
  • Krumholz & McKee (2008) Krumholz, M. R., & McKee, C. F. 2008, Nature, 451, 1082
  • Lada & Wilking (1984) Lada C. J., & Wilking, B.A. 1984, ApJ, 287, 610
  • McKee & Tan (2003) McKee, C. F., & Tan, J. C. 2003, ApJ, 585, 850
  • Molinari et al. (2008) Molinari, S. et al. 2008, A&A, 481, 345
  • Molinari et al. (2010a) Molinari, S. et al. 2010a, PASP, 122, 314
  • Molinari et al. (2010b) Molinari, S. et al. 2010b, this volume
  • Griffin et al. (2010) Griffin, M. J. et al. 2010, this volume
  • Pilbratt et al. (2010) Pilbratt, G. et al. 2010, this volume
  • Poglitsch et al. (2010) Poglitsch, A. et al. 2010, this volume
  • Preibisch et al. (1993) Preibisch, T., Ossenkopf, V., Yorke, H. W., & Henning, T. 1993, A&A, 279, 577
  • Robitaille et al. (2006) Robitaille, T. P., Whitney, B. A., Indebetouw, R., Wood, K., & Denzmore, P. 2006, ApJS, 167, 256
  • Robitaille et al. (2007) Robitaille, T. P., Whitney, B. A., Indebetouw, R., & Wood, K. 2007, ApJS, 169, 328
  • Rosolowsky et al. (2009) Rosolowsky, E., et al. 2009, arXiv:0909.2871v2
  • Russeil et al. (2010) Russeil, D. et al. 2010, in preparation
  • Saraceno et al. (1996) Saraceno, P., André, Ph., Ceccarelli, C., Griffin, M., & Molinari, S. 1996, A&A309, 827
  • Whitney et al. (2003) Whitney, B. A., Wood, K., Bjorkman, J. E., & Wolff, M. J. 2003, ApJ, 591, 1049