Herschel photometric observations of the nearby low metallicity irregular galaxy NGC 6822 ††thanks: Herschel is an ESA space observatory with science instruments provided by Principal Investigator consortia. It is open for proposals for observing time from the worldwide astronomical community.
We present the first Herschel PACS and SPIRE images of the low-metallicity galaxy NGC6822 observed from 70 to 500 m and clearly resolve the H ii regions with PACS and SPIRE. We find that the ratio 250/500 is dependent on the 24 m surface brightness in NGC6822, which would locally link the heating processes of the coldest phases of dust in the ISM to the star formation activity. We model the SEDs of some regions H ii regions and less active regions across the galaxy and find that the SEDs of H ii regions show warmer ranges of dust temperatures. We derive very high dust masses when graphite is used in our model to describe carbon dust. Using amorphous carbon, instead, requires less dust mass to account for submm emission due to its lower emissivity properties. This indicates that SED models including Herschel constraints may require different dust properties than commonly used. The global G/D of NGC6822 is finally estimated to be 186, using amorphous carbon.
Key Words.:
Galaxies: ISM – Galaxies: dwarf – Galaxies: photometry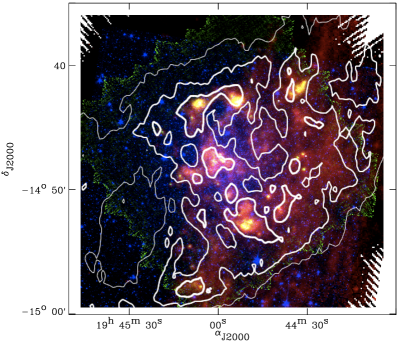 |
|
|
|
|
|
|
|
|
|
|
1 Introduction
The absorption of stellar radiation and its reemission by dust at infrared (IR) wavelengths is a fundamental process controlling the heating and cooling of the interstellar medium (ISM). The IRAS, ISO and Spitzer IR space telescopes launched the studies of the physics and chemistry of dust and gas, revealing their roles in the matter cycle and thermal balance in galaxies. The mid-infrared (MIR) to far-infrared (FIR) wavelength windows provide the necessary observational constraints on the spectral energy distribution (SED) modelling of galaxies from which properties of the polycyclic aromatic hydrocarbons (PAHs) and the warm (30K) and hot dust can be determined. Now, the Herschel Space Observatory (Pilbratt et al., 2010) is probing the submillimeter regime, where the coldest phases (30K) of dust can be revealed.
Dwarf galaxies of the Local Group are nearby laboratories to spatially study the life cycle of the different dust components and the metal enrichment of low-metallicity ISM. NGC6822 is our closest (490 kpc; Mateo, 1998) metal-poor galaxy neighbour ( 30 ) beyond the Magellanic Clouds and possesses isolated star forming (SF) regions at different evolutionary stages. The galaxy is a perfect candidate to study the feedback of the star formation on the low-metallicity ISM by analysing the spatial variations of its SEDs. NGC6822 also possesses an intriguing rotating H i disk of 1.34 108 , that extends far beyond the optical disk (Mateo, 1998) and has one of the largest HI holes ever observed in a dwarf galaxy (de Blok & Walter, 2000).
NGC6822 was observed in 2009 October as part of the Science Demonstration observations for the Dwarf Galaxy Survey (PI : S. Madden), with the instruments PACS and SPIRE at 70, 100, 160 and 250, 350 and 500 m respectively. At SPIRE 500 m (36”), we can resolve ISM structures of 85pc, spatially sufficient to accurately probe the distribution of dust temperature throughout the galaxy, especially dust in its coldest phases.
2 Observations and data reduction
PACS (Poglitsch et al., 2010) observations were performed in cross scan map mode at 70, 100 and 160 m. The observations cover a region of 18’ 18’ around the starforming complexes of the galaxy also mapped with Spitzer (Cannon et al., 2006). Data reduction was carried out using a modified Herschel Interactive Processing Environment (HIPE) 3.0 pipeline, starting from the level 0 data and produced maps with pixel sizes of 3.2, 3.2 and 6.4” at 70, 100 and 160 m with PSF FWHM values of 5.2, 7.7 and 12” respectively. HIPE is used to suppress the bad pixels and those affected by saturation and convert the signal to Jy.pixel-1. We perfom flatfield correction and apply astrometry to the data cube. We then apply a multiresolution median transform (MMT) deglitching correction and a second order deglitching process to the data. We perform polynomial fits on half scan legs to subtract the baselines. The galaxy was masked in the data cube during this step to avoid an overestimation of the signal level on the source. The median baseline subtraction step suppresses most of the bolometer temperature drifts. We generate the final maps using the madmap method of HIPE. The absolute flux calibration uncertainties are estimated to be 10.
SPIRE (Griffin et al., 2010) observations, at 250, 350 and 500 m, cover a region of 26’ 26’. Data have been reprocessed from the level 1 cube following the steps described in Pohlen et al. (2010) and Bendo et al. (2010). The overall absolute calibration accuracy is estimated to be 15 (Swinyard et al., 2010). The pipeline produces maps with a pixel size of 6”, 10” and 14” at 250, 350 and 500 m with PSF FWHM values of 18”, 25” and 36” respectively. The SPIRE ICC has released preliminary multiplying factors to correct for extended sources: 1.02, 1.05 and 0.94 at 250, 350 and 500 m 111As advised by the ICC for SD papers, see http:// herschel.esac.esa.int/SDPwkshops/presentations/IR/3GriffinSPIRE SDP2009.pdf.
| a) |
|
b) |
|
c) |
|
3 Analysis
3.1 Herschel maps
Figure 1 is a color composition (size of the SPIRE maps) showing how stars, dust and H i gas (in contours) are distributed in the galaxy. IRAC 3.6 m band (blue) mostly traces the stellar emission while PACS 100 m (green) traces the warm dust. SPIRE 250 m (red) traces the cold dust phases. We find that the bright H ii regions are resolved at all Herschel wavelengths. The brightest IR/submm SF regions all coincide with H i peaks. While H i extends 30’ to the NW and SE of the galaxy, the big H i hole is devoid of dust emission. The star formation history of NGC6822 began 12-15 Gyr ago and has been quiescent until about 0.6-1 Gyr ago (Gallart et al., 1996; Wyder, 2001). Bianchi et al. (2001) found very young stellar populations (10Myr) in the star-forming regions Hubble V and X. These regions are also the brightest structures of the FIR and submm emission (see the two brightest knots in the North of NGC6822 in Fig. 1).
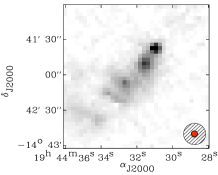
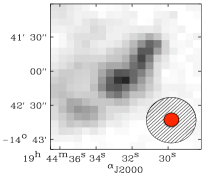
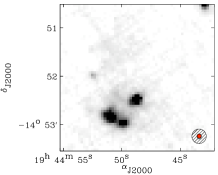
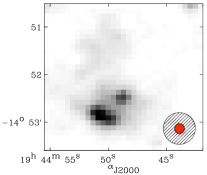
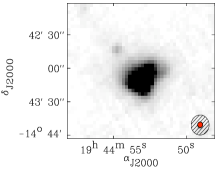
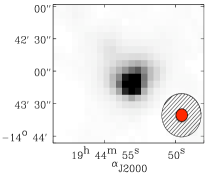
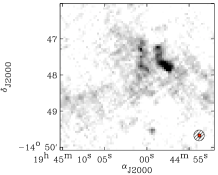
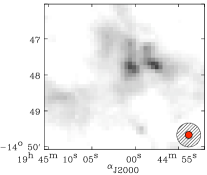
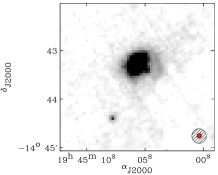
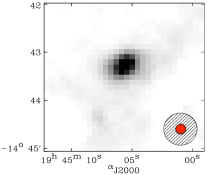
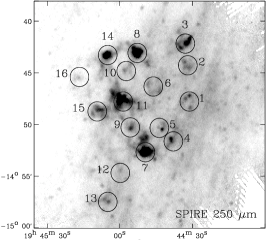
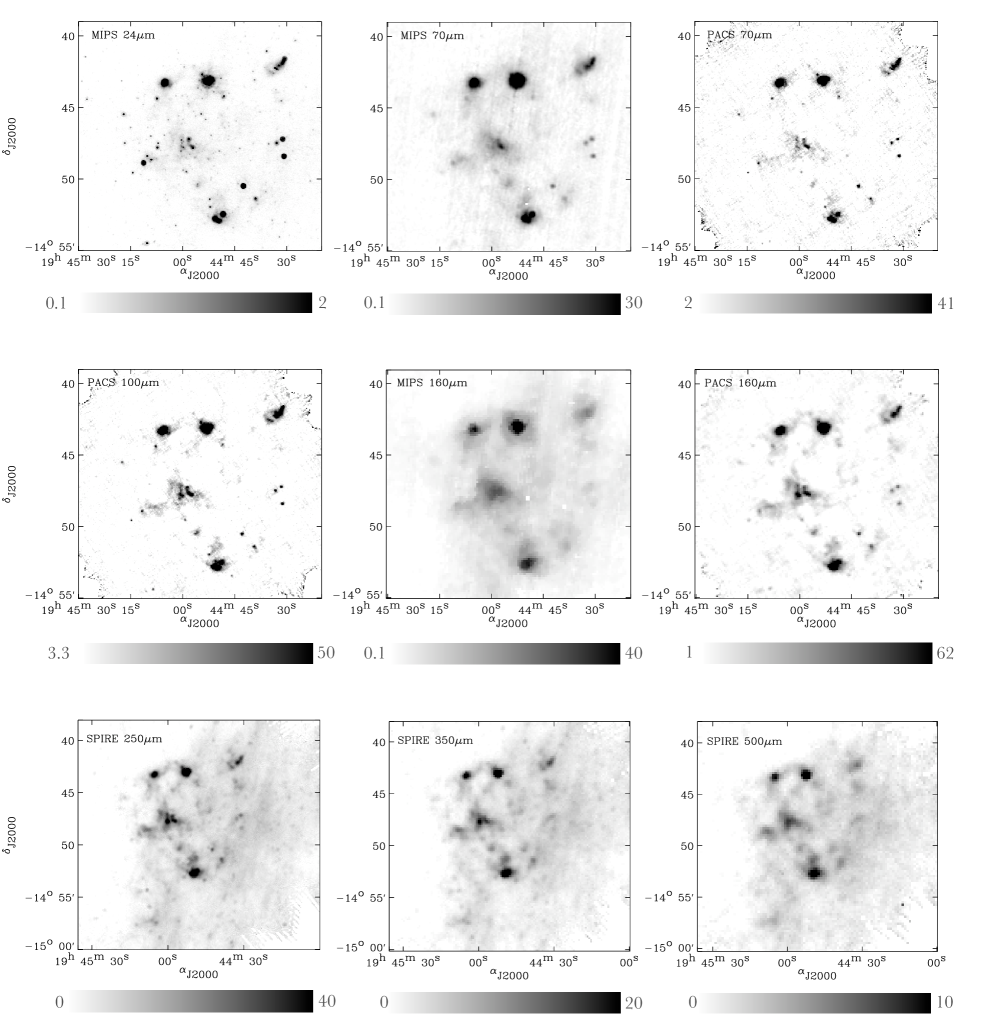
PACS 70 and 160 m observations of the 5 brightest star-forming regions of NGC6822 (Hubble I-III, IV, V, VI-VII and X) are shown in Fig. 2. These regions are respectively numbered 3, 7, 8, 11 and 14 in Fig. 3a. The increase in spatial resolution from MIPS (Cannon et al., 2006) to PACS (see the respective FWHM PSFs in Fig. 2) now enables us to nicely separate the different substructures of the H ii regions Hubble I-III (3) and Hubble VI-VII (11) (see online material for complete images) but also shows faint emission across the galaxy that was detected but not resolved with MIPS. To compare MIPS and PACS fluxes at 70 and 160 m for these H ii regions, we convolve the images to the lowest (FWHM MIPS 160 m: 40”) resolution (Bendo et al., 2010) and extract flux densities using the function aper of IDL in apertures of 57” radius (135 pc). We find that, for the bright H ii regions of NGC6822, MIPS and PACS flux densities compare within 25 at 70 and 160 m but 33 for Hubble V at 70 m. The SPIRE maps also resolve the structures detected with PACS. We find that the diffuse emission of NGC6822 is strongly affected by non homogeneous Galactic cirrus emission due to the low Galactic latitude of NGC6822 (low level diffuse emission in Fig. 3a). We model the cirrus emission in each map as a plane after first masking the emission that we associate with the galaxy. We then remove the modeled cirrus emission from each SPIRE map for the analysis. The cirrus contamination is estimated to be less than 10 of the flux densities of the star-forming regions at 250 and 350 m . It is less than 15 and 25 on the less active regions respectively at 250 m and 350 m. The contamination is finally estimated to be 25 on the bright regions at 500 m but can be as high as 50 of the emission in the lowest level of the diffuse ISM. Our quantitative results concern relatively bright regions. Thus, taking into account the various uncertainties, we attribute an overall conservative estimate of 30 for all SPIRE bands. We note that our results are strongly dependant on the SPIRE fluxes, more precisely on our treatment of cirrus emission that could have been underestimated if some of this emission is more significant along some lines of sight.
3.2 SPIRE band ratios
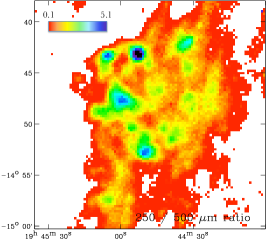
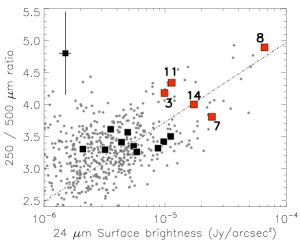
We convolve the 250 m map to the resolution of SPIRE 500 m (36”) and build a 250 / 500 flux density ratio map (Fig. 3b) to study the evolution of the submm regime of the SEDs. The ratio peaks in the H ii regions (Hubble V showing the highest ratio). This ratio map highlights the evolution of the dust temperature distribution across the galaxy: warmer toward the H ii regions and decreasing in the diffuse extended dust component between the H ii regions. To understand the processes contributing to the heating of dust, we examine how the submm part of the SED evolves with star formation. We select individual regions and estimate the SPIRE 250 and 500 m flux densities of these regions in apertures of 57” radius (Fig. 3a), corresponding to regions studied in Cannon et al. (2006). In Fig. 3c, we plot the 250 / 500 flux density ratio of the selected regions (squares) as a function of their 24 m surface brightness. The same 250/500 ratios performed on a pixel-by-pixel 222The pixel size of the maps was chosen to equal the FWHM of SPIRE 500 m (36”). basis throughout the whole map are overlaid (grey circles). The 24 m flux is commonly used as a tracer of star formation (e.g. Calzetti, 2007). The 250/500 ratios seem to correlate with the 24 m surface brightness across NGC6822, which could imply that the cold dust temperature distribution varies with the star formation activity of the region, with higher temperature dust present where star formation activity dominates (Boselli et al., 2010). Bendo et al. (2010) find that the SPIRE band ratios in M81depend on radius, and that the old stellar population of the bulge and disk could be the primary source for the dust emission seen by SPIRE. Their submm ratios do not show any strong correlation with 24 m surface brightness. This effect suggests that the dust heating processes in low metallicity starbursts may differ from normal dusty spirals. The ISM of dwarfs is, indeed, less opaque than spirals, with dense SF regions usually influencing the whole galaxy. These galaxies also tend to have a preponderance of younger stellar population and less evolved stars, and thus very different star formation histories.
 |
| Id | MHI | M a | MHI / M | M a | MHI/ M |
|---|---|---|---|---|---|
| [105 M☉] | [103 M☉] | [103 M☉] | |||
| 8 | 7.6 | 34 | 97 | ||
| 14 | 9.1 | 39 | 89 | ||
| 6 | 5.8 | 41 | 109 | ||
| 9 | 7.7 | 34 | 91 | ||
| 13 | 7.8 | 60 | 166 | ||
| Total | 500 b | 80 | 186 |
-
a
Dust mass derived using graphite (Gr) or amorphous carbon (AC).
-
b
H i mass corresponding to the region mapped with Herschel.
3.3 SEDs
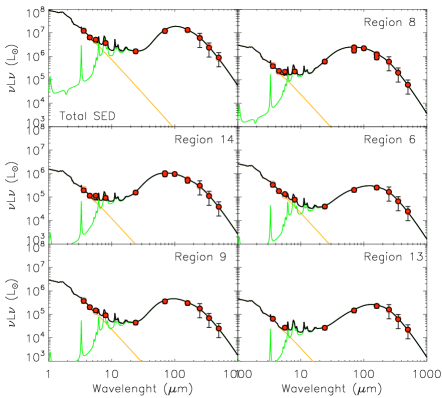
To study the variations of the local SEDs, we select two H ii regions (Hubble V and X, numbered 8 and 14 in Fig. 3a) and three less active regions (Reg. 6, 9 and 13). We suspect the median baseline filtering of the PACS reduction to remove some of the diffuse emission. PACS fluxes are thus not used in the modelling of the total SED and less active regions. Spitzer observations (SINGS 5th release; Kennicutt et al., 2003) complete the coverage. We convolve the images to MIPS 160 m resolution (40”) and estimate the flux densities within 57” radius apertures.
We use a realistic SED model which follows the approach of the Dale et al. (2001) and Draine & Li (2007) models, and use the dust composition and size distribution of Zubko et al. (2004). The interstellar radiation field is assumed to have the shape of the Galactic diffuse ISM of Mathis et al. (1983). The dust mass exposed to a given heating intensity U is given by: dMdust(U)U-αdU with UminUUmax (Dale et al., 2001). parametrises the contribution of the different local SEDs exposed to U. Details on the modelling can be found in Galametz et al. (2009). Serra Díaz-Cano & Jones (2008) study carbon dust in shock waves and warn about using graphites in dust models. To study how this choice affects our dust masses, we test both graphites and amorphous carbons (Rouleau & Martin, 1991) to describe the interstellar carbon dust. Figure 4 presents the global SED of NGC6822 along with the individual SEDs of the 5 selected regions obtained with amorphous carbons. No submm excess seems to be detected in NGC6822, contrary to other dwarf galaxies observed with Herschel (O′Halloran et al., 2010; Grossi et al., 2010). We find that the SEDs of H ii regions have warmer dust temperatures than less active regions. The total SED of NGC6822 does not show a high 24/70 ratio, indicating that it may not be dominated by the IR emission of bright H ii regions. The dust masses derived using graphites are 2.2 to 2.8 times higher than those using amorphous carbons (Table 1), due to their lower emissivity at submm wavelengh.
To estimate the gas-to-dust mass ratios (G/D), we derive the H i mass of our regions from the integrated map of de Blok & Walter (2000). We also estimate the H i mass corresponding to the region mapped with Herschel to be 5 107 . Gratier et al. (2010) found that H2 derived from CO observations should not represent more than 107 . Faint emission lines from warm H2 are observed in Hubble V (Hunter & Kaufman, 2007). Cannon et al. (2006) note that the major H ii regions correspond to the strongest H sources of the galaxy. From their H fluxes, we derive an H mass inferior to 105 in the H ii regions (Storey & Hummer, 1995, assuming T=104K and Ne=100). H i thus dominates the gas mass in NGC6822. The Galliano et al. (2008) models predicts G/D of 500 for galaxies presenting the metallicity of NGC6822. We find low G/D (Table 1) for the individual regions compared to what can be expected from chemical evolution models, especially when graphite grains are used in the modelling. Amorphous carbon results in a flatter submm slope compared to graphite and thus requires less mass to produce the same emission. These results are consistent with those found by Meixner et al. (2010) in the Large Magellanic Cloud. The total dust mass of the central region mapped with Herschel is 2.7 105 using amorphous carbon dust, leading to a total G/D of 186.
4 Conclusions
We present Herschel images of NGC6822 which resolve ISM structures up to 500 m. We find that the 250/500 ratio (tracing the cold dust temperature range) may be dependent on the 24 m surface brightness and thus trace the SF activity. We model individual SEDs across NGC6822 and show that the SED shape is evolving from H ii regions to less active regions, with H ii regions having a warmer dust temperature range. We derive very high dust masses using graphite to describe carbon dust and find that the use of amorphous carbon decreases the dust masses, indicating that SED models including Herschel constraints require different dust properties, namely more emissive grains.
Acknowledgements.
We thank the referee for his comments that help to improve the quality of this paper. We also thank Erwin de Blok for the integrated H i map of NGC6822. PACS has been developed by MPE (Germany); UVIE (Austria); KU Leuven, CSL, IMEC (Belgium); CEA, LAM (France); MPIA (Germany); INAF-IFSI/OAA/OAP/OAT, LENS, SISSA (Italy); IAC (Spain). This development has been supported by BMVIT (Austria), ESA-PRODEX (Belgium), CEA/CNES (France), DLR (Germany), ASI/INAF (Italy), and CICYT/MCYT (Spain). SPIRE has been developed by Cardiff University (UK); Univ. Lethbridge (Canada); NAOC (China); CEA, LAM (France); IFSI, Univ. Padua (Italy); IAC (Spain); SNSB (Sweden); Imperial College London, RAL, UCL-MSSL, UKATC, Univ. Sussex (UK) and Caltech, JPL, NHSC, Univ. Colorado (USA). This development has been supported by CSA (Canada); NAOC (China); CEA, CNES, CNRS (France); ASI (Italy); MCINN (Spain); Stockholm Observatory (Sweden); STFC (UK); and NASA (USA).References
- Bendo et al. (2010) Bendo, G. J. et al. 2010, A&A, in press
- Bianchi et al. (2001) Bianchi, L. et al. 2001, AJ, 121, 2020
- Boselli et al. (2010) Boselli, A. et al. 2010, A&A, in press
- Calzetti (2007) Calzetti, D. 2007, Nuovo Cimento B Serie, 122, 971
- Cannon et al. (2006) Cannon, J. M. et al. 2006, ApJ, 652, 1170
- Dale et al. (2001) Dale, D. A. et al. 2001, ApJ, 549, 215
- de Blok & Walter (2000) de Blok, W. J. G. & Walter, F. 2000, ApJ, 537, L95
- Draine & Li (2007) Draine, B. T. & Li, A. 2007, ApJ, 657, 810
- Galametz et al. (2009) Galametz, M. et al. 2009, A&A, 508, 645
- Gallart et al. (1996) Gallart, C. et al. 1996, AJ, 112, 1950
- Galliano et al. (2008) Galliano, F., Dwek, E., & Chanial, P. 2008, ApJ, 672, 214
- Gratier et al. (2010) Gratier, P. et al. 2010, A&A, 512, A68+
- Griffin et al. (2010) Griffin, M. et al. 2010, A&A, in press
- Grossi et al. (2010) Grossi, M. et al. 2010, A&A, in press
- Hunter & Kaufman (2007) Hunter, D. A. & Kaufman, M. 2007, AJ, 134, 721
- Kennicutt et al. (2003) Kennicutt, Jr., R. C. et al. 2003, PASP, 115, 928
- Mateo (1998) Mateo, M. L. 1998, ARA&A, 36, 435
- Mathis et al. (1983) Mathis, J. S., Mezger, P. G., & Panagia, N. 1983, A&A, 128, 212
- Meixner et al. (2010) Meixner, M. et al. 2010, A&A, in press
- O′Halloran et al. (2010) O′Halloran, B. et al. 2010, A&A, in press
- Pilbratt et al. (2010) Pilbratt, G. et al. 2010, A&A, in press
- Poglitsch et al. (2010) Poglitsch, A. et al. 2010, A&A, in press
- Pohlen et al. (2010) Pohlen, M. et al. 2010, A&A, in press
- Rouleau & Martin (1991) Rouleau, F. & Martin, P. G. 1991, ApJ, 377, 526
- Serra Díaz-Cano & Jones (2008) Serra Díaz-Cano, L. & Jones, A. P. 2008, A&A, 492, 127
- Storey & Hummer (1995) Storey, P. J. & Hummer, D. G. 1995, MNRAS, 272, 41
- Swinyard et al. (2010) Swinyard, B. et al. 2010, A&A, in press
- Wyder (2001) Wyder, T. K. 2001, AJ, 122, 2490
- Zubko et al. (2004) Zubko, V., Dwek, E., & Arendt, R. G. 2004, ApJS, 152, 211
 |