]Current address unknown
NMR Measurements of Power-Law Behavior in the Spin-Wave and Critical Regions of Ferromagnetic EuO
Abstract
Precision continuous-wave NMR measurements have been carried out over the entire magnetization curve of EuO and are presented in tabular form. Two very closely spaced resonances are observed and are attributed to domain and domain-wall signals. Both of the signals are useful for analysis in the spin-wave region. Only the domain signal is measurable above 50K. The latter is used for fitting and the critical exponent . The critical-region fits agree with previous measurements, within experimental error. The low-temperature data exhibit a clear-cut behavior, at variance with the expectations of conventional spin-wave theory. This result is discussed in relation to two semi-empirical spin-wave schemes, one formulated by N. Bykovetz, and one by U. Koebler. The NMR signal at 4.2K gives no indication of a quadrupole splitting, in contradiction to the interpretation of several previous spin-echo NMR spectra observed in EuO. This issue remains unresolved.
I Introduction
Precision continuous-wave (CW) nuclear magnetic resonance (NMR) measurements over the entire magnetization curve of EuO have been carried out and the behavior of these data is analyzed both in the spin-wave and in the critical regions. The low-temperature data exhibit a clear-cut behavior, at variance with the expectations of conventional spin-wave theory. The critical region power-law fit, however, agrees with other previous measurements, within experimental error.
Currently, there is still great interest in the study of EuO because of the varied and multifaceted characteristics it displays. Among others, oxygen-rich or Gd-doped EuO shows colossal magnetoresistance, while Eu-rich EuO exhibits a change in conductivity of 13 orders of magnitude in its insulator to metal transition1. Some current studies of EuO have a practical angle (spintronics), while others focus on testing theories (such as the Kondo-lattice model). While much is not yet clear in this broader area, the fundamental behavior of the localized spin (pure Heisenberg) model in EuO is also being put into question by recent measurements2. The results of the current low-temperature data will hopefully shed additional light on this latter issue. The principal focus of this paper is the unconventional (spin-wave) behavior of EuO at low temperatures in the context of a pattern of such behavior in other simple magnetic systems. In addtion, the critical-region parameters are examined.
While a strict low-temperature behavior in pure EuO was reported3 early on, those measurements were not backed up with numerical evidence. The current measurements are presented in tabular form (see Table 1) and show a linear-fit to with an excellent . In recent years, two alternative semi-empirical spin-wave schemes have been proposed to explain the simple power-law behaviors displayed by magnetic systems (in many cases not recognized by the original authors), beginning with the very first NMR measurement of a magnetically ordered system, 2H2O4. One scheme was developed by U. Koebler5, and one by N. Bykovetz6,7,8. The behavior found in the current EuO NMR data is consistent with both schemes.
| 4.200 | 138.500 | 69.703 | 62.519 | 41.715 | 67.570 | |
|---|---|---|---|---|---|---|
| 13.981 | 136.080 | 68.562 | 62.807 | 40.151 | 67.741 | |
| 17.990 | 134.190 | 17.830 | 66.654 | 63.286 | 38.681 | 67.882 |
| 21.269 | 132.240 | 21.127 | 65.730 | 63.507 | 38.654 | 67.888 |
| 25.850 | 129.050 | 25.701 | 63.776 | 63.973 | 37.674 | 67.974 |
| 26.991 | 128.090 | 26.838 | 60.773 | 64.608 | 37.230 | 68.015 |
| 28.637 | 126.715 | 28.491 | 58.989 | 64.976 | 36.833 | 68.055 |
| 32.188 | 123.523 | 32.014 | 57.067 | 65.347 | 36.471 | 68.082 |
| 34.360 | 121.370 | 34.189 | 53.371 | 65.993 | 35.736 | 68.144 |
| 38.075 | 117.352 | 37.945 | 52.340 | 66.160 | 34.782 | 68.221 |
| 38.926 | 116.350 | 38.773 | 51.135 | 66.357 | 34.442 | 68.250 |
| 42.402 | 112.020 | 42.277 | 51.019 | 66.369 | 34.121 | 68.271 |
| 43.180 | 111.000 | 43.023 | 49.248 | 66.643 | 33.663 | 68.312 |
| 47.488 | 104.720 | 47.357 | 47.544 | 66.852 | 33.086 | 68.357 |
| 98.822 | 50.873 | 46.182 | 67.044 | 32.585 | 68.397 | |
| 92.680 | 54.130 | 46.088 | 67.060 | 31.903 | 68.439 | |
| 78.507 | 59.914 | 44.385 | 67.266 | 31.812 | 68.445 | |
| 73.502 | 61.444 | 43.945 | 67.322 | 31.748 | 68.451 | |
| 71.795 | 61.933 | 43.275 | 67.399 | 31.600 | 68.460 | |
| 70.723 | 62.223 | 43.154 | 67.411 |
Using the scheme of Bykovetz, it is argued here that the behavior seen in the EuO NMR constitutes evidence against a pure localized-spin model as conceived in the conventional Dyson picture and formalism of magnetic interactions in ferromagnets.
Our NMR determination of critical parameters agrees with previous results using non-NMR methods9,10. However, it is an open question why the two so-called ideal Heisenberg ferromagnets EuO and EuS do not have more nearly identical critical exponents, ( in EuO and in EuS). EuS appears to exhibit the same as does MnF211,at variance with most isotropic 3D magnets.
Lastly, we note that a discrepancy still appears to exist between CW and spin-echo NMR measurements in EuO. The current NMR data, like the original CW data of Boyd12, give no indication of significant quadrupole splitting of the NMR resonance, whereas spin-echo measurements, which involve multi-layered processing of the raw data1, appear to show the presence of a substantial electric field gradient. An extensive discussion of this issue was presented in Ref. (1), but the issue still remains unresolved.
II Experiment
NMR measurements on polycrystalline EuO were carried out using a frequency-modulated spectrometer in zero external field. The temperature was determined by means of a platinum resistance thermometer. Because of the strong broadening of the NMR signal on approaching , it was decided to carry out the measurements by controlled temperature sweeps at fixed frequencies (similar to the method used in references (11) and (13)). For consistency, all data, except the helium-bath (4.2K) data point, were determined in this way.
III RESULTS AND DISCUSSION
A single narrow (25 kHz) NMR line was observed at 4.2K by sweeping the frequency, as was the case in the original CW measurement of Boyd12. No indication of quadrupolar splitting was evident. At temperatures above 17K, where the frequency was kept constant, and the NMR signal observed by sweeping the temperature, two closely spaced and overlapping signals were observed all the way up to 50K. The signal that peaks at the lower temperatures will be designated as , and at higher temperatures as . Fig. 1 shows the behavior of the signal relative to at three representative temperatures. One can see that the peak tapers off in intensity relative to the peak and becomes undetectable at 4.2K, whereas the peak becomes progressively smaller as 50K is approached, and is undetectable above this temperature where only the signal is observable. Near 27K, the signals have equal intensities.
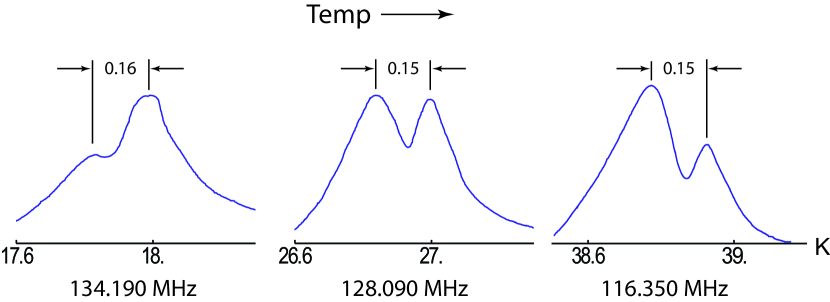
The signal is ascribed to NMR from domain-walls, since the domain-wall enhancement of NMR signals is strongest at lowest temperatures. The signal must, therefore come from the nuclei in the domains, since the domain walls become less extensive and their enhancement factor decreases as is approached. Comment, et al.1, presented an argument that in EuO, the domain-wall signal enhancement should be relatively small, but our results do not seem to support this contention.
Additional support for the assignment of the two NMR signals as originating in domain and domain-wall nuclei comes from the temperature independence of the separation of the peaks in the doublet. It can be seen from the data in Table 1 that the separation between the observed double peaks (cf., Fig 1 ) is constant, with K (on the average), over the temperature range where both signals could be measured. As will be seen, both the and the curves give an excellent fit to a power-law. Consequently, it can be shown that a constant temperature separation translates into a curve separation, . A similar separation was observed in CrBr3,14 where the identification of which resonance came from domain walls and which from within the domains was more clear-cut. It is to be noted that, as a consequence, if one of the curves () goes as , the other cannot be a pure curve, but must have an additional small corrective term, . It is conjectured that this term should be part of the curve, although the data are not precise enough to make a definitive determination using fitting techniques.
Focusing on data in the critical region, the following can be seen. Fits15 of the data (to the standard equation , re-cast in the form of a power law) give a of for data points within of , and a of 69.23K. The parameter . Fitting only points closer to , results in a small, but not a significant increase in as well as . Thus, for the temperature interval within of , becomes and 69.28K. The determinations of agree with previous macroscopic9 and neutron-scattering10 results, but are at odds with the Mossbauer16 determination. A check for frequency-pulling effects near was made by measuring the temperature dependence of the ratio of NMR frequencies in 151EuO to that in 153EuO (see Table 2). The lack of a systematic dependence of the ratio on temperature proves that any such effect is negligible. The value of the ratio of 151Eu to 153Eu frequencies is, however, lower than in EuS13, but agrees with the EuO measurement at 4.2K in Ref. 1 (see footnote 40).
| 67.971 | 37.718 | 84.875 | 2.250 |
| 65.811 | 54.451 | 122.665 | 2.252 |
| 65.036 | 58.690 | 132.312 | 2.254 |
| 64.566 | 60.991 | 136.741 | 2.242 |
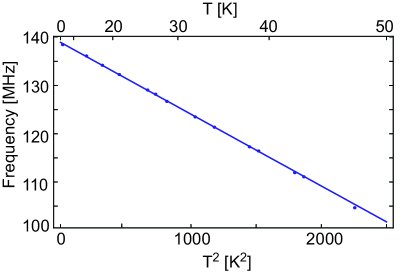
In the low-temperature (spin-wave) regime, both the and the data can be fitted with a simple power-law of the form . For the domain-wall, , data, one obtains a power law with an exponent of , by including all data points, except the one at 47.488K, which is already showing deviation to below the spin-wave curve. Fig 2 shows a plot of the vs. , displaying the excellent fit. When this data set is fit to a power law, one gets MHz, and an of . For the data below K, the best-fit exponent is . When fitted to a straight line as a function of , one obtains MHz and an of 0.99994.
The behavior is in agreement with the expectations of Koebler’s scheme5, wherein it is claimed that all isotropic 3D magnetic systems should exhibit a behavior in the low-temperature region. We disagree with the generalization to all magnets, the prime counter-example being the behavior of CrBr3. (see Ref. 6). However, the spin-wave region behavior of EuO follows the behavior described within the broader semi-empirical scheme devised by Bykovetz6, wherein both 3D and 2D ferromagnets show power-law behaviors depicted in Table 3. The power-law behaviors are derivable from the formula , where , with for 3D and for 2D magnets, where is replaced by . Note that other ferromagnets, e.g., CrI3,17 and the near BCC structured compounds, 2H2O18, exhibit a behavior, not noticed by the original authors19.
| n | D=3 | D=2 | D=1 |
|---|---|---|---|
| 3 | |||
| 2 | |||
| 1 |
The scheme of Bykovetz, if further validated, implies that the conventional Bloch result ( for 3D and for 2D) determines the power-law behaviors, but with an absence of any lattice-dependent effects (i.e., the Dyson term, expected in 3D ferromagnets, is missing). The general implication would be that even in localized-spin magnetic systems such as the europium chalcogenides, the exchange interactions are somehow long-ranged, and/or the spin waves propagate in a spin-density-polarized medium (band). It is well known that a model of ferromagnetism, in which the magnetization can vary continuously (as opposed to having discrete spins at localized sites) results in spin waves that display a pure behavior with no “lattice-correction” terms. The recent optical measurements by Miyazaki, et al.2, suggest that, in fact, the Heisenberg-Dyson picture of localized exchange interactions may not be quite correct.
Last but not least, the measurements above, particularly the 4.2K domain-wall measurement, as well as those of Boyd12, give no evidence of a quadrupole splitting, whereas spin-echo NMR measurements invariably do. An extended discussion of this problem is given in Ref 1. The issue at this point is unresolved. One could conjecture that the domain-wall resonance in CW measurements somehow averages over the electric field gradients. On the spin-echo side, the source of the difficulty may lie in the uncertainties of the multi-layered analyses of the complex spin-echo measurements (see Ref 1).
1A. Comment, J. P. Ansermet, C. P. Slichter, H. Rho, C. S. Snow, and S. L. Cooper, Phys. Rev. B 72
, 014428 (2005).
2H. Miyazaki, T. Ito, H. J. Im, S. Yagi, M. Kato, K. Soda, and S Kimura, Phys. Rev. Lett. 102, 22
7203 (2009).
3C. Kuznia, H. Pink, and W. Zinn, Colloque Ampere XIV (North Holland Publ. Co., 1967), p. 1216.
4N.J. Poulis and G.E.G. Hardeman, Physica 19, 391 (1953).
5U. Köbler, A. Hoser, and W. Schäfer, Physica B, 364, 55 (2005).
6N. Bykovetz, J. Klein, and C. L. Lin, J. Appl. Phys. 105, 07E103 (2009).
7N. Bykovetz, J. Appl. Phys. 55, 2062 (1984).
8N. Bykovetz, Ph.D. Dissertation, University of Pennsylvania (1976).
9B. Menyuk, K. Dwight, and T. B. Reed, Phys. Rev. B 3, 1689 (1971).
10J. Als-Nielsen, O. W. Dietrich, and L. Passell, PR B 14, 4908 (1976).
11P. Heller Phys. Rev. 146, 403 (1966).
12E. L. Boyd, Phys. Rev. 145, 174 (1966).
13P. Heller and G.B. Benedek, Phys. Rev. Lett. 14, 71 (1965).
14A. C. Gossard, V. Jaccarino, J. P. Remeika, J. Appl. Phys. Suppl. 33 1187 (1962).
15All fits in this paper were made using Mathematica.
16G. Groll, Zeitschrift fur Physik A 243, 60 (1971).
17A. Narath, Phys. Rev. 140, A854 (1965).
18E. Velu, J. P. Renard, and B. Lecuyer, Phys. Rev. B 14(11), 5088 (1976).
19The low-temperature data from Ref 18 appear in tabular form in Ref 8.