GRB 090417B and its Host Galaxy: A Step Towards an Understanding of Optically-Dark Gamma-Ray Bursts
Abstract
GRB 090417B was an unusually long burst with a duration of at least 2130 s and a multi-peaked light curve at energies of 15–150 keV. It was optically dark and has been associated with a bright star-forming galaxy at a redshift of 0.345 that is broadly similar to the Milky Way. This is one of the few cases where a host galaxy has been clearly identified for a dark gamma-ray burst and thus an ideal candidate for studying the origin of dark bursts. We find that the dark nature of GRB 090417B cannot be explained by high redshift, incomplete observations, or unusual physics in the production of the afterglow. Assuming the standard relativistic fireball model for the afterglow we find that the optical flux is at least 2.5 mag fainter than predicted by the -ray flux. The Swift/XRT -ray data are consistent with the afterglow being obscured by a dense, localized sheet of dust approximately 30–80 pc from the burst along the line of sight. Our results suggest that this dust sheet imparts an extinction of mag, which is sufficient to explain the missing optical flux. GRB 090417B is an example of a gamma-ray burst that is dark due to the localized dust structure in its host galaxy.
1 Introduction
The Swift observatory (Gehrels et al., 2004) is a multi-instrument satellite mission that was designed to detect and rapidly localize gamma-ray bursts (GRBs). The observatory contains three telescopes: the Burst Alert Telescope (BAT; Barthelmy et al. (2005)), the -Ray Telescope (XRT; Burrows et al. (2005)), and the UltraViolet/Optical Telescope (UVOT; Roming et al. (2005)). The BAT is used to identify GRBs and localize them to in the energy range 15–150 keV. Once the BAT has localized a burst Swift slews to point the XRT and the UVOT at the burst. The XRT obtains rapid -ray localizations to in the energy range 0.2–10 keV while the UVOT obtains localizations to then repeatedly cycles through a set of optical and ultraviolet filters. Over the past five years Swift has detected GRBs at the rate of approximately 100 per year. Almost all of these Swift-detected GRBs have had -ray afterglows, and optical or infrared afterglows have been detected for % of them. The remaining 40% of the Swift bursts have no reported optical or infrared detections. In general between –40% of GRBs are dark GRBs (Fynbo et al., 2009b).
The gamma-ray burst GRB 090417B was detected by the BAT as an image trigger at 13:17:23 UT on 2009 Apr 17 (Sbarufatti et al., 2009). Swift immediately slewed to GRB 090417B and narrow-field observations began observing 387 s (XRT) and 378 s (UVOT) after the BAT trigger. The BAT light curve showed a long period of emission starting 200 s before the trigger (see Figure 1).
Several ground-based follow-up observations were made, but no optical or infrared afterglow was detected. Fynbo et al. (2009a) found a source with inside the XRT error circle (Sbarufatti et al., 2009) and identified it as an SDSS galaxy (Strauss et al., 2002) and the possible host galaxy of GRB 090417B. Berger & Fox (2009) measured a redshift of for this galaxy based on the forbidden oxygen emission lines [O II](3727) and [O III](5006) as well as H emission.
Dark GRBs have been an enduring mystery in the lore of GRB studies. In the pre-Swift era only about one quarter of localized gamma-ray bursts had an optical afterglow (OA) detected (e.g., Fynbo et al., 2001). It was sometimes assumed that this was due to the response times of ground-based optical telescopes which allowed most afterglows to fade before they could be observed. Swift however, with its ability to train the XRT and UVOT on a burst within s of the initial detection, has been able to provide positions to within for most bursts that have been detected by the BAT. The rapid distribution of these positions has allowed ground-based optical and infrared follow-up observations for many of these bursts, often within minutes of the BAT trigger. Even with such rapid follow-up observations no optical or infrared afterglows have been found for 40% of BAT-detected GRBs, thus demonstrating that observational constraints were not the cause to the dark burst problem (Roming et al., 2006).
Several attempts have been made to quantify the dark burst problem by establishing operational definitions of dark bursts (Jakobsson et al., 2004; Rol et al., 2005; van der Horst et al., 2009). Most recently van der Horst et al. (2009) proposed that dark GRBs be defined as those that have measured 11 hours after the burst. They define as the spectral index between the optical and -ray regimes and as the spectral index in the -ray band. The spectral index is defined by where is the flux density at a frequency . This definition assumes that both the -ray and optical afterglows are due to synchrotron radiation from a relativistic fireball. The synchrotron model predicts that the spectral slope will either be the same in both regimes (if there is no cooling break between them) or will differ by (if there is a cooling break between them). A difference of can not be explained in this model and thus requires that something be suppressing the flux at optical wavelengths, resulting in a dark burst (Jakobsson et al., 2004).
Several possibilities have been proposed to explain dark bursts. First, several studies have suggested that dark bursts may be due to extinction along the line of sight, either in the Milky Way or in the host galaxy (e.g., Piro et al., 2002; Levan et al., 2006; Berger et al., 2007; Jaunsen et al., 2008; Tanvir et al., 2008). Perley et al. (2009) suggest that this is the case for most dark GRBs. Further, -ray observations show that some bursts with no optical afterglows have systematically higher H I column densities than those with optical afterglows (Fynbo et al., 2009b). This suggests that dark bursts may be suffering from higher extinction than optically-bright bursts. However, there is significant overlap in the distribution of values between dark and bright bursts, so it is not clear if extinction is the sole parameter responsible for the darkness of these bursts.
Schady et al. (2007, 2009) did panchromatic studies of several GRBs that were observed with Swift’s XRT and UVOT (i.e., optically-bright GRBs) in order to probe the extinction in their host galaxies. They found that the combined -ray/ultraviolet/optical data for most of these GRBs are best fit using a Small Magellanic Cloud (SMC) dust model (Pei, 1992). The extinctions in these galaxies were small, with mag. They also found a mean gas-to-dust ratio of , which is lower than, but similar to, the value found in the SMC ( using equation (4) and Table 2 of Pei (1992)). Kann et al. (2006) also found that the the gas-to-dust ratio for a large sample of host galaxies of optically-bright GRBs is lower than the SMC value. However, the gas-to-dust ratios in the host galaxies of dark GRBs tend to be more like that of the Milky Way than that of the SMC (e.g., Piro et al., 2002; Berger et al., 2007; Jaunsen et al., 2008; Elíasdóttir et al., 2009).
A second possible origin for dark bursts is that they are GRBs located at high redshift, so the Lyman break (or the start of the Lyman-alpha forest) is observed redward of the optical band. The most distant GRB observed to date is GRB 090423 at (Salvaterra et al., 2009; Tanvir et al., 2009), so some of the dark bursts could simply be at high redshift. However, Fynbo et al. (2009b) have found that less than approximately 19% of GRBs have , whereas between 25% and 42% of GRBs are dark. Therefore, it is unlikely that all of the Swift dark burst lie at very high redshifts. The affects of relativistic beaming of GRB emission at very high redshift is poorly understood due to a lack of data on high-redsift bursts. We assume here that it does not affect our discussion in this paper.
Third, the hypothesis that afterglow radiation is synchrotron radiation may be wrong. This could lead to a different spectrum from what is expected from the relativistic fireball model, in which case the above definition of a dark burst is invalid.
Long–soft GRBs (Kouveliotou et al., 1993) tend to be found in host galaxies that are small, irregular, and have high specific star-formation rates (Christensen et al., 2004). Le Floc’h et al. (2003) found a median infrared luminosity of for the host galaxies of GRBs with optical afterglows and conclude that most hosts are sub-luminous at optical and near-infrared wavelengths. These GRB hosts tend to be small galaxies that have intrinsic luminosities similar to those of the dwarf galaxies in the Local Group. However, some hosts are significantly larger, such as that of GRB 990705 (Le Floc’h et al., 2002), which was an Sc spiral with . To date no long–soft GRB has been found in an elliptical galaxy. All of the hosts of long–soft GRBs have morphologies that are consistent with either exponential discs, or irregular structure (Conselice et al., 2005; Wainwright et al., 2007). GRB hosts follow the size–luminosity relation (e.g., Trujillo et al., 2006) and extend it towards lower luminosities (Wainwright et al., 2007). In spite of their generally small size the host galaxies of long–soft GRBs tend to have high specific star-formation rates (SSFRs). Savaglio et al. (2009) found a median SSFR of 0.8 yr-1, similar to what is seem in Lyman-break galaxies.
It is important to realize, however, that these properties have been determined using GRBs that have usually been localized to sub-arcsecond precisions. In practice this usually means that the sample of GRB host galaxies is restricted to GRBs that have had optical afterglows. The host galaxies of dark GRBs may have different properties. Perley et al. (2009) identify host galaxies for 14 dark GRBs and found that they have the same redshift distribution as the hosts of optically-bright GRBs. They also found that these hosts do not appear to be significantly different in size, structure, or luminosity from the hosts of GRBs with optical afterglows. They did find that a significant fraction of the hosts of dark bursts show evidence for high internal extinction (–5 mag). However, many of their host associations are uncertain, with more than half of the galaxies having a probability of a chance association on the sky of . As we will show in this paper GRB 090417B is located from the centre of a bright galaxy with a probability of a chance association of only . This makes GRB 090417B one of the strongest associations of a dark GRB with a host galaxy.
In this paper we present space- and ground-based gamma-ray, -ray, ultraviolet, and optical observations of GRB 090417B and its host galaxy. We have adopted a standard CDM cosmology with a Hubble parameter of km s-1 Mpc-1, a matter density of , and a cosmological constant of . For this cosmology a redshift of corresponds to a luminosity distance of 1.806 Gpc and a distance modulus of 41.29 mag. One arcsecond corresponds to 6.51 comoving kpc, or 4.84 proper kpc. The look back time is 3.80 Gyr.
2 Data
2.1 BAT Data
The BAT scaled-map, event and DPH data were reduced using the standard BAT software available through HEASARC111http://swift.gsfc.nasa.gov/docs/software/lheasoft/download.html.
The duration of GRB 090417B was s in the 15–150 keV band. The light curve evolved gradually, and there were no features in the unimaged count rates that might indicate how long the burst persisted in the BAT energy range past that time. Even at that lower limit on , this was the longest GRB ever seen by BAT or BATSE (Fishman et al., 1988), although GRB 060218 approached this duration with (Campana et al., 2006).
The BAT light curve for GRB 090417B showed four broad, overlapping peaks in the flux at approximately , , , and s, as shown in Figure 1. The 1-s peak flux of photons cm-2 s-1 in the range 15–350 keV was approximately s. The total fluence from to s was erg cm-2 in the 15–150 keV band. The spectrum was best fitted by a simple power-law function with an average photon index of . The index did not change significantly during the burst. All the above uncertainties are at 90% confidence.
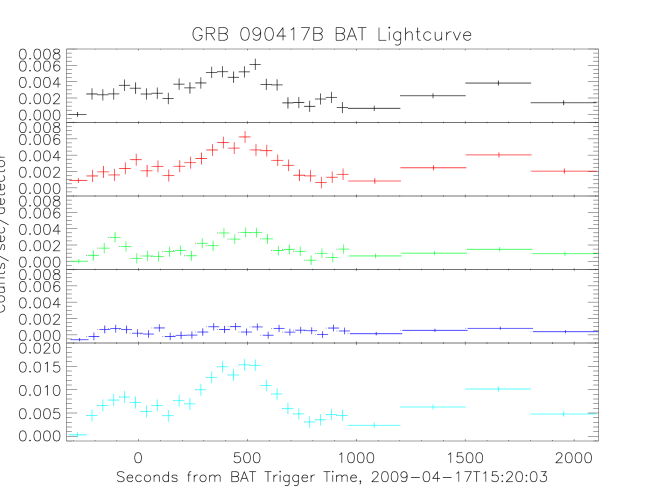
The most impressive characteristic in the prompt emission of GRB 090417B was its extreme length. The burst was marginally above background () on the 64-s interval starting immediately after a pre-planned slew maneuver ended at seconds, although not at a high enough level to be detectable independent of the later emission. From that time, the flux increased steadily, to be detected as a point source on-board on the interval to s, and finally as a sufficiently significant source to trigger a burst response on the interval to s. Although it appeared to be declining toward background levels, the burst continued to be detected until the spacecraft slewed away due to the changing Earth constraint at s.
2.2 XRT Data
2.2.1 Data Reduction
The XRT on board Swift began observations on 2009 April 17 at 15:26:33 UT, 387 s after the BAT trigger (Sbarufatti et al., 2009), and ended on 2009 May 5, with a total net exposure of 1456 s in Windowed Timing mode (WT) and 83.36 ks in Photon Counting mode (PC). The XRT observations are listed in Table 1.
| Sequence | Start Time | End Time | Start time11Time since BAT trigger. | End Time11Time since BAT trigger. | Obs. Mode22WT, window timing mode; PC, photon counting mode | Exposure |
|---|---|---|---|---|---|---|
| UT | UT | (s) | (s) | (s) | ||
| 00349450000 | 2009-04-17 15:26:40 | 2009-04-17 23:29:46 | WT | |||
| 00349450000 | 2009-04-17 15:38:43 | 2009-04-17 23:33:26 | PC | |||
| 00349450002 | 2009-04-18 10:29:48 | 2009-04-18 11:07:52 | PC | |||
| 00349450003 | 2009-04-18 16:57:16 | 2009-04-18 20:20:44 | PC | |||
| 00349450006 | 2009-04-19 01:17:02 | 2009-04-19 12:50:57 | PC | |||
| 00349450007 | 2009-04-20 04:41:58 | 2009-04-20 22:26:57 | PC | |||
| 00349450008 | 2009-04-21 14:13:55 | 2009-04-21 23:59:56 | PC | |||
| 00349450009 | 2009-04-22 04:29:42 | 2009-04-22 14:20:47 | PC | |||
| 00349450010 | 2009-04-23 00:07:52 | 2009-04-23 22:40:57 | PC | |||
| 00349450011 | 2009-04-24 00:18:14 | 2009-04-24 22:57:56 | PC | |||
| 00349450012 | 2009-04-25 11:39:16 | 2009-04-25 23:01:57 | PC | |||
| 00349450013 | 2009-04-26 02:11:18 | 2009-04-27 23:12:56 | PC | |||
| 00349450014 | 2009-04-27 00:40:17 | 2009-04-27 21:39:56 | PC | |||
| 00349450015 | 2009-04-28 00:37:57 | 2009-04-28 23:20:56 | PC | |||
| 00349450016 | 2009-04-29 00:41:42 | 2009-04-29 23:26:57 | PC | |||
| 00349450017 | 2009-05-01 00:40:42 | 2009-05-02 23:37:57 | PC |
The XRT data were processed using the FTOOLS software package distributed inside HEASOFT (v6.6.3). We ran the task xrtpipeline applying calibrations and standard filtering criteria. Events with grades 0–2 and 0–12 were selected for WT and PC data respectively. The analysis was performed inside the 0.3–10 keV energy band.
The best position for the afterglow was obtained using 6972 s of overlapping XRT Photon Counting mode data and 9 UVOT -band images in order to correct the XRT astrometry making use of the XRT–UVOT alignment and matching to the USNO-B1 catalogue, as described by Goad et al. (2007) and Evans et al. (2009). Our best position is RA(J2000.0) = (13:58:46.62), Dec(J2000.0) = (+47:01:05.4) with an error of (90% confidence, including boresight uncertainties).
2.2.2 Temporal Analysis
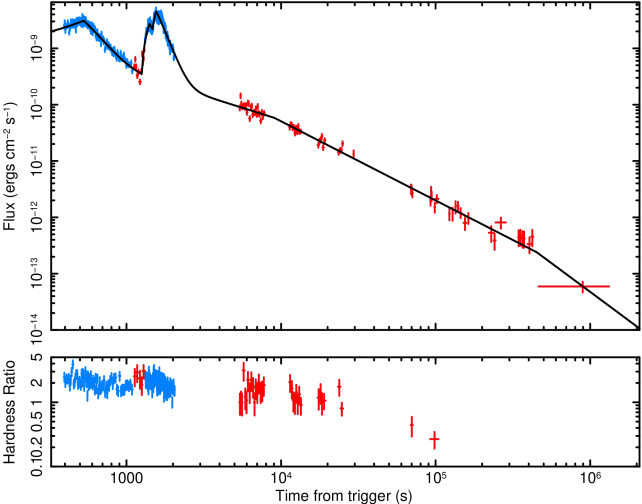
Source photons were extracted from a region with a 30 pixel radius (1 pixel = ), with the exception of PC mode data for sequence 00349450000 where we used an annular region with radii 3 pixel and 30 pixel in order to correct for pile-up. The background was estimated from a circular region with a 50 pixel radius located away from any detected source in the field. When the count-rate dropped below the level of count s-1 we used the SOSTA tool of ximage, which corrects for vignetting, exposure variations and PSF losses within an optimized box, using the same background region. The 0.3–10 keV light curve thus obtained is shown in Figure 2 (top panel). The light curve has been rebinned in order to achieve a minimum signal-to-noise ratio (S/N) of 3 for each point. The best fit to the light curve is given by a doubly broken power law with indices , , and , and breaks at s and s. The second break could be interpreted as a jet break. However the lack of an optical detection for this burst does not allow us to confirm or deny this hypothesis. Also see § 4.3 for an alternate interpretation of the late-time steepening of the -ray light curve.
The first sequence of -ray data is dominated by a strong flare. There is a rise that began before the start of XRT observations and peaked around s. This is followed by a double-peaked flare which started at s, peaked at s and s, and had a decay time of 240 s. Further flaring activity is apparent up to at least s. The bottom panel of Figure 2 shows the hardness ratio for the afterglow measured using the 0.3–2 and the 2–10 keV bands. The first orbit (up to ) shows a hard hardness ratio with spectral evolution that follows the flaring activity. The same is true for the remaining observations, with the hardness ratio slowly decreasing with time.
2.2.3 Spectral Analysis
In order to detect possible spectral variations we extracted spectra separately for the two flares, the early decay part from s to s, the steep decay from s to s, and the late decay from s to the end of observations. Source and background spectra were extracted using the same regions used for the light curves, with the exception of the late decay spectrum where the count rate was too low to group the energy channels in order to have a Gaussian distribution of the number of photons per grouped channel. Hence, for this spectrum we replaced the statistic with the statistic (Cash, 1979), which can be used whenever the Gaussian approximation is not valid, provided that the contamination from background photons is negligible. To ensure this, we extracted photons from a region with a 10 pixel radius.
The ancillary response files were generated using the task xrtmkarf, and with the exception of the late decay spectrum we grouped channels in order to have at least 20 photons per bin. Spectral fitting was performed using XSpec (v11.3.2). For each spectrum we modelled the Galactic absorption using a warm absorber with neutral hydrogen column density cm-2 (Kalberla et al., 2005) and included an intrinsic warm absorber at the redshift of the host galaxy (). The best model for the spectra of the flares was a power law with a high energy cutoff, while for the remaining parts of the afterglow the best fit was obtained using a single power law. The best fit parameters are given in Table 2.
| Start time11Time since BAT trigger. | End Time11Time since BAT trigger. | Cutoff Energy | Mean Flux | d.o.f. | ||
|---|---|---|---|---|---|---|
| (s) | (s) | ( cm-2) | (keV) | (erg cm-2 s-1) | ||
| 446/421 | ||||||
| 604/523 | ||||||
| 39/45 | ||||||
| 15/29 | ||||||
| 13/22 | ||||||
| 32/2422-statistic/bins |
The fact that the first phases of the XRT observations are best fitted by a cutoff power law with the cutoff energy around 3 keV indicates that the peak energy of the flares was passing through the XRT band at the time. After the flares the spectrum is described by a power law with photon index of . After the first break, up to ks, the spectrum is described by a power law with similar parameters ( and an absorbing column cm-2). At later times the spectrum softens significantly to a photon index of and shows no significant variations across the break at s up to the end of the observations.
The intrinsic absorbing column is in the range cm-2. From our analysis of the spectral energy distribution (§ 3.2) we find that the best fit to the data is given by a Milky Way extinction law instead of the SMC-like extinction law found in many GRB host galaxies. Therefore, we use the relationship between and extinction in the Milky Way from Predehl & Schmitt (1995) to find that the observed absorbing column corresponds to an extinction mag. This high value for the extinction in the host along the line of sight to the burst is capable of explaining the dark optical nature of this event.
2.3 UVOT Data
The Swift/UVOT began observations 378 s after the BAT trigger (Sbarufatti et al., 2009) with a 9 s settling mode exposure using the filter. This was followed by a sequence that rotated through all seven of UVOT’s lenticular filters. The first of these exposures was a 147 s exposure starting at 395 s taken with the white filter. Observations continued until 1 325 874 s (= 15.3 days) after the trigger using primarily the and ultraviolet filters. No optical or ultraviolet afterglow was detected in any of the UVOT data. Once it was determined that there was no optical or ultraviolet afterglow for GRB 090417B UVOT observed primarily with its ultraviolet filters in order to obtain ultraviolet magnitudes for the nearby galaxy that can not be obtained from ground-based observatories.
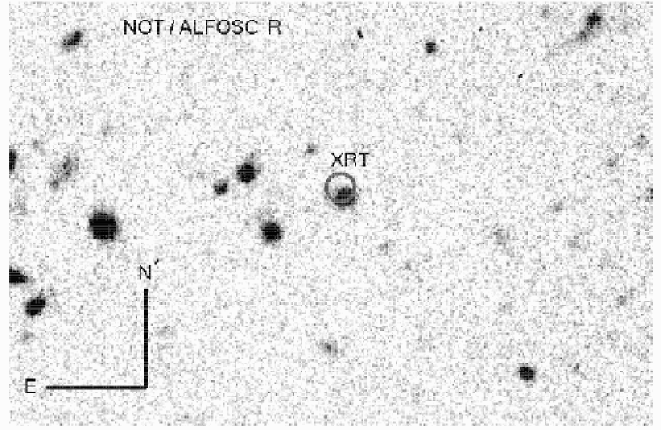
The SDSS galaxy noted by Fynbo et al. (2009a) is detected when we coadd the UVOT images. We determined a centroid for the SDSS galaxy of RA, Dec = 13:58:46.66, +47:01:04.4 (J2000.0) with an estimated internal uncertainty of and an estimated systematic uncertainty relative to the USNO-B1.0 catalogue of (Breeveld et al., 2010). These uncertainties are the 90% confidence intervals. This galaxy is southeast of the centre of the UVOT-enhanced XRT error circle. The field of GRB 090417B is shown in Figure 3. The SDSS galaxy is well-isolated from other sources in the field, so there is no contamination from neighbouring sources when doing aperture photometry.
We obtained the UVOT data from the Swift Data Archive on 12 May 2009. This data has had bad pixels identified, mod-8 noise corrected, and has been transformed into FK5 coordinates. We used the standard UVOT data analysis software distributed with HEASOFT 6.6.2 along with the standard calibration data. Photometry was done on the SDSS galaxy using uvotsource with a circular source aperture of radius for the source region and a circular aperture of radius centred at RA, Dec = 13:58:47.57, +47:00:33.3 (J2000.0) for a background region. The background region was selected to have similar background properties to those at the location of the galaxy, and to be free of contaminating sources. The UVOT photometry of the SDSS galaxy is presented in Table 3. We find no evidence for any change in the magnitude of the galaxy, in any filter, during the course of the UVOT observations. Our photometry was calibrated to the UVOT photometric system described in Poole et al. (2008).
| Filter | Exposure | Mag | Err |
|---|---|---|---|
| 1237 | 20.9 | ||
| 862 | 21.4 | ||
| 22 554 | 23.09 | 0.38 | |
| uvw1 | 10 850 | 23.12 | 0.56 |
| uvm2 | 15 942 | 22.49 | 0.29 |
| uvw2 | 30 827 | 22.69 | 0.19 |
| white | 841 | 22.2 |
The UVOT-enhanced XRT position for GRB 090417B is RA = 13:58:46.62, Dec = +47:01:05.4 (J2000.0) which corresponds to Galactic coordinates of . The line-of-sight Galactic reddening in this direction is mag (Schlegel et al., 1998). This corresponds to extinctions in the UVOT filters of of , , , , , and , and mag.
Since there is a candidate host galaxy for GRB 090417B it is not possible to put a direct faint limit on the luminosity of the optical afterglow beyond the observed magnitude of the galaxy itself ( Fynbo et al. (2009a)). In order to constrain the maximum possible luminosity of the afterglow we used the UVOT data to look for variability in the galaxy’s magnitude. To do this we divided the data into early and late epochs. The early epoch consisted of all the UVOT data taken during Swift’s initial automated observations of GRB 090417B (OBSID 00349450000), which covers times up to 29 604 s ( 8 hr) after the BAT trigger. This is the period when the optical afterglow is expected to be brightest. The late epoch included all observations later than this. The UVOT exposures for each epoch were coadded to produce two deep images for each UVOT filter. We photometered the galaxy in each image and recorded the difference between the two magnitudes. If we assume that the first epoch magnitude is due to the host+afterglow and the second epoch magnitude is due to the host alone then the difference between these two magnitudes puts an upper limits on the luminosity of the afterglow. We find no evidence for any change in the magnitude of the host galaxy between the first and last epochs larger than mag. Therefore, the afterglow could not have contributed more light than what corresponds to a 0.2 mag increase in luminsity. From this we obtain the following constraints on the magnitude of the optical afterglow at 4 hr (= 14 800 s) after the BAT trigger: , uvw1, uvm2, and uvw2. The uncertainty in these estimates is about 1.0 mag.
2.4 Nordic Optical Telescope Data
We obtained optical images of GRB 090417B on 2009 Apr 17–18 with the ALFOSC-FASU mounted on the Nordic Optical Telescope (NOT). ALFOSC-FASU was operated in its high gain state (0.726 e-/ADU). The read-out noise was 3.2 e-/pixel and the pixel scale was /pixel. The NOT -band image is shown in Figure 3. Data reduction was done following the standard procedure for optical CCD data and the individual images were aligned by centroiding on several stars in each exposure. Photometry was performed on the combined NOT images using SExtractor (Bertin & Arnouts, 1996). We calibrated the data using the standard ALFOSC zero points222http://www.not.iac.es/instruments/alfosc/zpmon/. We find (Bessel ), (Bessel ), and (interference ) for the SDSS galaxy. The Galactic extinctions for the NOT data are , , (Schlegel et al., 1998), and 333http://irsa.ipac.caltech.edu/applications/DUST/.
3 The Host Galaxy
3.1 Probability that the SDSS Galaxy is the Host
We used the methodology of Bloom et al. (2002) to estimate the probability that a galaxy would lie within of the centre of the XRT error circle by chance, . This assumes that galaxies are randomly distributed on the sky and that there is no clustering. This assumption is not formally correct as galaxies do cluster. However, an examination of the field of GRB 090417B suggests that this GRB did not occur in a significant over-density of background galaxies, so distortions in the computed value are likely to be small. Bloom et al. (2002) use the galaxy number counts of Hogg et al. (1997) to generate the surface density of galaxies with magnitudes brighter than some limiting magnitude. In this case the band is for the Keck 10-m Low Resolution Imaging Spectrometer (LRIS) filter. We adopt (§ 2.4) as the magnitude of the SDSS galaxy. Using the Bloom et al. (2002) formula for an error circle containing a galaxy this yields . This is a fairly small value, which suggests that SDSS J135846.65+470104.5 is likely to be the host galaxy of GRB 090417B.
A chance alignment probability of is large enough that one can not rule out the possibility of a misidentification. A visual examination of the NOT images shows that the XRT error circle includes a significant fraction of the SDSS galaxy (see Figure 3). The observed separation between the -ray afterglow and the centre of the galaxy is . At a redshift of this corresponds to a projected separation of 5.23 proper kpc. The galaxy appears point-like in all of our data. The NOT -band data has a seeing FWHM of , which represents an upper limit on the effective radius of the galaxy of proper kpc Berger et al. (2009) found for the galaxy, which implies an absolute magnitude of . This puts the galaxy inside the observed range of GRB host sizes and luminosities (see Fruchter et al. (2006), their Fig. 4).
In order to test our hypothesis that SDSS J135846.65+470104.5 is the host galaxy of GRB 090417B we obtained the Chandra observations of the -ray afterglow that were taken on 2009 May 11, 24 days ( s) after the burst (Proposal Number: 10900117, PI: Andrew Levan). An -ray source (consistent with the XRT position) is clearly detected at the position of the SDSS galaxy. The observed flux from this source is consistent with the -ray flux that is predicted from the XRT light curve assuming a power-law decay with . This suggests that the Chandra source is the -ray afterglow of GRB 090417B, and that there is minimal (if any) contamination from the galaxy.
Taken together these arguments strengthen the case that SDSS J135846.65+470104.5 is the host galaxy. Therefore, we conclude that we have identified the host of the dark burst GRB 090417B to a high degree of confidence.
3.2 Spectral Energy Distribution
We used the combined ultraviolet, optical, and infrared photometry of the SDSS galaxy to determine its spectral energy distribution (SED). Photometry for this galaxy was taken from our observations, the SDSS Web site444http://www.sdss.org/DR7/, and the various GCN Circulars on this burst, and is listed in Table 3.2. We used XSpec to fit a power law to the observed SED. The best fit, with no host extinction, has a power-law index of . However, the goodness of fit is only , which is very poor. Therefore, we also tried including extinction due to dust in the host galaxy when fitting the SED. Dust laws for the Small Magellanic Cloud, Large Magellanic Cloud and the Milky Way were tried. These led to a significant improvement in the goodness of fit with the best fit being found for Milky Way extinction in the host galaxy. Our best fit has a spectral index of , and a host extinction of .
| Filter | Mag | Err | Source |
|---|---|---|---|
| uvw2 | 22.69 | 0.19 | 1 |
| uvm2 | 22.49 | 0.29 | 1 |
| uvw1 | 23.12 | 0.56 | 1 |
| 23.09 | 0.38 | 1 | |
| 23.23 | 0.53 | 2 | |
| 21.4 | 1 | ||
| 23.25 | 0.13 | 1 | |
| 22.02 | 0.16 | 2 | |
| 22.47 | 0.16 | 3 | |
| 20.9 | 1 | ||
| 21.34 | 0.03 | 1 | |
| 21.9 | 0.3 | 4 | |
| 21.62 | 0.09 | 2 | |
| 21.62 | 0.10 | 3 | |
| 20.82 | 0.07 | 1 | |
| 21.41 | 0.11 | 2 | |
| 21.31 | 0.12 | 3 | |
| 20.78 | 0.25 | 2 | |
| 21.49 | 0.30 | 3 | |
| 20.0 | 5 | ||
| 18.5 | 5 |
3.3 Luminosity and Star-Formation Rate
SDSS J135846.65+470104.5 has a colour of , making it a fairly red galaxy. The typical absolute magnitude for a red galaxy at is (Lilly et al., 1995), assuming a cosmology with . For our adopted cosmology that corresponds to . At the rest-frame band corresponds roughly to the observed band. Assuming that the galaxy has a power-law spectrum (see § 3.2) and , then it has a rest-frame luminosity in the band of where is the rest-frame -band luminosity of a typical red galaxy at . This indicates that the host is approximately an galaxy with a total luminosity that is roughly similar to that of the Milky Way. However, we stress that this result is somewhat uncertain because is highly correlated with the slope of the faint end of the galaxy luminosity function, and with its normalization (Lilly et al., 1995).
We can estimate the star-formation rate in the host galaxy using Eq. 2 of Madau et al. (1998). At the redshift of the burst 1500 Å approximately corresponds to the UVOT uvw2 filter while 2800 Å approximately corresponds to the SDSS filter. Correcting for Galactic extinction these magnitudes for the host become uvw2 and . These yield star-formation rates (in yr-1) of 0.3 (1500 Å) and 0.7 (2800 Å) assuming a Salpeter (1955) initial mass function, and 0.6 (1500 Å) or 1.2 (2800 Å) assuming a Scalo (1986) initial mass function. These values assume that there is no extinction in the host galaxy. This is clearly not correct, so they actually represent a lower limit on the star-formation rate of approximately 1 yr-1. Correcting for the mean extinction in the host ( mag) gives a star-formation rate of yr-1. However, this corrected values should be treated with caution since extinction in the host is likely to be highly variable and may not be affecting all star-forming regions equally.
The host galaxy appears to be roughly similar in luminosity to the Milky Way, but with a significantly higher star-formation rate. This puts it on the massive end of the GRB host galaxy distribution.
4 The Gamma-Ray Burst and its Afterglow
4.1 Is GRB 090417B a Dark Burst?
No afterglow has been detected for GRB 090417B at infrared, optical, or ultraviolet wavelengths. Changes in the near-ultraviolet flux from the host galaxy between early and late times are consistent with no contribution from an afterglow down to a limiting magnitude of . We are assuming that the bright limit on the afterglow magnitude is valid for all time after four hours after the BAT trigger. There is no evidence for a brightening of the host galaxy at late times, so this is a reasonable assumption. Therefore we adopt this as an upper limit to the luminosity of the afterglow at 11 hr and compare it to the -ray flux at 11 hr. This yields , making it a dark burst (Jakobsson et al., 2004). The -ray spectrum at this time is evolving from to , so using the definition of van der Horst et al. (2009) we find that , also making GRB 090417B a dark burst. Our limit on is somewhat uncertain due to the large uncertainty in our estimate of . However, for GRB 090417B to be an optically bright burst by the definition of (Jakobsson et al., 2004) then the optical afterglow would have had to have had , which is inconsistent with the observed host+afterglow magnitude ().
Our computation of the spectral index between the optical and -ray regimes depends on the limiting magnitude of the afterglow in the UVOT band as determined from the statistical error in the observed magnitude of the host galaxy at two epochs. In order to test that GRB 090417B really is a dark burst we compute the expected UVOT -band magnitude for the afterglow given the observed -ray spectrum and assuming that the cooling frequency is between -ray and optical wavelengths. This yields a prediction of at 11 hours, which is ruled out by the observations. Therefore, we conclude that GRB 090417B is a dark GRB.
The difference between the predicted magnitude and the upper limit that we derive in § 2.3 is mag. If we assume a Milky Way extinction law this corresponds to mag of extinction in the host galaxy along the line of sight to the burst.
4.2 Closure Relations
If we assume the canonical -ray light curve for GRB afterglows (Nousek et al., 2006; Zhang et al., 2006) then we can use the temporal decay indices and the spectral slopes to constrain the underlying physics. We stress that the following analysis is only valid if we assume the relativistic fireball model. Alternate models for the -ray afterglows of GRBs are available, such as the cannonball model (Dar & De Rújula, 2000a, b; Dado et al., 2002a, b), the disc model of Cannizzo & Gehrels (2009), the late internal emission model (Ghisellini et al., 2007; Kumar et al., 2008), the long-lived reverse shock model (Genet et al., 2007; Uhm & Beloborodov, 2007), and the prior outflow emission model (Yamazaki, 2009; Liang et al., 2009).
The time and post-break decay index of the late-time break in the -ray light curve at s after the BAT trigger are consistent with a jet break. However, the dust scattering interpretation of the late-time spectral softening (see § 4.3) suggests that the steepening of the light curve after s is due to scattered emission due to dust dominating over the synchrotron component of the afterglow. Unfortunately there is no data in other wavelength regimes to test if the late-time steepening is achromatic (which would argue for a jet break), therefore it is uncertain if this is a jet break.
Sari et al. (1999) give the relationships between the temporal and spectral slopes and the electron power-law distribution index, , for a blast expanding into a homogeneous external medium, and Chevalier & Li (1999) give the relationships for a stellar wind () environment. Both of these papers assume that . For the case were the relationships of Dai & Cheng (2001) are used. Panaitescu & Kumar (2002) found that GRB afterglows exhibit a range of electron distributions with values for the ten GRBs they studied being between and .
The -ray spectral index during the first part of phase III of the afterglow ( s) is . If the cooling frequency is above the -ray regime during this time then the predicted electron index is , which is well outside the range of values found by Panaitescu & Kumar (2002). If the cooling frequency is below the -ray band during this time then , which is consistent with the Panaitescu & Kumar (2002) range of electron indices. For the spectral index predicts a temporal decay of for either a homogeneous interstellar medium (ISM) or a stellar wind environment. The observed -ray decay during this time is , which is consistent with the predicted value. Therefore, we conclude that the cooling frequency is most likely below the -ray band at s. Unfortunately it is not possible to tell, from the -ray data, if the burst is expanding into a uniform external medium or a pre-existing stellar wind. The broad agreement between and with the predictions of the fireball model suggests that this is a reasonable explanation for the physics of this afterglow during this phase of the afterglow.
Between 68 980 s and 428 400 s the spectral index softens to . In this interval the fireball model predicts for a homogeneous ISM and a wind if . If then the environment must be windy (since is increasing) and is predicted to be . The observed value is . Neither case is consistent with the data in this time interval.
The data before 68 980 s is broadly consistent with a relativistic fireball expanding into either a homogeneous ISM or a wind-stratified external medium, and a cooling frequency below the -ray band in the period s. However, this model can not explain the data later than 68 980 s. Some other physical process is needed to explain the late-time softening of the -ray spectrum.
4.3 Dust Scattering
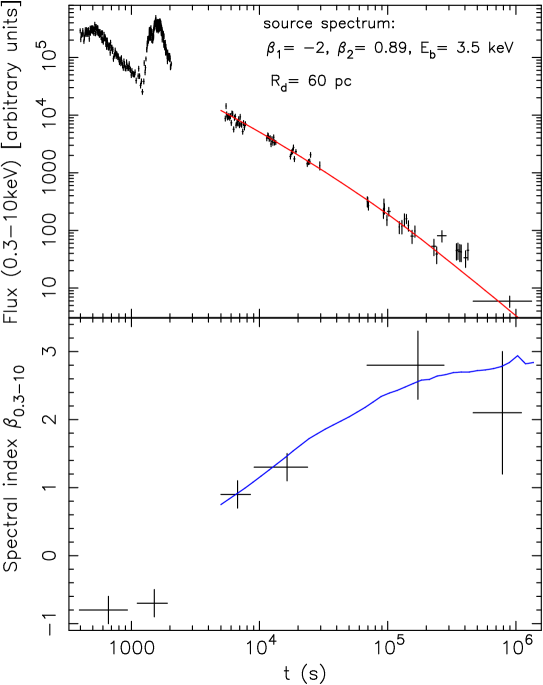
For GRBs occurring in dusty star forming regions, the -rays emitted during the prompt phase may be scattered by dust grains in small angles, which leads to a delayed -ray afterglow component (Mészáros & Gruzinov, 2000). Placing circumburst dust at 10–100 pc away from the burst, the calculated dust echo -ray lightcurve displays a shallow decay lightcurve followed by late steepening, as is commonly observed in many GRBs (Shao & Dai, 2007; Shao et al., 2008). One major feature of this model is the strong spectral softening evolution in the echo emission (Shen et al., 2009). Such a softening feature has not commonly been observed in the majority of GRBs, so the dust scattering model is not favored to interpret those bursts. However, GRB 090417B shows a spectral softening during the shallow decay phase. Also the optically dark nature of the afterglow suggests that there is a substantial amount of dust in the circumburst environment. All these make this burst a very probable candidate for the dust scattering model. In modeling this burst, we assume a dust sheet with distance from the burst, with other dust grain properties the same as in Figure 1 of Shen et al. (2009). We find the calculated light curve can reproduce quite well the XRT light curve from s to s (we consider the flares prior to this time as not being due to dust scattering because the -ray emission was still on at that time) for 30–80 pc and for a broad range of the source emission spectral index values.
A strong test of the model is whether the spectral index evolution can be reproduced. In Figure 4 we plot the temporal evolution of the observed XRT spectral index. The dust scattered emission spectral index is calculated in the same way as in Shen et al. (2009). The amount of softening predicted by the model is large, i.e., 3–4, and it is independent of the source (prompt) emission spectral index. We tried to use the reported prompt BAT spectral index, , and the even harder spectral indices observed in the two -ray flares ( s), , as the source -ray spectral index, but found that the model predicted emission is significantly softer than what is observed. However, if one assumes an even harder spectral index of for the prompt -rays, both the -ray light curve and spectral evolution can be properly reproduced (see Figure 4). Such a hard -ray spectrum is consistent with the self-absorbed regime of a synchrotron or inverse Compton scattering spectrum. We therefore assume that the GRB prompt emission spectrum has a break above the -ray band due to the self-absorption frequency, , below which the spectrum has or (e.g., Granot & Sari, 2002). A large is possible if the prompt emission radius is small enough (e.g., Shen & Zhang, 2009). The best model fit to the lightcurve and the spectral evolution is shown in Figure 4. The fit to the -ray light curve has a reduced of 2.7, and the fit to the spectral index evolution has a reduced of 1.5.
We also estimate the amount of dust in terms of , the scattering optical depth to the 1 keV photons, using the same formula as in Shen et al. (2009). The source -ray fluence is extrapolated from the observed -ray fluence using the assumed spectral form, and the scattered emission -ray fluence is estimated from the observed XRT fluence for s using an intermediate value of observed spectral index . We find . This means that over half of prompt 1 keV photons would be scattered by the dust. This value also implies mag, according to some empirical relations between the two dust properties used in Shen et al. (2009). This is much higher than the average value for the host galaxy that was derived from the spectral energy distribution in Section 3.2, but is consistent with the extinction derived from the -ray measurement of the hydrogen column along the line of sight to the burst, mag. This high line-of-sight extinction naturally explains the non-detection of an optical afterglow for GRB 090417B. Our model indicates that the dust grain column density along the line of sight is cm-2, and the density of the intervening dust sheet is cm-3.
The data of GRB 090417B is consistent with the dust scattering model under the condition that the prompt -rays have a self-absorbed spectrum in the -ray range. The large amount of dust inferred from the -ray modeling is consistent with the dark nature of the optical afterglow.
4.4 Energetics of the Burst
BAT observations of GRB 090417B were cut off at approximately 2105 s after the BAT trigger when Swift went into an Earth limb constraint. Therefore the total duration, and thus the total fluence, of the burst is not known. However, the fluence while the burst was observed was erg cm-2 in the 15–150 keV band. This puts a lower limit on the total fluence. We can use this lower limit to estimate a lower limit on the isotropic equivalent energy of GRB 090417B. The BAT spectrum is best fit by a single power law, so at a redshift of this corresponds to an isotropic equivalent energy of erg. We performed a correction following the prescription of Bloom et al. (2001) and find (with some uncertainty due to the arbitrary choice of cut-off energy for the power-law spectrum). This yields a -corrected total isotropic energy of erg in the 20–2000 keV band. Our data does not allow us to constrain the time of a jet break, so we are unable to estimate the jet opening angle or the intrinsic gamma-ray energy of GRB 090417B.
4.5 Constraints on a Supernova Component
To date no supernova signature has been seen for any dark GRB. If a supernova were detected in a dark GRB that would have profound implications for origin of that dark burst. The detection of a supernova would indicate that the burst was not dark due to extinction or high redshift, but must have a fundamentally different afterglow than conventional optically-bright bursts. In light of this we examined our data to see if there is any evidence for a supernova component for GRB 090417B.
UVOT observations were taken up to 15 days after the BAT trigger, so we searched this late-time data for evidence of a supernova component. A type Ib/c supernova like SN1998bw (Patat & Piemonte, 1998) at a redshift of is expected to peak at approximately days after the burst. We find no evidence for a change in the luminosity of the host galaxy down to mag, which corresponds to a upper limit on the magnitude of the supernova of . At the central wavelength of the UVOT band corresponds to Å. No observational data is available for the peak magnitude of SN1998bw at 2600 Å. However Swift/UVOT ultraviolet light curves are available for SN2007Y (Brown et al., 2009), a SN Ib/c with a peak absolute magnitude of uvw1 in the rest frame. This corresponds to a rest frame uvw1 of at the redshift of GRB 090417B. This is similar to our limiting magnitude, so if we assume that SN2007Y is typical of the SNe Ib/c associated with GRBs we are not able to constrain the existence of a supernova associated with GRB 090417B.
5 Discussion
All of the evidence presented in this paper points to GRB 090417B being a dark burst because of localized extinction in the host galaxy. The host galaxy has a redshift of , and is clearly seen at optical and ultraviolet wavelengths. Therefore Lyman- absorption can not account for the missing optical afterglow. The -ray light curve and spectrum during the first ks obey the conventional closure relationships and are consistent with synchrotron radiation from a relativistic fireball expanding into an external medium (although the structure of that medium can not be determined with the available data). Optical afterglows have been detected for many GRBs with similar -ray properties, so it unlikely that the lack of an optical detection is due to unusual physics during the afterglow phase of the burst. Optical observations of GRB 090417B started 378 s after the BAT trigger, and follow-up observations were made from several observatories for several days after the burst. These observations went deep enough to have detected an optical afterglow if one had been present with a luminosity similar to that of other optical afterglows. Therefore, the dark nature of GRB 090417B can not be explained by a lack of observations.
The dust hypothesis, however, can explain this dark burst. The -ray spectrum is consistent with an H I column density of cm-2, which corresponds to an extinction of mag along the line of site in the host galaxy, assuming a Milky Way extinction law as explained in § 2.2. This value is in agreement with the minimum extinction, as explained in § 4.1, that is needed to obscure the expected bright optical afterglow ( mag). An extremely high extinction (–40 mag) is also predicted by the dust scattering model, which is consistent with the -ray data. Such a large amount of dust along the line of sight to the GRB naturally explains the lack of any detection at ultraviolet, optical, or near-infrared wavelengths while allowing a conventional -ray afterglow to be observed. It is also consistent with the result of Perley et al. (2009) who found large mean extinctions for the putative host galaxies of several GRBs. Our result, that the extinction along the line of sight in the host GRB 090417B is likely to be at least ten magnitudes in the UVOT band, provides strong evidence that local dust concentrations in the host galaxy are responsible for at least some low-redshift dark bursts.
Unlike many GRB host galaxies the dust in the host galaxy of GRB 090417B appears to follow a Milky Way extinction law. In addition the host appears to be an galaxy with a star-formation rate that exceed yr-1. In other words, the host appears to have dust properties, and a luminosity that are similar to those of the Milky Way, and a star-formation rate that is consistent with what is seen in other GRB host galaxies.
GRB 090417B is one of the few dark GRBs where the association with a host galaxy is secure. In most cases associations between a GRB and a galaxy have been made based on the probability of the nearest observed galaxy lying as close to the centre of the -ray error circle as it does. There are a few exceptions, such as GRB 000210, GRB 050713A and XRF 050416A. The host galaxy of GRB 000210 was identified from the locations of its radio and -ray afterglow. Piro et al. (2002) found a probability of a chance alignment of the galaxy and the burst of and conclude that if this is the host then the dark nature of GRB 000210 is likely due to dust either at the location of the progenitor or along the line of sight. XRF 050416A occurred at a low redshift ( Cenko et al. (2005)). Although technically dark an optical afterglow was detected and was consistent with the standard fireball model (e.g., Cenko & Fox, 2005; Holland et al., 2007). The presence of an optical afterglow and the low line-of-sight extinction suggests that this burst should not be considered to be a dark GRB. The line-of-sight extinction for XRF 050416A is mag (Holland et al., 2007; Perley et al., 2009), which is consistent with what is seen for most optically detected GRB afterglows. Perley et al. (2009) note that GRB 050713A also only barely qualifies as a dark burst under the Jakobsson et al. (2004) definition. The internal line-of-sight extinction for this burst is unknown. However, an optical afterglow was seen (Wren et al., 2005), so it is unlikely that the extinction was large. The latter two of these bursts are technically dark based on the spectral slope between the -ray and optical regimes () criteria of Jakobsson et al. (2004). However, in these cases optical or infrared afterglows were detected, suggesting that these GRBs were borderline cases of dark bursts.
Further evidence that dust is responsible for GRB 090417B being dark comes from the late-time softening of the -ray spectrum. This softening is consistent with what is predicted from the dust scattering model (Shao & Dai, 2007; Shao et al., 2008; Shen et al., 2009), and requires approximately 15–40 mag of extinction at optical wavelengths. The effects of dust scattering do not become apparent in the -ray spectrum until s after the burst. Since -ray spectra are usually extracted from early-time data (when there are a large number of photons) it is possible that the softening seen for GRB 090417B has been present in the late-time -ray spectra of other dark bursts, but has not been seen due to low count rates. For example, the standard catalogue of Swift/XRT spectral fits (Evans et al., 2009) uses data taken within ks of the BAT trigger, well before a softening due to dust scattering is expected to appear.
Perley et al. (2009) point out that the host galaxies of dark GRBs are not unusually reddened relative to the hosts of optically bright GRBs. Their analysis assumes that their statistical association of bursts with the nearest detected galaxy on the sky reveals the true hosts of these bursts. It is uncertain if this is valid for all of the GRBs in their sample. However, it is likely that at least some (if not all) of these galaxies actually did host the associated GRBs. Although some of the hosts of dark GRBs have been found to be unusually dusty compared to the hosts of optically-bright GRBs (e.g., GRB 030115 (Levan et al., 2006)), there is no evidence that the hosts of dark GRBs have systematically higher mean extinctions than the hosts of optically bright GRBs. However, the mean extinction of the host is probably not the factor that determines if a particular burst is dark or not since any extinction due to material that is not along the line of sight to the burst will not affect our observations of the afterglow. What is important in making a burst optically dark or bright is the extinction along the line of sight. This extinction can be due to dust at the location of the GRB, although it has been suggested that the ultraviolet and -ray emission from GRBs can destroy circumburst dust out to a few tens of pc from the progenitor (Waxman & Draine, 2000; Fruchter et al., 2001). One way to get a dusty environment around a GRB progenitor is the stellar wind from a Wolf-Rayet progenitor. Collisions between wind-driven shells of material ejected during various stages of the Wolf-Rayet star’s evolution can trigger the formation of large amounts of dust (e.g. Williams et al., 1990; Shao et al., 2008; Cherchneff, 2009). The radius of a Wolf-Rayet wind bubble is consistent with with the distance from the progenitor that we find for the dust along the line of sight to GRB 090417B (tens of pc). Alternately, the extinction could be due to unrelated dust in the host that just happens to lie along the line of sight, such as a dusty star-forming region or a giant molecular cloud. Giant molecular clouds have diameters of approximately 100 pc (Mizuno et al., 2001), but often contain dense cores where star formation occurs. A chance alignment of one of these cores along the line of sight to GRB 090417B could account for the high extinction inferred from the X-ray data.
For GRB 090417B the late-time evolution of the -ray spectrum can be explained if there is a sheet of dust at a distance of pc from the burst. This suggests that GRB 090417B may have been dark because of either a dusty environment within 30–80 pc of the progenitor (e.g. Waxman & Draine, 2000; Fruchter et al., 2001), or a chance alignment of the progenitor with a region of high extinction in the host galaxy. The Galactic extinction model of Drimmel et al. (2003) suggests that roughly 25% of the sight lines through the Milky Way have mag. The modelling of Updike et al. (2009) suggests that most sightline through a galaxy like the Milky Way, as seen from within the galaxy, have mag. However, their work does not include clumpiness in the dust distribution, which would lead to a larger fraction of sightlines having higher extinctions. This suggests that a non-negligible (albeit uncertain) fraction of GRBs may be located along a sightline with more than approximately one magnitude of extinction in their hosts. When high-redshift dark bursts are accounted for the fraction of dark bursts is roughly comparable of the estimated fraction of highly extincted sightlines, which suggests that obscuration by dust along the line of sight may be responsible for some dark GRBs.
6 Conclusions
We have shown that the host of the dark GRB 090417B is very likely to be SDSS J135846.65+470104.5, an galaxy at . This galaxy has an overall star-formation rate that is at least as great as that of the Milky Way, and an overall -band extinction of mag, which is dustier than typical GRB host galaxies, but not greatly different from the Milky Way.
-ray observations of GRB 090417B show the normal temporal and spectral behaviour seen in the -ray afterglows of many Swift GRBs. The data up to approximately 70 ks after the BAT trigger are consistent with a relativistic fireball expanding into either a homogeneous ISM or a wind-stratified external medium. The cooling frequency is below the -ray band between 9.1 ks and 29.6 ks, and the -corrected isotropic energy is erg. The physics of this burst do not appear to be unusual, and thus are unlikely to explain the dark nature of the burst.
After approximately 70 ks the -ray spectrum becomes significantly softer. We find that this can be explained using the dust scattering model of Shao & Dai (2007). The observed late-time spectral evolution can be produced by a sheet of dust approximately 30–80 pc from the burst along the line of sight. The model predicts an extinction of –40 mag along the line of sight. This is consistent with the H I column density measured from the -ray spectrum. Therefore, we conclude that GRB 090417B is probably dark because of a dense, localized layer of dust along the line of sight between us and the afterglow.
References
- Aoki et al. (2009) Aoki, K., Tanaka, I., Nakata, F., Ohta, K., Yuma, S., & Kawai, N., 2009, GCNC 9145
- Barthelmy et al. (2005) Barthelmy, S. D., Barbier, L. M., Cummings, J. R., Fenimore, E. E., Gehrels, N., Hullinger, D., Krimm, H. A., Markwardt, C. B., et al., 2005, Sp. Sci. Rev., 120, 143
- Berger & Fox (2009) Berger, E., & Fox, D. B., 2009, GCNC 9156
- Berger et al. (2007) Berger, E., Fox, D. B., Kulkarni, S. R., Frail, D. A., & Djorgovski, S. G., 2007, ApJ, 660, 504
- Berger et al. (2009) Berger, E., Fox, D. B., & Tanvir, N., 2009, GCNC 9158
- Bertin & Arnouts (1996) Bertin, E., & Arnouts, S., 1996, A&AS, 117, 393
- Bloom et al. (2001) Bloom, J. S., Frail, D. A., & Sari, R., 2001, AJ, 121, 2879
- Breeveld et al. (2010) Breeveld, A. A., Curran, P. A., Hoversten, E. A., Koch, S., Landsman, W., Marshall, F. E., Page, M. J., Poole, T. S., et al., 2010, MNRAS, in press, arXiv:1004.2448
- Bloom et al. (2002) Bloom, J. S., Kulkarni, S. R., & Djorgovski, S. G., 2002, AJ, 123, 1111
- Brown et al. (2009) Brown, P. J., Holland, S. T., Immler, S., Milne, P., Roming, P. W. A., Gehrels, N., Nousek, J., Panagia, N., et al., 2009, AJ, 137, 4517
- Burrows et al. (2005) Burrows, D. N., Hill, J. E., Nousek, J. A., Kennea, J. A., Wells, A. A., Osborne, J. P., Abbey, A. F., Beardmore, A., et al., 2005, Sp. Sci. Rev. 120, 165
- Campana et al. (2006) Campana, S., Mangano, V., Blustin, A. J., Brown, P., Burrows, D. N., Chincarini, G., Cummings, J. R., Cusumano, G., et al., 2006, Nature, 442, 1008
- Cannizzo & Gehrels (2009) Cannizzo, J. K., & Gehrels, N., 2009, ApJ, 700, 1047
- Cash (1979) Cash, W., 1979, ApJ, 228, 939
- Cenko & Fox (2005) Cenko, S. B., & Fox, D .B., 2005, GCNC 3265
- Cenko et al. (2005) Cenko, S. B., Kulkarni, S. R., Gal-Yam, A., & Berger, E., 2005, GCNC 3542
- Cherchneff (2009) Cherchneff, I., 2009, in ASP Conf. Ser., Hot and Cool: Bridging Gaps in Massive Star Evolution, eds. C. Leitherer, P. D., Bennett, P. W. Morris, & J. T. van Loon, arXiv:0909.0164
- Chevalier & Li (1999) Chevalier, R. A., & Li, Z.-Y., 1999, ApJ, 520, L29
- Christensen et al. (2004) Christensen, L., Hjorth, J., & Gorosabel, J., 2004, A&A, 425, 913
- Conselice et al. (2005) Conselice, C. J., Vreeswijk, P. M., Fruchter, A. S., Levan, A., Kouveliotou, C., Fynbo, J. P. U., Gorosabel, J., Tanvir, N. R., et al., 2005, ApJ, 633, 29
- Cummings et al. (2009) Cummings, J. R., Barthelmy, S. D., Baumgartner, W. H., Fenimore, E. E., Gehrels, N., Krimm, H. A., Markwardt, C. B., Palmer, D. M., et al., 2009, GCNC 9139
- Dado et al. (2002a) Dado, S., Dar, A., & De Rújula, A., 2002a, A&A, 388, 1079
- Dado et al. (2002b) Dado, S., Dar, A., & De Rújula, A., 2002b, AAp, 401, 243
- Dai & Cheng (2001) Dai, Z. G., & Cheng, K. S., 2001, ApJ, 558, L109
- Dar & De Rújula (2000a) Dar, A., & De Rújula, A., 2000a, astro-ph/0008474
- Dar & De Rújula (2000b) Dar, A., & De Rújula, A., 2000b, astro-ph/0012227
- de Vaucouleurs (1948) de Vaucouleurs, G., 1948, AnAp, 11, 247
- de Vaucouleurs (1959) de Vaucouleurs, G., 1959, HDP, 53, 275 & 311
- Drimmel et al. (2003) Drimmel, R., Cabrera-Lavers, A., & López-Corredoira, M., 2003, A&A, 409, 205
- Elíasdóttir et al. (2009) Elíasdóttir, Á., Fynbo, J. P. U., Hjorth, J., Ledoux, C., Watson, D. J., Andersen, A. C., Malesani, D., Vreeswijk, P. M., et al., 2009, ApJ, 697, 1725
- Evans et al. (2009) Evans, P. A., Beardmore, A. P., Page, K. L., Osborne, J. P., O’Brien, P. T., Willingdale, R., Starling, R. L. C., Burrows, D. N., et al., 2009, MNRAS, 397, 1177
- Fishman et al. (1988) Fishman, G. J., Meegan, C. A., et al., 1989, Proc. GRO Science Workshop, GSFC, 2
- Fruchter et al. (2001) Fruchter, A. S., Krolik, J. H., & Rhoads, J. E. 2001, ApJ, 563
- Fruchter et al. (2006) Fruchter, A. S., Levan, A. J., Strolger, L., Vreeswijk, P. M., Thorsett, S. E., Bersier, D., Burud, I., Castro Cerón, A. J., et al., 2006, Nature, 441, 463
- Fynbo et al. (2001) Fynbo, J. P. U., Jensen, B. L., Gorosabel, J., Hjorth, J., Pedersen, H., Møller, P., Abbott, T., Castro-Tirado, A. J., et al., 2001, A&A, 369, 373
- Fynbo et al. (2009a) Fynbo, J. P. U., Malesani, D., Hjorth, J., Leitet, E., Linne, S., Ottosen, T. A., & Jakobsson, J., 2009a, GCNC 9140
- Fynbo et al. (2009b) Fynbo, J. P. U., Jakobsson, P., Procheska, J. X., Malesani, D., Ledoux, C., de Ugarte Postigo, A., Naradini, N., Vreeswikjk, P. M., et al., 2009b, ApJS, 525, 185
- Gehrels et al. (2004) Gehrels, N., Chincarini, G., Ciommi, P., Mason, K. O., Nousek, J. A., Wells, A. A., White, N. E., Barthelmy, S. D., et al., 2004, ApJ, 611, 1005
- Genet et al. (2007) Genet, F., Daigne, F., & Mochkovitch, R., 2007, MNRAS, 381, 732
- Ghisellini et al. (2007) Ghisellini, G., Ghirlanda, G., Nava, L., & Firmani, C., 2007, ApJ, 658, L75
- Goad et al. (2007) Goad, M. R., Tyler, L. G., Beardmore, A. P., Evans, P. A., Rosen, S. R., Osborne, J. P., Starling, R. L. C., Marshall, F. E., et al., 2007, A&A, 476, 1401
- Graham & Driver (2005) Graham, A. W. & Driver, S. P., 2005, PASA, 22, 118
- Granot & Sari (2002) Granot, J. & Sari, R., 2002, ApJ, 568, 820
- Guidorzi et al. (2009) Guidorzi, C., Smith, R., Mundell, C. G., Gomboc, A., O’Brien, P., & Tanvir, N., 2009, GCNC 9144
- Hogg et al. (1997) Hogg, D. W., Pahre, M. A., McCarthy, J. K., Cohen, J. G., Blandford, R., Smail, I., & Soifer, B. T., 1997, MNRAS, 288, 404
- Holland et al. (2007) Holland, S. T., Boyd, P. T., Gorosabel, J., Hjorth, J., Schady, P., Thomsen, B., Augusteijn, T., Blustin, A. J., et al., 2007, AJ, 133, 122
- Jakobsson et al. (2004) Jakobsson, P., Hjorth, J., Fynbo, J. P. U., Watson, D., Pedersen, K., Björnsson, G., & Gorosabel, J., 2004, ApJ, 617, L21
- Jaunsen et al. (2008) Jaunsen, A. O., Rol, E., Watson, D. J., Malesani, D., Fynbo, J. P. U., Milvang-Jensen, B., Hjorth, J., Vreeswijk, P. M., et al., 2008, ApJ, 681, 453
- Kalberla et al. (2005) Kalberla, P. M. W., Berton, W. B., Hartmann, D., Arnal, E .M., Bajaja, E., Morras, R., Pöppel, W. G. L., 2005, A&A, 440, 775
- Kann et al. (2006) Kann, D. A., Klose, S., & Zeh, A., 2006, ApJ, 641, 993
- Kouveliotou et al. (1993) Kouveliotou, C., Meegan, C. A., Fishman, G. J., Bhat, N. P., Briggs, M. S., Koshut, T. M., Paciesas, W. M., & Pendleton, G. N., 1993, ApJ, 413, 101
- Kron (1980) Kron, R. G., 1980, ApJS, 43, 305
- Kumar et al. (2008) Kuman, P., Narayan, R., & Johnson, J. L., 2008, MNRAS, 388, 1729
- Le Floc’h et al. (2002) Le Floc’h, E., Duc, P.-A., Mirable, I. F., Sanders, D. B., Bosch, G., Rodrigues, I., Covrvoisier, T. J.-L., Mereghetti, S., et al., 2002, ApJ, 581, L81
- Le Floc’h et al. (2003) Le Floc’h, E., Duc, P.-A., Mirable, I. F., Sanders, D. B., Bosch, G., Diaz, R. J., Donzelli, C. J., Rodrigues, I., et al., 2003, A&A, 400, 499
- Levan et al. (2006) Levan, A., Fruchter, A., Rhoads, J., Mobasher, B., Tanvir, N., Gorosabel, J., Rol, E., Kouveliotou, C., et al., 2006, ApJ, 647, 471
- Liang et al. (2009) Liang, E.-W., Lü, H.-J., Zhang, B.-B., & Zhang, B., 2009, ApJ, 707, 328
- Lilly et al. (1995) Lilly, S. J., Tresse, L., Hammer, F., Crampton, D., & Le Fèvre, O., 1995, ApJ, 455, 108
- Madau et al. (1998) Madau, P., Pozzetti, L., & Dickinson, M., 1998, ApJ, 498, 106
- Mangano et al. (2009) Mangano, V., Barthelmy, S. D., Baumgartner, W. H., Burrows, D. N., Evans, P. A., Gehrels, N., Guidorzi, C., Holland, S .T., et al., 2009, GCNC 9133
- Mészáros & Gruzinov (2000) Mészáros, P., & Grizinov, A., 2000, ApJ, 543, L35
- Mizuno et al. (2001) Mizuno, N., Yamaguchi, R., Minzuno, A., Rubio, M., Abe, R., Saito, H., Onishi, T., Yonekura, Y., et al., 2001, PASJ, 53, 971
- Nousek et al. (2006) Nousek, J. A., Kouveliotou, C., Grupe, D., Page, K. L., Granot, J., Ramirez-Ruiz, E., Patel, S. K., Burrows, D. N., et al., 2006, ApJ, 642, 389
- Panaitescu & Kumar (2002) Panaitescu, A., & Kumar, P., 2002, ApJ, 571, 779
- Patat & Piemonte (1998) Patat, F., & Piemonte, A., 1998, IAUC 6918
- Pei (1992) Pei, Y. C., 1992, ApJ, 395, 130
- Perley et al. (2009) Perley, D. A., Cenko, S. B., Bloom, J. S., Chen, H.-W., Butler, N. R., Kocevski, D., Prochaska, J. X., Brodwin, M., et al., 2009, AJ, 138, 1690
- Piro et al. (2002) Piro, L., Frail, D. A., Gorosabel, J., Garmire, G., Soffitta, P., Amati, L., Andersen, M. I., Antonelli, L. A., et al., 2002, ApJ, 577, 680
- Poole et al. (2008) Poole, T. S., Breeveld, A. A., Page, M. J., Landsman, W., Holland, S. T., Roming, P. W. A., Kuin, N. P. M., Brown, P. J, et al., 2008, MNRAS, 383, 627
- Predehl & Schmitt (1995) Predehl, P., & Schmitt, J. H. M. M., 1995, A&A, 293, 889
- Rol et al. (2005) Rol, E., Wijers, R. A. M. J., Kouveliotou, C., Kaper, L., & Kaneko, Y., 2005, ApJ, 624, 868
- Roming et al. (2005) Roming, P. W. A., Kennedy,T. E., Mason, K. O., Nousek, J. A., Ahr, L., Bingham, R. E., Broos, P. S., Carter, M. J., et al., 2005, Sp. Sci. Rev., 120, 95
- Roming et al. (2006) Roming, P. W. A., Schady, P., Fox, D. B., Zhang, B., Liang, E., Mason, K. O., Rol, E., Burrows, D. N., et al., 2006, ApJ, 652, 1416
- Roming et al. (2009) Roming, P. W. A., Koch, T. S., Oates, S. R., Porterfield, B. L., Vanden Berk, D. E., Boyd, P. T., Holland, S. T., Hoversten, E. A., et al., 2009, ApJ, 690, 163
- Salpeter (1955) Salpeter, E. E., 1995, ApJ, 121, 161
- Salvaterra et al. (2009) Salvaterra, R., Della Valle, M., Campana, S., Chincarini, G., Covino, S., D’Avanzo, P., Fernandez-Soto, A., Guidorzi, F., et al., 2009, Nature, 461, 1258
- Sari et al. (1999) Sari, R., Piran, T., & Halpern, J. P., 1999, ApJ, 519, L17
- Savaglio et al. (2009) Savaglio, S., Glazebrook, K., & Le Borgne, D., 2009, ApJ, 691, 182
- Sbarufatti et al. (2009) Sbarufatti, B., Barthelmy, S. D., Baumgartner, W. H., Burrows, D. N., Curran, P. A., Evans, P. A., Godet, O., Guidorzi, C., et al., 2009, GCNC 9135
- Scalo (1986) Scalo, J. N., 1986, Fund. Cosm. Phys., 11, 1
- Schady et al. (2007) Schady, P., Mason, K. O., Page, M. J., De Pasquale, M., Morris, D. C., Romnano, P., Roming, P. W. A., Immler, S., et al., 2007, MNRAS, 377, 273
- Schady et al. (2009) Schady, P., Page, M. J., Oates, S. R., Still, M., De Pasquale, M., Dwelly, T., Kuin, N. P. M., Holland, S .T., et al., 2009, MNRAS, 401, 2773
- Schlegel et al. (1998) Schlegel, D. J., Finkbeiner, D. P., & Davis, M., 1998, ApJS, 500, 525
- Sérsic (1963) Sérsic, J.-L. 1963, BAAA, 6, 41
- Sérsic (1968) Sérsic, J.-L. 1968, Atlas de Galaxias Australes, Cordoba: Observatorio Astronomico
- Shao & Dai (2007) Shao, L., & Dai, Z. G., 2007, ApJ, 660, 1319
- Shao et al. (2008) Shao, L., Dai, Z. G., & Mirabal, N., 2008, ApJ, 675, 507
- Shen et al. (2009) Shen, R.-F., Willingale, R., Kumar, P., O’Brien, P. T., & Evans, P. A., 2009, MNRAS, 393, 598
- Shen & Zhang (2009) Shen, R.-F., & Zhang, B., 2009, MNRAS, 398, 1936
- Strauss et al. (2002) Strauss, M. A., Weinberg, D. H., Lupton, R. H., Narayanan, V. K., Annis, J., Bernardi, M., Blanton, M., Burles, S., et al., 2002, AJ, 124, 1810
- Tanvir et al. (2008) Tanvir, N. .R., Levan, A. J., Rol, E., Starling, R. L. C., Gorosabel, J., Priddey, R. S., Malesani, D., Jakobsson, P., et al., 2008, MNRAS, 388, 1743
- Tanvir et al. (2009) Tanvir, N. R., Fox, D. B., Levan, A. J., Berger, E., Wiersema, K., Fynbo, J. P. U., Cucchiara, A., Krühler, T., Gehrels, N., et al., 2009, Nature, 461, 1254
- Trujillo et al. (2006) Trujillo, I., Förster Schreiber, N. M., Rudnick, G., Barden, G., Franx, M., Rix, H.-W., Caldwell, J. A. R., McIntosh, D. H., et al., 2006 ApJ, 650, 18
- Uhm & Beloborodov (2007) Uhm, Z. L., & Beloborodov, A. M., 2007, ApJ, 665, L93
- Updike et al. (2009) Updike, A. C., Hartmann, D. H., Greiner, J., & Klose, S., 2009, AIPC, 1133, 257
- van der Horst et al. (2009) van der Horst, A. J., Kouveliotou, C., Gehrels, N., Rol, E., Wijers, R. A. M. J., Cannizzo, J. K., & Racusin, J., 2010, ApJ, 711, L1
- Wainwright et al. (2007) Wainwright, C., Berger, E., & Penprase, B. E., 2007, ApJ. 657, 367
- Waxman & Draine (2000) Waxman, E., & Draine, B. T., 2000, ApJ, 537, 796
- Williams et al. (1990) Williams, P. M., van der Hucht, K. A., The, P. S., & Bouchet, P., 1990, MNRAS, 247, 18
- Wren et al. (2005) Wren, J., Vestrand, W. T., Wozniak, P., White, R., & Evans, S., 2005, GCNC 3604
- Yamazaki (2009) Yamazaki, R., 2009, ApJ, 690, L118
- Yasuda et al. (2007) Yasuda, N., Fukugita, M., & Schneider, D. P., 2007, AJ, 134, 698
- Zhang et al. (2006) Zhang, B., Fan, Y. Z., Dkys, J., Kobayashi, S., Mészáros, P., Burrows, D. N., Nousek, J. A., & Gehrels, N., 2006, ApJ, 642, 354