Water Masers Associated with Star Formation in the Antennae Galaxies
Abstract
We present Very Large Array observations with 80 milliarcsecond resolution ( pc) of the recently discovered Galactic-analog H2O masers in the Antennae interacting galaxies (NGC 4038/NGC 4039; Arp244). Three regions of water maser emission are detected: two in the “interaction region” (IAR) and the third ( pc) west of the NGC 4039 nucleus. The isotropic H2O maser luminosities range from 1.3 to 7.7 . All three maser regions are mostly obscured in the optical/near-infrared continuum, and are coincident with massive CO-identified molecular clouds. The H2O maser velocities are in excellent agreement with those of the molecular gas. We also present archival VLA 3.6 cm data with ( pc) and ( pc) resolution toward the maser locations. All three maser regions are coincident with compact 3.6 cm radio continuum emission, and two are dominated by thermal ionized gas, suggesting the presence of natal super star clusters containing the equivalent of a few thousand O stars. We also present detailed comparisons between the radio data and existing HST ACS (optical) and NICMOS (near-IR) data and find that both maser regions in the IAR are also associated with Pa emission and neither source is detected shortward of 2 m. These results highlight the potential of using Galactic-analog H2O masers to pinpoint sites of young super star cluster formation with exquisite angular resolution.
1 Introduction
Water masers are found in the vicinity of of infrared bright (100 m 1000 Jy and 60 m 100 Jy) ultracompact H ii (UCHII) regions in our Galaxy (Churchwell et al., 1990; Kurtz & Hofner, 2005), providing excellent signposts for active star formation. The term “kilomaser” was coined to describe extragalactic H2O masers with luminosities comparable to the brightest star formation H2O masers in our Galaxy (e.g. W49N; L⊙). Kilomaser isotropic luminosities ( L⊙) are much lower than the more widely studied “megamasers” found in the nuclear regions of AGN (i.e. NGC 4258), with luminosities up to 104 L⊙ (Barvainis & Antonucci, 2005). Since “kilomasers” can in principle be either of nuclear (i.e. amplifying a background AGN) or star formation origin, we will use the term “Galactic-analog” (GA) H2O maser to refer to non-nuclear masers with kilomaser luminosity. Natal super star clusters are thought to contain 1000s of UCHII regions, therefore GA-H2O masers may help pinpoint sites of young extragalactic cluster formation, though there have been few searches with the required sensitivity. Until recently GA-H2O masers had been unambiguously detected toward only six nearby galaxies: LMC, M82, IC 342, IC 10, M33, and NGC 2146 with isotropic luminosities in the range 0.005 to 4 (Whiteoak & Gardner, 1986; Henkel et al., 2005; Castangia et al., 2008, and references therein). The remaining few known H2O kilomasers are either associated with AGN activity or their origin is ambiguous.
We recently conducted a Greenbank Telescope111The National Radio Astronomy Observatory operates the GBT and VLA and is a facility of the National Science Foundation operated under cooperative agreement by Associated Universities, Inc. (GBT) search for H2O masers toward four nearby starburst galaxies ( Mpc), known to harbor natal super star clusters and without known AGN (or at worst low luminosity AGN) down to a sensitivity level sufficient to detect strong GA-H2O masers. Positive detections were found for all four galaxies (the Antennae galaxies, He2-10, NGC 4214, and NGC 5253; Darling et al., 2008), suggesting that GA-H2O maser emission may be common in starburst galaxies. The unusual success of this mini-survey arises from its order of magnitude greater sensitivity compared to most previous single dish surveys for either kilomasers or megamasers.
The strongest masers were detected toward the Antennae (D Mpc222Antennae distance estimates range from Mpc (Saviane et al., 2008) to Mpc (Schweizer et al., 2008); we adopt 22 Mpc.) interacting galaxies (NGC 4038/NGC 4039; Arp244). Indeed, this violent merger is an ideal laboratory to study how H2O maser emission behaves in regions of extreme star formation. In this paper we report sensitive high angular resolution Very Large Array (VLA) water maser observations of the Antennae galaxies, along with archival 3.6 and 6 cm continuum, CO, and optical/near-IR data in order to pinpoint the maser locations and determine the nature of the emission.
2 VLA Observations and Data Reduction
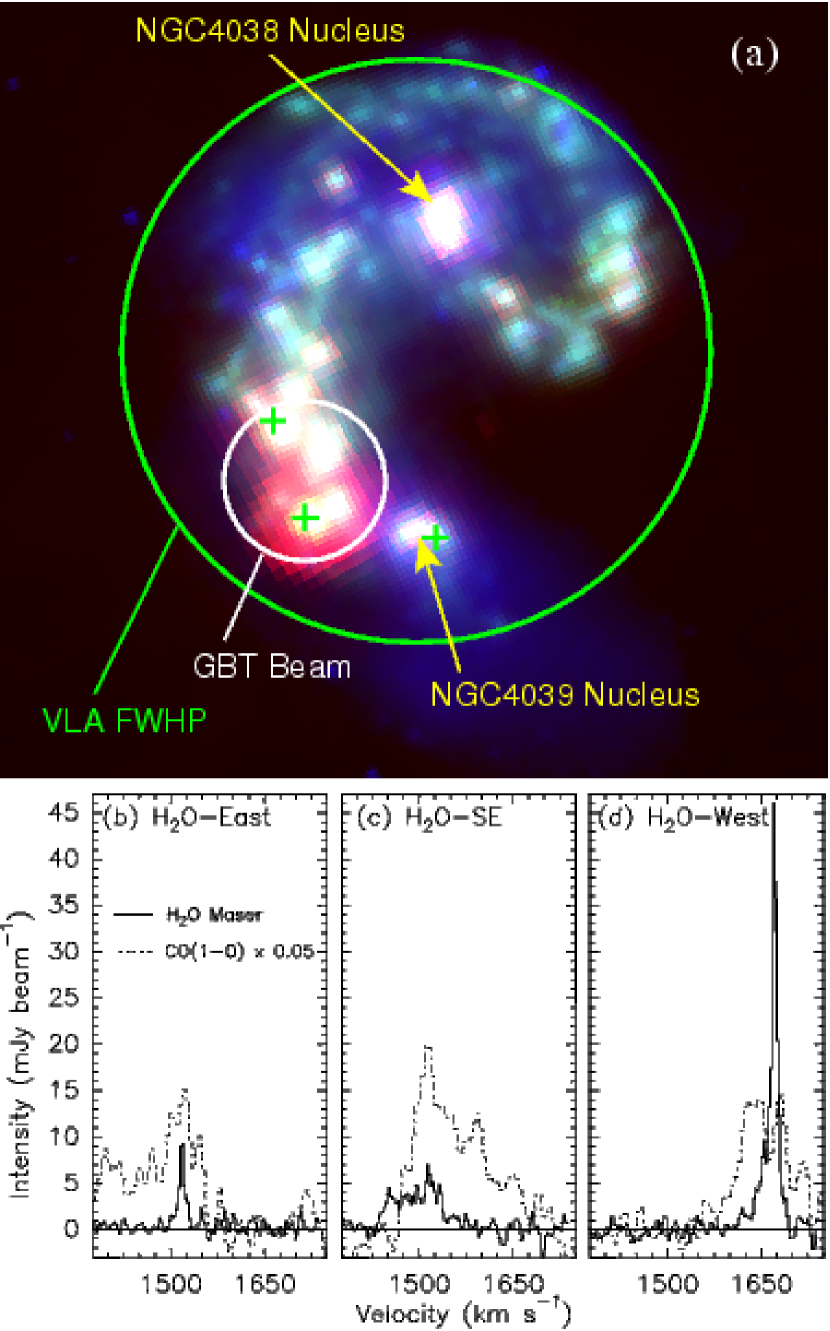
We observed the () ortho-water maser line at 22.23508 GHz toward the Antennae galaxies in the VLA A-configuration using fast-switching and reference pointing. The full width at half power (FWHP) at the Doppler shifted frequency of GHz is , encompassing both nuclei (NGC 4038 and NGC 4039), as well as the interaction region (IAR; see Figure 1a); in comparison the GBT primary beam was only . In order to cover the velocity extent of maser emission detected with the GBT with similar velocity resolution (3.7 km s-1) required three correlator settings, each with 2 IFs. We also retrieved A and B-configuration 3.6 cm continuum data, as well as BnA-configuration 6 cm data from the VLA archive (the B-configuration data were included in the multi-configuration study of Neff & Ulvestad, 2000). Further details of the VLA data are given in Table 1. Data calibration followed standard high-frequency procedures in AIPS, including using a model for the brightness distribution of the absolute flux calibrator 3C 286; absolute flux calibration is good to . The line-free channels from the GHz data were used to estimate the 1.3 cm continuum emission in the UV-plane. The maser line data were subsequently imaged in CASA (to facilitate regridding of the six IFs), and primary beam correction was applied. The continuum data were imaged in AIPS, and primary beam corrected. The astrometric accuracy is better than , while the relative position uncertainty of the maser data is an order of magnitude better). All velocities are presented in the barycenter frame, optical definition.
| Parameter | Value |
|---|---|
| H2O maser and 1.3 cm (22.11 GHz) continuum Observations | |
| Project (config.) | AB1304 (A) |
| Observing Dates | 10, 11, 15 Nov 2008 |
| Bandwidth | 6 6.25 MHz |
| Velocity Bandwidth | 1360 to 1740 km s-1 |
| Velocity resolution | 3.7 km s-1 |
| Spec. line resolution | 108 mas 61 mas (P.A.) |
| Spec. line rms noise | 1 mJy beam-1 |
| Cont. resolutiona | 350 mas 220 mas (P.A.); k |
| Cont. rms noise | 0.14 mJy beam-1 |
| Archival 3.6 cm (8.46 GHz) Continuum Observations | |
| Project (config.) | AP478 (A), AS796 (A), AA301 (A), AN079 (B) |
| Observing Dates | 01 Nov, 21 Dec 2004; 09 Mar 2006; 07 Sep 1998 |
| Bandwidth | 50 MHz |
| Cont. resolution (A) | 350 mas mas (P.A.); k |
| Cont. rms noise (A) | 0.032 mJy beam-1 |
| Cont. resolution (B) | ( P.A.) |
| Cont. rms noise (B) | 0.013 mJy beam-1 |
| Archival 6 cm (4.85 GHz) Continuum Observations | |
| Project (config.) | AN074 (BnA) |
| Observing date | 31 Jan 1997 |
| Bandwidth | 2 25 MHz |
| Cont. resolution | (P.A.); k |
| Cont. rms noise | 0.022 mJy beam-1 |
Note. — A Briggs weighting of robust=0 was used unless otherwise specified. UV weighting adjustments are indicated after the resolution; indicates a Gaussian taper and indicates a cut.
3 Results
3.1 H2O Maser Emission
As shown on the three-color Spitzer composite in Figure 1a, three distinct regions of H2O maser emission are resolved by the VLA; two are located in the 24 m-bright IAR between the two nuclei, and one is located ( pc) to the west of the NGC 4039 nucleus. For ease of referencing, these three maser regions are denoted H2O-East, H2O-SE, and H2O-West. We call these “maser regions” because at the current resolution mas ( pc), the observed emission is most likely the sum of many individual maser spots. Spectra of the maser emission are shown in Figures 1b,c, and d, and the observed properties are given in Table 2. At the current angular resolution, no variation of maser position with velocity is detected. The range of maser velocities detected by the VLA is in excellent agreement with that of the GBT data, despite the 16 larger area covered in the VLA data. Differences in intensity between the VLA and GBT data can be explained by the maser offsets from the GBT pointing center (see Fig. 1a). Using the observed line properties (Table 2) we find isotropic H2O maser luminosities ranging from 1.3 to 7.7 , which is on the high side, but not dissimilar to the other galaxies with known GA-H2O emission (see §1). The H2O luminosity sensitivity limit is (assumes =5 mJy () and =10 km s-1), brighter than the majority of Galactic water masers.
| Maser | Position | ||||||
|---|---|---|---|---|---|---|---|
| Region | (J2000) | (J2000) | (km s-1) | (km s-1) | (mJy) | (mJy km s-1) | () |
| H2O-East | 12:01:55.4590 (2) | 18:52:45.653 (5) | 1502 - 1528 | 1520.4 | 9.3 (0.9) | 116 (12) | 1.3 (0.1) |
| H2O-SE | 12:01:54.9959 (4) | 18:53:05.543 (8) | 1439 - 1539 | 1515.1 | 7.2 (1.0) | 370 (25) | 4.1 (0.4) |
| H2O-West | 12:01:53.1257 (1) | 18:53:09.805 (2) | 1639 - 1689 | 1670.5 | 44.3 (0.1) | 690 (25) | 7.7 (0.5) |
Note. — Positions and peak flux densities measured from 2-D Gaussian fits. Isotropic line luminosities were computed from , where the distance was assumed to be 22 Mpc and is in mJy km s-1 (Henkel et al., 2005).
3.2 Radio Continuum Emission
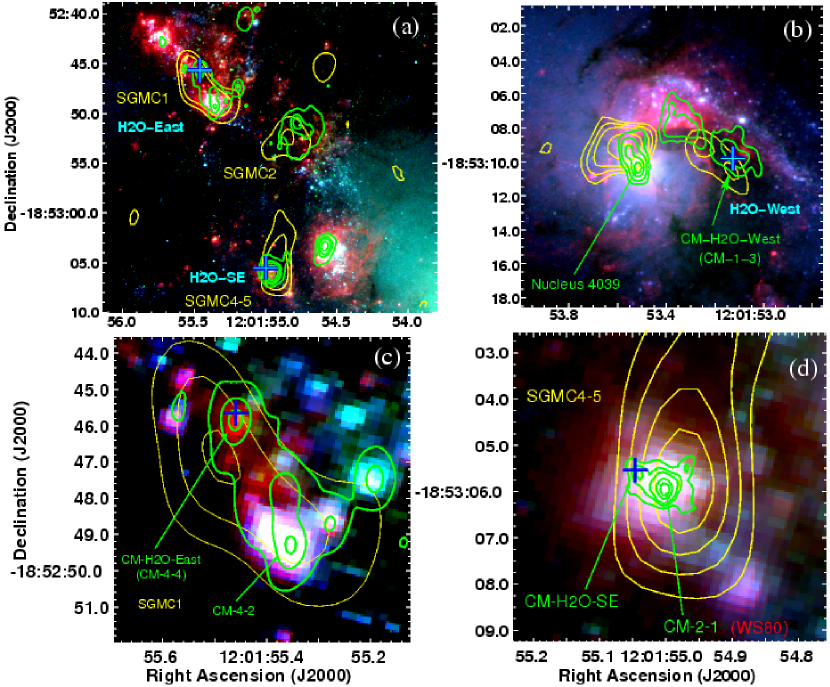
We have created matched resolution ( pc) 3.6 and 6 cm continuum images with high signal-to-noise, as well as higher resolution ( pc) 1.3 and 3.6 cm images, albeit with significantly less sensitivity. Care was used to match the UV-coverage of the continuum pairs at both resolutions. These images are the highest resolution radio images available to date towards the Antennae (see for example the resolution 3.6 cm VLA data of Neff & Ulvestad, 2000). A complete analysis of these data throughout the Antennae will be presented in a forthcoming paper, for now we concentrate on the maser locations. Radio continuum sources associated with H2O-East and H2O-West are detected in the resolution 3.6 and 6 cm images (also see Neff & Ulvestad, 2000, their sources 4-4 and 1-3 respectively). We have also resolved compact continuum emission towards H2O-SE in the 1.3 and 3.6 cm images (this source is not resolved from the bright Neff & Ulvestad, 2000, source 2-1 at poorer resolutions). The radio source associated with H2O-East is also detected in the higher resolution (poorer sensitivity) 1.3 and 3.6 cm continuum images, though H2O-West is not. The 3.6 cm continuum contours are shown in Figures 2a,b,c,d (see §4.1).
The radio continuum sources are denoted CM-H2O-East, CM-H2O-SE, and CM-H2O-West, and their observed flux densities and spectral indices () are listed in Table 3. The spectral index for CM-H2O-East is flat and in good agreement with Neff & Ulvestad (2000, their source 4-4, ). We also find a flat (or possibly inverted) spectrum for CM-H2O-SE (detected here for the first time). In contrast, we find that CM-H2O-West has a steep spectrum (), while Neff & Ulvestad (2000) inferred an inverted spectrum (their source 1-3, ). This inconsistency can be explained by the fact that these authors use a fitted size for this source at 3.6 cm, but only a peak flux density at 6 cm due to a poor Gaussian fit, thus underestimating the 6 cm flux density. Since both CM-H2O-East and CM-H2O-SE have flat radio spectra, and are coincident with Pa emission (see§4.1), both are likely to be dominated by thermal H ii regions. In contrast, CM-H2O-West has a steep spectrum and thus appears to be dominated by non-thermal emission; broader radio wavelength coverage is required to disentangle a thermal component for this maser region.
For the two thermal sources, CM-H2O-East and CM-H2O-SE, the production rate of ionizing photons () can be estimated using Equation 2 from Condon (1992) assuming thermal, optically thin emission (see Johnson et al., 2009). Although the 1.3 cm data would generally be preferred (to exclude non-thermal contamination, and to have a higher likelihood of being optically thin), we have used the 3.6 cm data to determine QLyC due to its superior sensitivity (see Table 1). An O7.5V star produces an ionizing flux of QLyC = s-1 (hereafter O*; Leitherer et al., 1999; Vacca et al., 1996), suggesting that the ionized gas associated with the two IAR maser regions is equivalent to O* stars. Note that these QLyC values could be underestimates if a significant fraction of the ionizing flux is absorbed by dust or able to escape from the H ii region (see Johnson & Kobulnicky, 2003; Reines et al., 2008; Johnson et al., 2009).
| Source | F6.0cmaaNatural weighting was used. | FaaFlux densities measured from polygon regions; uncertainties are plus a calibration uncertainty (added in quadrature); blanks mean source was resolved out or too confused. | F1.3cmaaFlux densities measured from polygon regions; uncertainties are plus a calibration uncertainty (added in quadrature); blanks mean source was resolved out or too confused. | bbUncertainties are 68 confidence levels (1); for H2O-SE 0.4 mJy is a lower limit for the 1.3 cm flux density, so this defines the lower bound on its . | QLyCccInferred from 3.6 cm flux densities. |
|---|---|---|---|---|---|
| (mJy) | (mJy) | (mJy) | ( s-1) | ||
| CM-H2O-EastddFlux densities measured from the data. | 1.1 (0.1) | 1.00 (0.08) | 5.1 | ||
| CM-H2O-SEeeFlux densities measured from the data. | 0.5 (0.1) | 0.6 (0.4) | 1.9 | ||
| CM-H2O-WestddFlux densities measured from the data. | 0.9 (0.14) | 0.64 (0.09) | ? |
4 Discussion
4.1 Multiwavelength Comparison of the Maser Environments
To further assess the nature of the sources associated with the maser emission, we have obtained existing Hubble Space Telescope (HST) ACS and NICMOS data, along with Owens Valley Radio Observatory (OVRO) CO(1–0), and Submillimeter Array (SMA) CO(3–2) molecular line data (Whitmore et al., 1999; Wilson et al., 2000; Petitpas et al., 2007). To use these data we must first ensure the registration of the different data sets. The astrometry of the VLA data is good to , far superior to the other available data. Because of their shorter wavelengths, the OVRO and SMA CO positions are likely less accurate (). The HST data have an astrometric uncertainty of . For example, by comparing with the Neff & Ulvestad (2000) radio data, Whitmore & Zhang (2002) found a offset for their WFPC2 images. For the current analysis we first matched the continuum-subtracted Pa emission in the IAR to the 3.6 cm continuum since they have the same physical origin. We then applied that astrometric solution to the non-continuum-subtracted Pa image, which has many features in common with the other optical/near-IR images, allowing us to register and correct all the other HST images. The resulting shifts for the ACS and NICMOS data, are , ; and , , respectively (we also find good agreement with the WFPC2 offset determined by Whitmore & Zhang, 2002). We estimate that the final relative astrometry is good to .
Figures 2a, and b show three-color optical wavelength HST images of the IAR, and NGC 4039 nuclear region, respectively, and are superposed with the locations of the masers, 3.6 cm contours, and SMA CO(3–2) integrated intensity contours from Petitpas et al. (2007). Figures 2c, and d further zoom into the IAR to show close-up near-IR NICMOS views of H2O-East and H2O-SE, respectively. Additionally, superposed on the H2O spectra in Figures 1b,c, and d are scaled OVRO CO(1–0) spectra from Wilson et al. (2000, these data have significantly higher S/N than the CO(3–2) data). The velocities of all three maser regions are encompassed by the velocity range of the CO(1–0) emission, suggesting that the masers are located within the thermal molecular gas. Indeed, H2O-East and H2O-SE are coincident with super giant molecular complexes (SGMC) 1 and 4-5, respectively (see Wilson et al., 2000), and all three maser regions are coincident with CO(3–2) clouds (also see Petitpas et al., 2007). Additionally, all three maser regions are notably dim at optical wavelengths, suggesting high obscuration (see Fig. 2a, b). Below we discuss the properties of each region in detail.
4.1.1 H2O-East Region
As shown in Fig. 2a and discussed in §3.2, the H2O-East maser is coincident with a massive thermal H ii region, but is located in an optically uninteresting region between two optically bright star forming regions ( pc) to the NE and SW. In the following, we will denote the H ii region itself as H2O-East. H2O-East is also coincident with a source of compact Pa emission detected by NICMOS (Fig. 2c), though it is not detected in either of the NICMOS F110W, or F160W continuum images (it is weakly detected in the F220M image, not shown). The H2O-East cluster is not included in the Brandl et al. (2005) WIRC J and Ks band study of the reddest Antennae clusters because it is so red that it was not detected at J-band. Notably H2O-East is only west of the 2nd reddest Antennae cluster (IDWIRC=190, ; Brandl et al., 2005). In contrast, the optically bright massive clusters located to the NE and SW of H2O-East show relatively little extinction ( for the SW sources Whitmore & Zhang, 2002). Unfortunately, the resolution of existing mid-IR ( m) imaging has been too poor to resolve the H2O-East region from the nearby clusters.
H2O-East has also been detected in Br by Gilbert & Graham (2007, their source “D2”) using NIRSPEC on KeckII. These authors find a peak Br velocity of 1487 km s-1 and a = 55 km s-1, which is somewhat blue-ward of the H2O-East maser and CO(1–0) peak velocity of 1520 km s-1 (see Fig.1b), suggesting the Br originates in outflowing ionized gas in front of the maser region. Gilbert & Graham (2007) find that the bright cluster to the SW (their source “D”, and Neff & Ulvestad, 2000, source CM-4-2) has a Br velocity offset by 100 km s-1 from H2O-East, suggesting that these clusters may be separated significantly along the line of sight in addition to the ( pc) plane-of-sky distance.
4.1.2 H2O-SE Region
The H2O-SE region is located only ( pc) to the NE of the most massive ( M⊙) and brightest mid-IR to cm- star cluster ( WS80, B1, CM-2-1, WIRC157, Peak 1) in the whole of the Antennae galaxies (see for example Whitmore & Zhang, 2002; Gilbert & Graham, 2007; Neff & Ulvestad, 2000; Brandl et al., 2005, 2009, we denote this cluster as WS80 for ease of referral). Though the optical HST data have more than sufficient resolution, H2O-SE is not detected. The majority of longer wavelength data do not have sufficient resolution, so that only the integrated properties of H2O-SE plus the WS80 cluster are available. Indeed, the H2O-SE region has been resolved and detected in only one other study – that by Snijders et al. (2006) using the VLT VISIR instrument at 12.81 m ([NEII] + continuum, their source “1b”). The H2O-SE source contributes about 1/5 of the total flux of the combined H2O-SE + WS80 regions at this wavelength, similar to what is seen in the resolution 3.6 cm data.
Wilson et al. (2000) find this region to be coincident with the confluence of two SGMCs, and as seen in Fig. 1c, both the maser and CO(1–0) show particularly broad emission. Gilbert & Graham (2007) find a Br velocity for WS80 (their source “B1”), of km s-1 with a FWHM km s-1. These values are in excellent agreement with the H2O-SE maser kinematics (1515.1 km s-1, and 100 km s-1), suggesting that H2O-SE and WS80 are in close proximity kinematically as well as spatially.
Estimated ages for the WS80 cluster range between Myr (Whitmore & Zhang, 2002; Gilbert & Graham, 2007; Snijders et al., 2007), though it is difficult to pinpoint cluster ages of Myr due to the lack of evolution in colors and ionizing fluxes. Whitmore & Zhang (2002) infer an extinction value of for WS80, and Gilbert & Graham (2007) find , or roughly for a simple screen model. Interestingly, in order to account for the lack of detection of H2O-SE at shorter wavelengths, Snijders et al. (2006) suggest that for H2O-SE! Given its very high extinction, H2O-SE may be an extremely young super star cluster in the making, though it is difficult to distinguish between extreme youth (and thus small physical size and compared to WS80) vs. a simply less massive (and thus less able to clear its natal material) but more evolved cluster.
4.2 H2O-West Region
The western maser resides in an optically thick dust lane coincident with a CO(3–2) molecular cloud, and is virtually invisible at every other available wavelength except for weak radio emission (see Fig. 2b). Moreover, because the radio emission is dominated by non-thermal emission it is impossible to discern the nature of any ionized thermal emission that might be associated with the maser region. It is possible that this source would be apparent at mid- to far-IR wavelengths, but unfortunately none of the available data have sufficient resolution to identify it. It is also notable that this maser has an exceptionally large luminosity (7.7 L☉) for a GA-H2O maser. Hopefully future high resolution near to mid-IR data may help shed light on this deeply embedded maser source.
5 Conclusions
We have imaged the GBT-discovered GA-H2O masers in the Antennae galaxies with exquisite angular resolution ( mas), and find two maser regions in the IAR and a third ( 600 pc) west of the NGC4039 nucleus. All three masers show excellent kinematic and spatial agreement with dense CO molecular gas. The IAR maser regions are located in areas of high optical/near-IR extinction, and are coincident with thermal ionized gas suggesting the presence of several thousand O∗. Indeed, both of these maser regions seem to pinpoint extremely young sites of deeply embedded super star cluster formation. These results highlight the promise of using GA-H2O masers to precisely locate the earliest phases of extragalactic cluster formation. The current isotropic luminosity sensitivity limit of 0.6 L☉, is still brighter than most Galactic H2O masers, suggesting we may only be seeing the bright tip of the maser distribution. With its new broad bandwidth correlator, the Expanded Very Large Array will be an ideal instrument for future GA-H2O maser studies (the 1.3 cm data presented here could be taken in 1/3 the time, while achieving better continuum sensitivity).
References
- Barvainis & Antonucci (2005) Barvainis, R., & Antonucci, R. 2005, ApJ, 628, L89
- Brandl et al. (2005) Brandl, B. R., et al. 2005, ApJ, 635, 280
- Brandl et al. (2009) Brandl, B. R., et al. 2009, ApJ, 699, 1982
- Castangia et al. (2008) Castangia, P., Tarchi, A., Henkel, C., & Menten, K. M. 2008, A&A, 479, 111
- Churchwell et al. (1990) Churchwell, E., Walmsley, C. M., & Cesaroni, R. 1990, A&AS, 83, 119
- Condon (1992) Condon, J. J. 1992, ARA&A, 30, 575
- Darling et al. (2008) Darling, J., Brogan, C., & Johnson, K. 2008, ApJ, 685, L39
- Gilbert & Graham (2007) Gilbert, A. M., & Graham, J. R. 2007, ApJ, 668, 168
- Henkel et al. (2005) Henkel, C., Peck, A. B., Tarchi, A., Nagar, N. M., Braatz, J. A., Castangia, P., & Moscadelli, L. 2005, A&A, 436, 75
- Johnson et al. (2009) Johnson, K. E., Hunt, L. K., & Reines, A. E. 2009, AJ, 137, 3788
- Johnson & Kobulnicky (2003) Johnson, K. E., & Kobulnicky, H. A. 2003, ApJ, 597, 923
- Kurtz & Hofner (2005) Kurtz, S., & Hofner, P. 2005, AJ, 130, 711
- Leitherer et al. (1999) Leitherer, C., et al. 1999, ApJS, 123, 3
- Neff & Ulvestad (2000) Neff, S. G. & Ulvestad, J. S. 2000, AJ, 120, 670
- Petitpas et al. (2007) Petitpas, G., et al. 2007, From Z-Machines to ALMA: (Sub)Millimeter Spectroscopy of Galaxies, 375, 267
- Reines et al. (2008) Reines, A. E., Johnson, K. E., & Goss, W. M. 2008, AJ, 135, 2222
- Saviane et al. (2008) Saviane, I., Momany, Y., da Costa, G. S., Rich, R. M., Hibbard, J. E. 2008, ApJ, 678, 179
- Schweizer et al. (2008) Schweizer, F., et al. 2008, AJ, 136, 1482
- Snijders et al. (2007) Snijders, L., Kewley, L. J., & van der Werf, P. P. 2007, ApJ, 669, 269
- Snijders et al. (2006) Snijders, L., van der Werf, P. P., Brandl, B. R., Mengel, S., Schaerer, D., & Wang, Z. 2006, ApJ, 648, L25
- Vacca et al. (1996) Vacca, W. D., Garmany, C. D., & Shull, J. M. 1996, ApJ, 460, 914
- Whiteoak & Gardner (1986) Whiteoak, J. B. & Gardner, F. F. 1986, MNRAS, 222, 513
- Whitmore et al. (1999) Whitmore, B. C., Zhang, Q., Leitherer, C., Fall, S. M., Schweizer, F., & Miller, B. W. 1999, AJ, 118, 1551
- Whitmore & Zhang (2002) Whitmore, B. C., & Zhang, Q. 2002, AJ, 124, 1418
- Wilson et al. (2000) Wilson, C. D., Scoville, N., Madden, S. C., & Charmandaris, V. 2000, ApJ, 542, 120