The UNAM-KIAS Catalog of Isolated Galaxies.
Abstract
A new catalog of isolated galaxies from The Sloan Digital Sky Survey (DR5) is presented. 1520 isolated galaxies were found in 1.4 steradians of sky. The selection criteria in this so called UNAM-KIAS catalog was implemented from a variation on the criteria developed by Karachentseva 1973 including full redshift information. Through an image processing pipeline that takes advantage from the high resolution ( 0.4 /pix) and high dynamic range of the SDSS images, a uniform band morphological classification for all these galaxies is presented. We identify 80% (SaSm) spirals (50% later than Sbc types) on one hand, and a scarce population of early-type E(6.5%) and S0(8%) galaxies amounting to 14.5% on the other hand. This magnitude-limited catalog is complete at 16.5, 15.6, 15.0, 14.6 and 14.4 magnitudes in the bands respectively. Some representative physical properties including SDSS magnitudes and color distributions, color-color diagrams, absolute magnitude-color, and concentration-color diagrams as a function of morphological type are presented.
The UNAM-KIAS Morphological Atlas is also released along with this paper. For each galaxy of type later than Sa, a mosaic is presented
that includes: (1) a -band logarithmic image, (2) a band filtered-enhanced image where a Gaussian kernel of various
sizes was applied and (3) an RGB color image from the SDSS database. For E/S0/Sa galaxies, in addition to the images in (1), (2) and (3),
plots of band surface brightness and geometric profiles (ellipticity , Position Angle and coefficients
of the Fourier series expansions of deviations of a pure ellipse) are provided 111The mosaic images are available via our on-line
web-site
http://www.astroscu.unam.mx/hector/KIAS/kias.html.
The size of the sample, the redshift completeness, the availability of high quality multicolor photometric data and detailed morphological and spectroscopic information make the UNAM-KIAS catalog of isolated galaxies a suitable sample to address important issues such as: (1) comparative studies of environmental effects, (2) constraining the currently competing scenarios of galaxy formation and evolution, (3) the nature and evolution of elliptical and spiral galaxies in the field, (4) the spectral properties of a statistically significant number of isolated galaxies and their evolution as a function of redshift and (5) the fraction of AGN in isolated environments among other important topics.
The optimization and estimation of new structural parameters as well as important information to complement the existing one in other wavelengths is being carried out.
1 Introduction
The large and homogeneous redshift and image surveys like the 2dFGRS (Colles et al. 2001), SDSS (York et al. 2000) and more recently the 6dFGRS (Jones et al. 2004; 2009) have helped us to extend our view of the local universe. Not only the small-scale distribution of galaxies is being revealed but equally important, now it is possible to make accurate measurements of the relationship between the various physical properties of galaxies and the local environment. Recently, Park et al. (2007, 2008) and Park & Choi (2008) used the SDSS data and studied the environmental dependence of the observed morphology at large and small smoothing scales to address the question of whether galaxy morphology depends primarily on the large-scale environment in which the galaxy initially formed or on a smaller scale environment that may reflect the influence of later evolutionary effects such as galaxy-galaxy interactions. Park et al. (2008) pointed out that galaxies statistically become more isolated if they recently merged and that at a fixed large-scale density, more isolated galaxies are more likely to be recent merger products.
Galaxy formation models within the paradigm are every time better tuned to fit the joint luminosity/color/morphology distribution of low-redshift galaxies (c.f. De Lucia et al. 2006). These models assume that bulge formation takes place during mergers and that a galaxy can grow a disk later on provided that it is fed by an appreciable cooling flow. Spheroid formation is extended by assuming that bulges can also grow from disc instabilities. This additional mechanism can change the relative fractions of morphological types in these models. In the simulations of De Lucia et al. (2006), the final fractions of ellipticals, spirals and lenticulars brighter than -18 in the band are 17%, 65% and 18%, very close to the fractions of 13%, 67% and 20% reported by Loveday (1996). If bulge growth is switched-off, the above fractions become 7%, 84% and 8% respectively, very close to the reported fractions for isolated galaxies from the CIG catalog (Karachentseva 1973) that are in common to the SDSS (DR6) by Hernández-Toledo et al. (2008). This could be evidencing the impact of secular processes in the properties of isolated galaxies.
Uniformly selected and observed samples of galaxies that have not suffered any interaction with another normal galaxy or with a group environment over a Hubble time are thus crucial for studying intrinsic and secular processes able to affect the structure, morphology and dynamics of galaxies, for instance, the formation and evolution of bars, rings, lopsidedness, and bulges. Homogeneous observational data for such isolated galaxies are crucial for obtaining transparent scaling relationships and correlations that can be appropriately confronted to model predictions (see, e.g. Zavala et al. 2003; Avila-Reese et al. 2008). It is worth to mention that an important requirement for all these samples is that of a well defined and strong isolation criteria, along with a uniform quality data acquirement in several wavelengths, and of statistical completeness.
In order to overcome some limitations of one of the most representative census of isolated galaxies in the local Universe started a few decades back by Karachentseva (1973) (e.g. lack of uniform, deep and high resolution CCD imaging, scarce of uniform and reliable photometric data as well as incompleteness in high resolution spectroscopic data), we compiled a new catalog of isolated galaxies from The Sloan Digital Sky Survey (DR5) as part of the IAUNAM-KIAS collaboration. This hereafter called UNAM-KIAS catalog has been compiled by implementing a variation on the criteria developed by Karachentseva, including full redshift information as well as more accurate photometric information now available in the SDSS database. Using the three dimensional information, we are able to avoid missing galaxies that happen to lie close to background or foreground galaxies. One principal aim of this new catalog is, providing new isolated galaxy candidates with the highest possible statistical and redshift completeness to complement the existing lists of similarly selected galaxies in the local Universe. Another relevant aim is to provide a body of observational parameters that will be used for a comparison analysis of the predicted properties of different models of galaxy formation and evolution.
In a companion paper by Hernández-Toledo et al. 2008 (hereafter Paper 1) the results of a detailed morphological reevaluation of all the available isolated CIG galaxies (549) from the Karachentseva (1973) catalog in common to the SDSS (DR6) was presented. The methodology was based on an image processing scheme that takes advantage of the uniformity, photometric conditions and high resolution (0.4 /pix) of the SDSS CCD images. Here we have applied the same image procedures to proceed with a morphological classification for the isolated galaxies of the UNAM-KIAS catalog. A good understanding of these isolated, non–perturbed, galaxies and in particular of their morphological content is at the basis of any further correlations with other physical parameters and is one of the main legacies in the presentation of the UNAM-KIAS catalog.
The outline of the paper is as follows. Section 2 summarizes the relevant SDSS information and selection criteria used to compile the UNAM-KIAS catalog of isolated galaxies. In Section 3 the results of a detailed morphological classification are presented along with the public release of the UNAM-KIAS morphological atlas. In Section 4 some general properties, namely, completeness, apparent magnitude, color distributions, color-color diagrams, absolute magnitude-color and concentration-color diagrams as a function of morphological type are presented. Finally, in Section 5 a brief summary of the principal results and the main conclusions achieved are presented. The corresponding photometric and spectroscopic catalogs will be presented elsewhere. The widely accepted cosmology with km s-1 Mpc-1, and , suggested by the WMAP data (Spergel et al. 2003), is adopted throughout this paper.
2 The Sample and Selection Criteria
2.1 The SDSS DR5 Data.
The SDSS (York et al. 2000; Stoughton et al. 2002) is a survey to explore the large-scale distribution of galaxies and quasars by using a dedicated 2.5 m telescope at Apache Point Observatory (Gunn et al. 2006). The photometric survey has imaged roughly steradians of the northern Galactic cap in five photometric band-passes denoted , , , , and centered at 3551, 4686, 6165, 7481, and 8931, respectively, by an imaging camera with 54 CCDs (Fukugita et al. 1996; Gunn et al. 1998). The limiting magnitudes of photometry at a signal-to-noise ratio of 5:1 are 22.0, 22.2, 22.2, 21.3, and 20.5 in the five band-passes, respectively. The median width of the point-spread function (PSF) is typically 1.4 , and the photometric uncertainties are 2% rms. After image processing (Lupton et al. 2001; Stoughton et al. 2002; Pier et al. 2003) and calibration (Hogg et al. 2001; Smith et al. 2002; Ivezic et al. 2004; Tucker et al. 2006), targets are selected for spectroscopic follow-up observation.
We used a large-scale structure sample, DR4plus, from the New York University Value-Added Galaxy Catalog (NYU-VAGC; Blanton et al. 2005). The NYU-VAGC is a local galaxy catalog containing the SDSS galaxies with redshifts below about 0.3, and selects galaxies in the way similar to that by which the SDSS Main Galaxy sample is made (see Strauss et al. 2002 for the detailed selection criteria for the SDSS Main galaxies). The SDSS produced two galaxy samples; one is a flux-limited sample to extinction corrected apparent Petrosian -band magnitudes of 17.77 (the Main Galaxy sample), and a color-selected and flux-limited sample extending to (the Luminous Red Galaxy sample). The sample DR4plus is close to the SDSS Data Release 5 (Adelman-McCarthy et al. 2007). From this catalog, we selected the galaxies with -band magnitudes in the range . We did not use galaxies in the southern Galactic Cap because of the narrow angular extent of the survey regions. Our survey region covers 4464 deg2, containing 312,338 galaxies. Of the sample, approximately 6% lack measured redshifts because of fiber collisions, are assigned the spectroscopic redshift of the nearest neighbor, and are kept in our parent galaxy catalog. The isolated galaxies in our catalog are restricted to those with measured redshifts. However, we included galaxies with borrowed redshifts when the neighbors are searched to determine isolation of the target galaxies. This primary sample effectively has a magnitude range of only about 3.1 mag, which significantly limits the number of candidate isolated galaxies. To extend the range of magnitude, we attempt to include the bright galaxies with . However, the spectroscopic sample of the SDSS galaxies is not complete for . We thus searched for the various literature to borrow redshifts of the bright galaxies without SDSS spectra to increase the spectroscopic completeness. We added 5195 bright galaxies within our survey boundary to the primary sample (see Choi et al. 2007 for further details). In total, the final data set consists of 317,533 galaxies with known redshift and SDSS photometry.
2.2 Selection Criteria
Our isolation criteria is specified by three parameters. The first is the extinction-corrected Petrosian band apparent magnitude difference between a candidate galaxy and any neighboring galaxy, . The second is the projected separation to the neighbor across the line of sight, . The third is the radial velocity difference, . Suppose a galaxy has a magnitude and -band Petrosian radius . It is regarded as isolated respect to potential perturbers if the separation between this galaxy and a neighboring galaxy with magnitude and radius satisfies the conditions
| (1) | |||
| (2) |
or the conditions
| (3) | |||
| (4) | |||
| (5) |
for all neighboring galaxies. Here is the seeing-corrected Petrosian radius of galaxy , measured in band using elliptical annuli to consider flattening or inclination of galaxies (Choi et al. 2007). We choose . Using these criteria, we found a total of 1548 isolated galaxy candidates. Note that a magnitude difference of 2.5 in our selection criteria translates into a factor of about 10 in brightness similar to that imposed by Karachentseva (1973). We removed spurious objects due to poor image deblending, bright stars within the area of a galaxy, images with strong diffraction spikes and the presence of strong diffuse light from other sources. We also removed galaxies fainter than for reliability of our isolated galaxy sample because we require to galaxies in the primary sample defined by the magnitude limit of . Thus the final number of isolated galaxies that will comprise the UNAM-KIAS catalog amounts to 1520.
Since the SDSS project scanned a quarter of the sky, one can figure out the number of CIG galaxies intersected by the Sloan survey, namely; (1050/2) 525 galaxies, similar to the number of CIG galaxies ( 550) found in common to the SDSS (DR6) by Hernández-Toledo et al. (2008). The CIG and the UNAM-KIAS catalogs have an interesting overlapping at velocities up to 10000 km s-1 sharing 107 galaxies in common (see Table 1). This means that more than 400 CIGs were rejected after applying our selection criteria. Part of this can be explained by invoking equations 1 and 2 and imposing, to the sake of clarity, the condition (or in Karachentseva criteria). The isolation from similar-sized neighbors as projected in the sky is stronger in the UNAM-KIAS, rejecting cases where strict isolation is not satisfied by CIG galaxies and cases where isolation is satisfied but not equation 2 above. Equations (3, 4 and 5) also impose a stronger restriction to the presence of small-sized galaxies in the neighborhood of an isolated galaxy, rejecting a fraction of CIGs in such circumstances. Evidence for this comes from the refinement of the CIG isolation criteria in terms of collective tidal effects of small-sized neighbors (Verley et al. 2007) showing that an additional of the CIGs should be eliminated from the original sample. From the 107 CIG galaxies in common to the UNAM-KIAS, 77 belong to the refined sample in Verley et al (2007) indicating that our selection criteria includes much of such a refinement.
The UNAM-KIAS not only adds a significant number of new isolated galaxies at 10000 km s-1 vindicating some previously presumed non-isolated cases lacking radial velocity information (c.f Hernández-Toledo et al. 2009), but becomes a natural extension of the CIG for 10000 km s-1 up to a bit more than 20000 km s-1. It is therefore hoped that any joint study of the properties of these isolated galaxies should add necessarily more statistical significance and deeper insight to the origin of such galaxies.
2.3 The UNAM-KIAS Catalog
In Table 1 we list the general properties of the 1520 isolated galaxies sorted in Right Ascension: Column (1) gives a running identification number; Column (2), the galaxy name (following the IAU-designated SDSS naming convention), Column (3), an alternative name when available in the HyperLeda database, or CIG number when a match is produced, Column (4) the -band Petrosian magnitude corrected for Galactic extinction according to Schlegel et al. (1998) reddening maps, Column (5) the band Absolute Magnitude (as described in the following section), (6) the galaxy redshift, Column (7) the band minor-to-major isophotal axis ratio, as an indicator of the apparent inclination, Column (8) the morphological type according to HyperLeda and finally Column (9) the morphological type according to this work.
3 Morphological Content
3.1 Morphological Considerations
The general criteria to carry out a morphological classification of the SDSS galaxies have been established and presented in a companion paper by Hernandez-Toledo et al. (2008) where 550 isolated galaxies from the CIG in common to the SDSS (DR6) database were classified in detail following an image processing scheme that take advantage of the improved scale and dynamic range of the SDSS images and that enhances various low/high spatial frequency structural components in galaxies. Here only a brief description of our morphological considerations is presented.
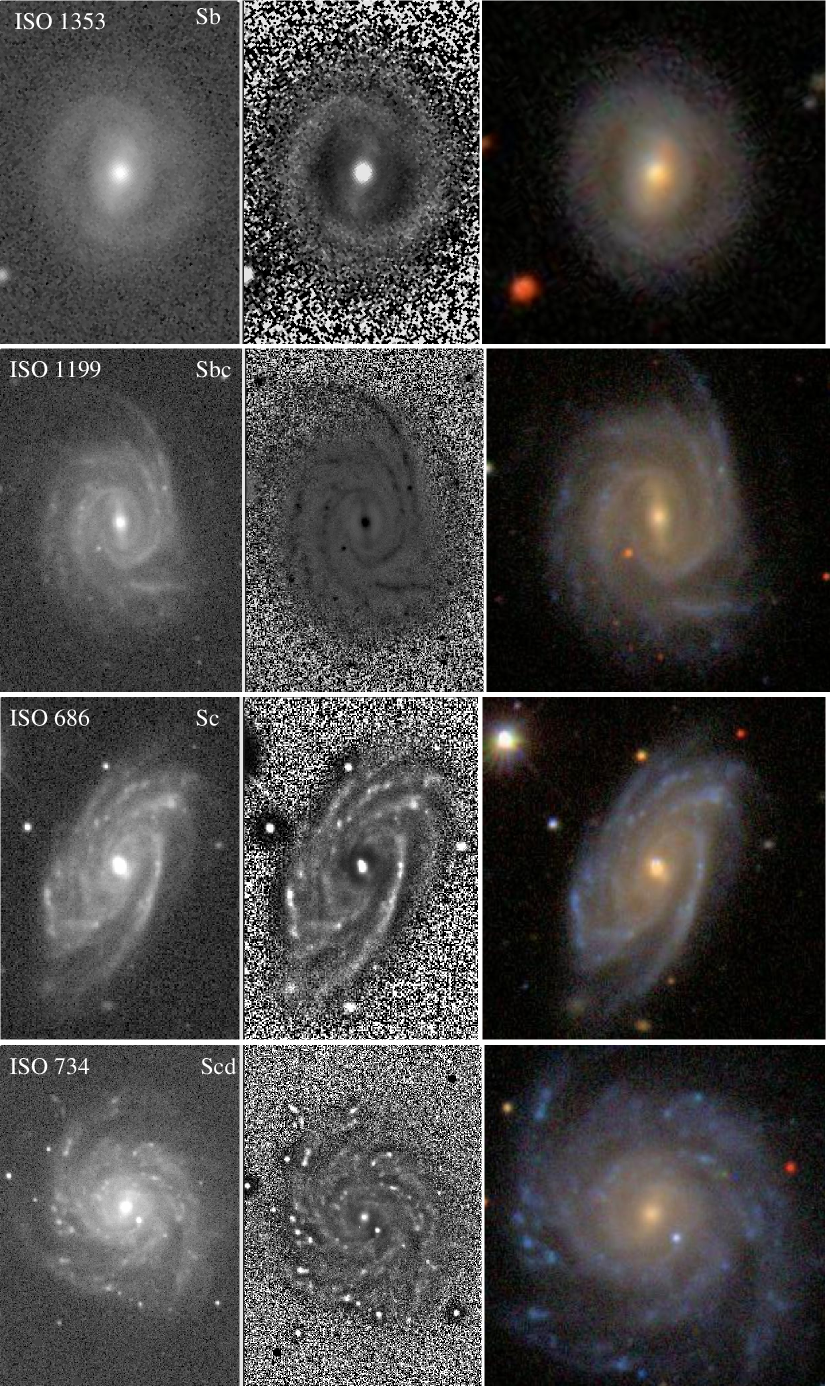
In order to discuss the optical morphology and its relationship to the global photometric properties, the isolated galaxies in the UNAM-KIAS catalog were visually inspected through mosaics of images including, from upper-left to lower-right panel: (1) a gray scale -band image where a logarithmic transformation was applied to look for bright/faint internal/external details, (2) a band filtered-enhanced image where a Gaussian kernel of various sizes is applied to look for internal structure in the form of star forming regions, bars, rings and/or structure embedded into dusty regions. The filtered-enhancing techniques (Sofue 1993) allow the subtraction of the diffuse background in a convenient way to discuss different morphological details, including low surface brightness features, (3) an RGB color image from the SDSS database to complement our morphological analysis. These images are useful to visualize the spatial distribution of various morphological components in the images (blue colors are for recent SF and red colors for older populations/dusty components).
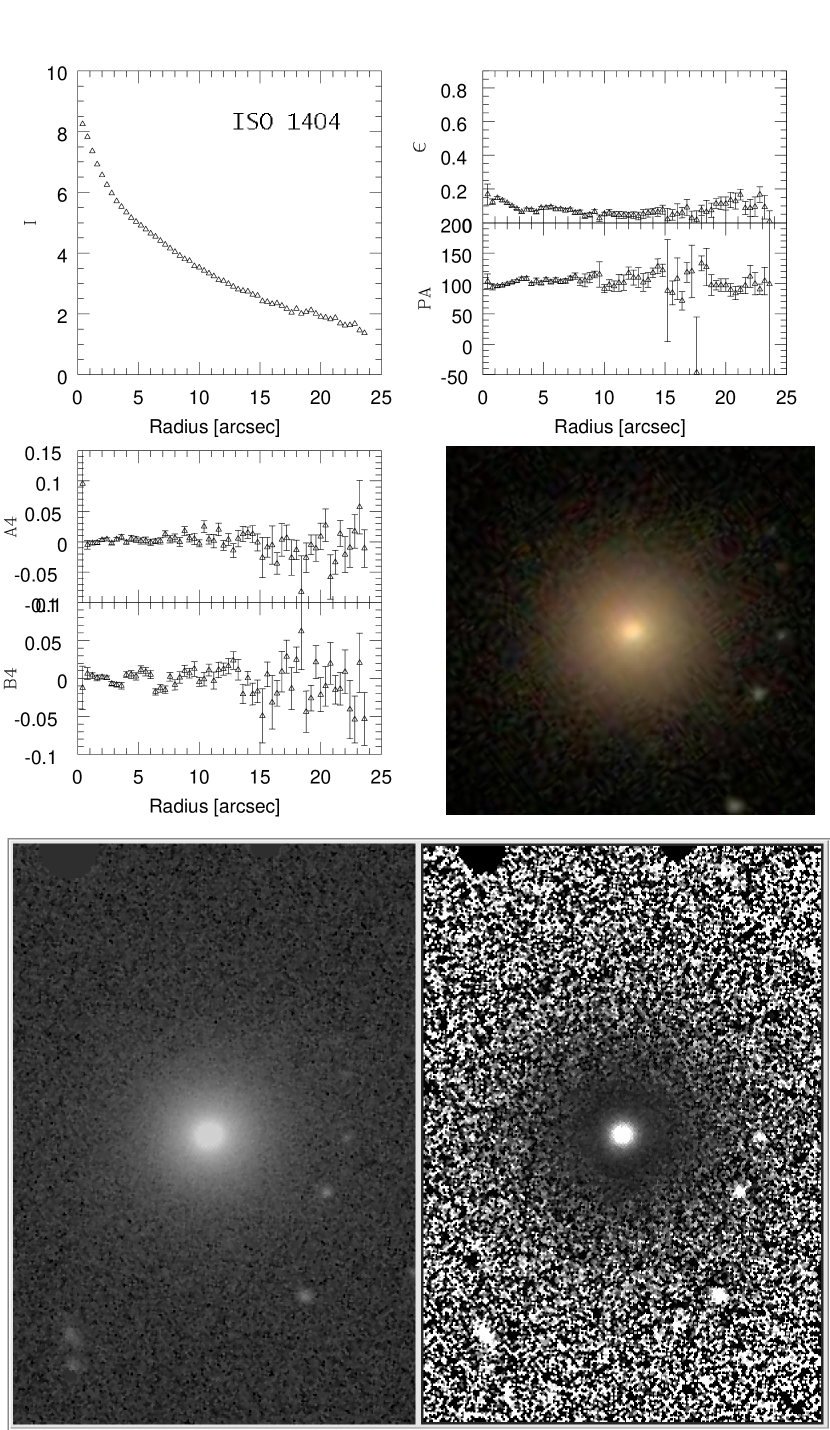
For E/S0 candidates, we further include in each mosaic, plots of surface brightness profiles and the corresponding geometric profiles (ellipticity , Position Angle and coefficients of the Fourier series expansions of deviations of a pure ellipse) from the band images to provide further evidence of boxyness/diskyness and other structural details.
The classification of the sample followed the basic Hubble sequence. For spiral types the bulge to disk ratio as judged from the observed prominence of the bulge, tightness of the arms, and the degree of resolution of structure along the arms/outer disk were considered. In the majority of the UNAM-KIAS spirals these features are well recognized, however in some cases the presence of structures like dust lanes, prominent knots and the apparent tightening of the arms in the central regions may confuse the identification of structures like inner rings or bars. Outer rings/pseudo-rings (Buta 1995) were also identified when possible. While the presence/absence of a bar was confirmed in some cases (SB), in the suspected cases we adopted the (SAB) nomenclature convention. The data presented in Table 1 reports the band minor-to-major isophotal axis ratio as an indicator of the inclination. This is important to evaluate the reliability of the classification presented here.
Figure 1 illustrates our image procedures, and shows 4 examples of UNAM-KIAS spirals classified according to the adopted criteria. The left panel shows a logarithmically scaled band image. The middle panel shows the corresponding filtered-enhanced version and the right panel the corresponding image from the SDSS database. The relative importance of the bulge, arms and their degree of resolution into fragmented clumps in Sb, Sbc, Sc and Scd types is considered. Some main structural features like bars and rings were identified and sometimes suspected. Each galaxy is identified by its ISO number and the corresponding morphological type. The average radial velocity of the UNAM-KIAS spirals is 10000 km s-1 and in some cases the structural details are difficult to recognize at v 10000 km s-1.
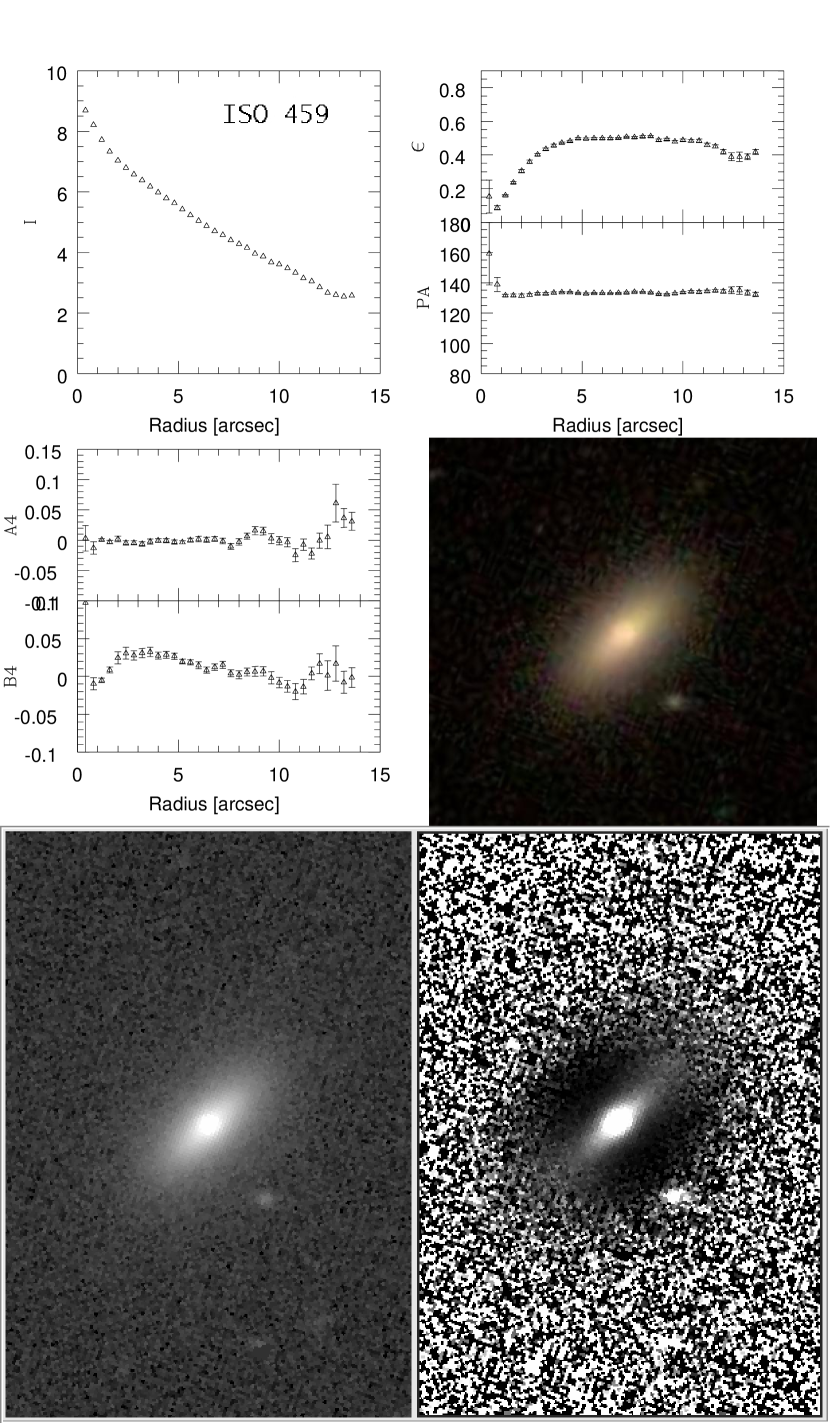
For early-type (E/S0) candidates, in addition to a careful inspection to the corresponding mosaic images, an evaluation of the geometric profiles after an isophotal analysis was carried out. Although the absolute value of the parameter depends on the inclination of the galaxy to the line of sight, its sign is useful to detect subtle disky features in the early-type candidates. A galaxy was judged to be an elliptical if the parameter showed: 1) no significant boxy () or disky () trend in the outer parts, or 2) a generally boxy () character in the outer parts. We further inspected the surface brightness profile for the presence/absence of 3) a linear component in the surface brightness-radius diagram. Central diskyness is considered not enough for an S0 classification. Figure 2 shows ISO 1404 to illustrate an elliptical galaxy and Figure 3 shows ISO 459 to illustrate a lenticular galaxy both at .
The -band filtered-enhanced image of ISO 1404 shows some sort of faint external envelope. We caution the reader about the reality of these features in some of our E/S0 candidates and that care must be taken about its interpretation, specially at velocities where our image methodology might not be good enough to resolve some structural details.
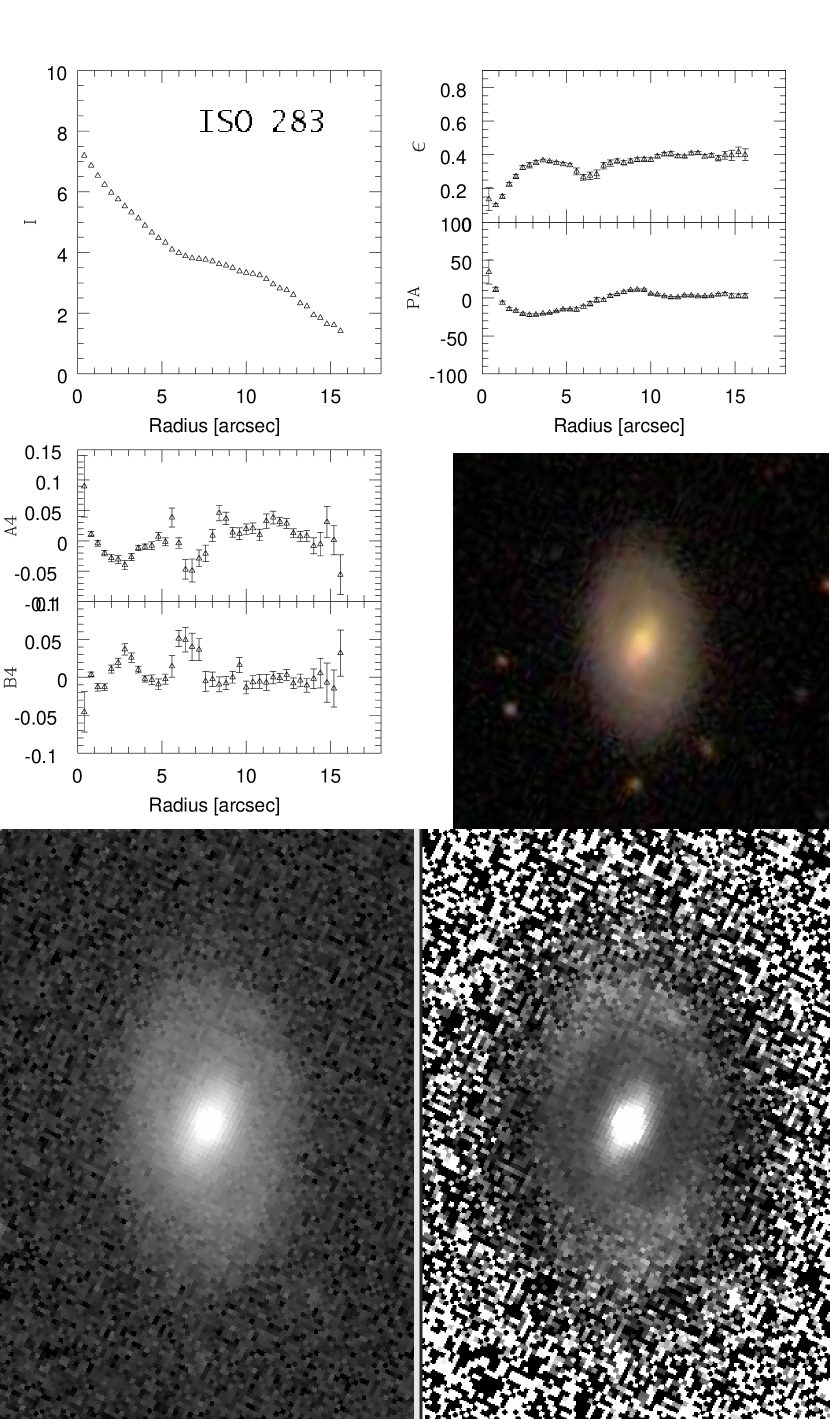
Another relevant goal of our image procedure is to isolate as much as possible the differences among lenticulars and very early-type spirals. Only from a more uniform and deeper survey like the CCD SDSS it is possible to systematically search for fainter features that could point to a more definite morphological classification. Here we use in addition, plots of both and radial profiles as an auxiliary tool to disentangle among S0 or Sa cases. Significant and not necessarily coupled changes in and radial profiles should be evidencing the presence of additional structure (in the form of a disk) for an S0 galaxy or in the form of arms, outer rings or envelopes for Sa galaxies. If further additional image processing did not show definite evidence of those features, we kept the galaxy type as lenticular. Figure 4 shows ISO 283 to illustrate a very early-type Sa galaxy. The advantages of the higher resolution and depth of the CCD SDSS images, in combination with our image procedures, is illustrated here for a galaxy with . Nevertheless, the reader should be cautious about the classification for distant E/S0/Sa galaxies where it may be difficult to discriminate among representative structural details.
3.2 Morphological Content: Results
Table 2 reports our morphological evaluation for 1318 UNAM-KIAS galaxies, after removing 202 not classifiable galaxies (advanced mergers, compact, poorly defined objects, edge-on and highly inclined galaxies, as devised from their aspect ratio). The results are presented according to 3 velocity regimes: , and . Column (1) gives the morphological type, Column (2) the morphological code number following HyperLeda convention (code numbers 9 and 10 have been re-assigned to include Sdm and Sm galaxies), Columns (3) and (4) give the number of galaxies of each morphological type in each velocity regime and the corresponding fraction, respectively.
Table 3 shows the results of our morphological classification this time reporting a morphological code number following the HyperLeda convention. Similarly to Table 2, code numbers 9 and 10 have been re-assigned to include Sdm and Sm galaxies. Column (1) gives a running identification number; Column (2), the galaxy name (following the IAU-designated SDSS naming convention), Column (3) gives the morphological code number, Column (4) indicates the presence of a bar structure (absence = 0, suspected = 1 definite = 2), Column (5) indicates the presence of rings (absence = 0, inner = 1, outer =2, both = 3).
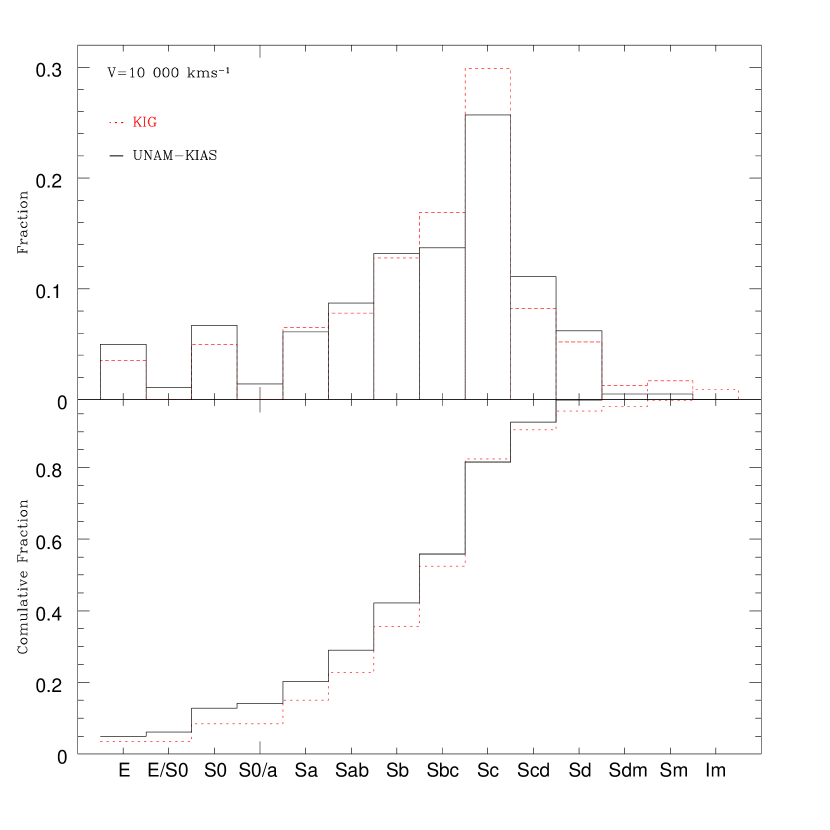
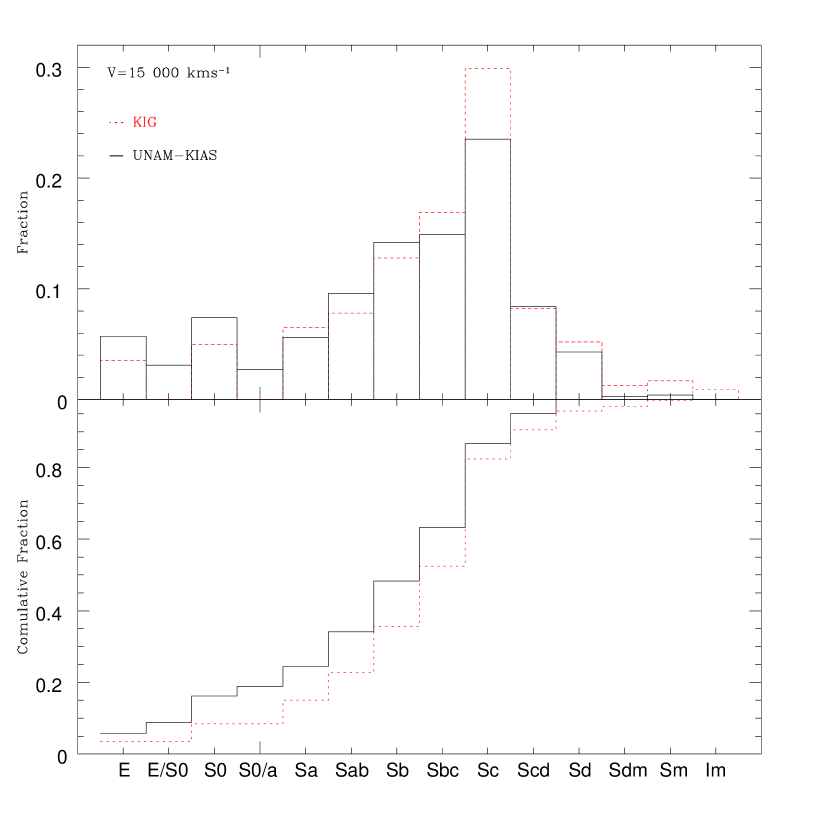
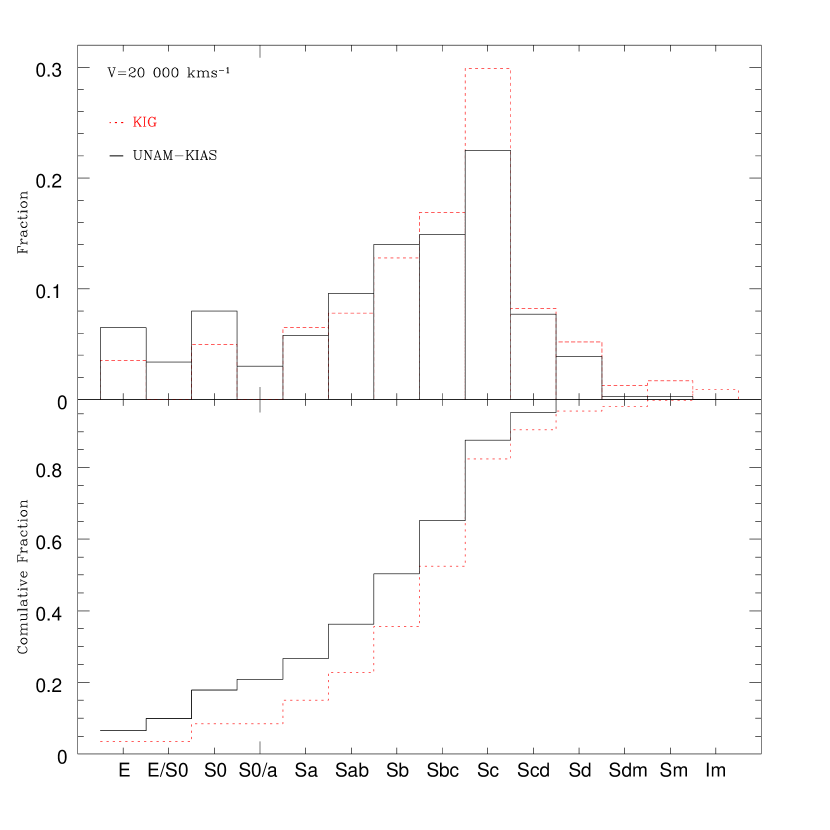
Figures 5, 6 and 7 illustrate the corresponding results in Table 2 according to 3 velocity regimes and in the form of histograms (upper panel) and cumulative distributions (lower panel). A classification avoiding transition E/S0 and S0/Sa cases was attempted as much as possible. For comparison, the results of our classification of 549 galaxies from the local CIG catalog in common to the SDSS (DR6) (Hernández-Toledo et al. 2008) are also presented.
Figures 5-7 show that at our classification is consistent with that reported for the CIG galaxies in common to the SDSS database by Hernández-Toledo et al. (2008) in the whole range of morphological types. The fraction of transition E/S0 and S0/Sa morphologies increases however at velocities denoting our increasing inability to distinguish structural details in early-type galaxies at such velocities. While the fraction of pure (E,S0) galaxies is 11% at , that fraction slightly increases up to 15% at , similar to the 14% of (E,S0) galaxies reported by Sulentic et al. (2006) for the whole CIG catalog. For early-type Sa, Sab spirals, a fraction 14-15% is obtained along the whole velocity range also consistent with the results in Hernández-Toledo et al. (2008) but definitely at odds with the 6% reported by Sulentic et al. (2006). Part of this discrepancy could be explained by the higher resolution and depth of the CCD SDSS images that in combination with our image procedures allow us to detect more easily high spatial frequency structure delineating arms, bars and rings.
According to our results, 80% of the UNAM-KIAS galaxies are in the range of (Sa-Sm) types. While 30 of the spirals in this galaxy sample are earlier than Sbc, 50 are of Sbc type or latter (up to Sm types). Higher resolution is important to distinguish between inner rings and ring-like features produced by the tightening of the arms, the fragmentation degree of the arms in spirals or structures like bars, clumps, dust lanes, among others. Our filtering process enhances high spatial frequency structures in spirals (and sometimes, depending on the kernel size, in ellipticals too) making easier the distinction among various spiral types. However, it is also natural to expect that the filtering process loose power as the galaxy distance increase. This could explain the slight variations reported for the late-type fractions in Table 2 at the 3 velocity regimes. Care had to be taken of not over-interpreting high spatial frequency features during the classification and all these results should be considered as a first homogeneous insight into the morphological content of the isolated galaxies in the UNAM-KIAS sample.
The information concerning bars (confirmed and presumed) indicates that about 62.9 of the isolated galaxies in the UNAM-KIAS catalog show evidence of barred structure: for 26.3 the evidence is clear (SB galaxies) and for 36.6 the bars are weak or suspected (SAB galaxies). The bar fraction (SAB + SB) is 27.8 for early types and 35 in late types. However we caution the reader about these numbers. The bar fraction reported here is mainly the result of our visual reevaluation of the mosaic images and only a fraction of the UNAM-KIAS spirals (mainly Sa types) were judged for the presence of bars through a photometric analysis of the band isophotal ellipticity and profiles (c.f Wozniak et al. 1995). Furthermore, the fraction of bars could increase to an additional 10-20 if the corresponding analysis were extended into the NIR bands (c.f. Hernández-Toledo et al. 2007; 2008). Similarly, the information for rings (inner, outer rings and pseudo-rings) in our sample is tentatively reported at the 36 level.
3.3 The Atlas
1420 isolated galaxies are presented in the form of mosaic images. Compact objects or other objects of non-definite nature were eliminated from the Atlas. For spiral galaxies of types later than Sa, we include, from upper-left to lower-right panels: (1) a gray scale -band logarithmically transformed image (2) a band filtered-enhanced version of the image in 1) where a Gaussian kernel of variable size was applied and (3) an RGB color image from the SDSS database.
For E/S0/Sa galaxies, in addition to the images in (1), (2) and (3), plots of the surface brightness and geometric profiles (ellipticity , Position Angle and coefficients of the Fourier series expansions of deviations of a pure ellipse) from the band images are provided.
The morphological diversity of the UNAM-KIAS sample is demonstrated in this Atlas. Interested people are invited to visit our
on-line web-site
(http://www.astroscu.unam.mx/hector/KIAS/kias.html).
4 General Properties of the UNAM-KIAS Sample
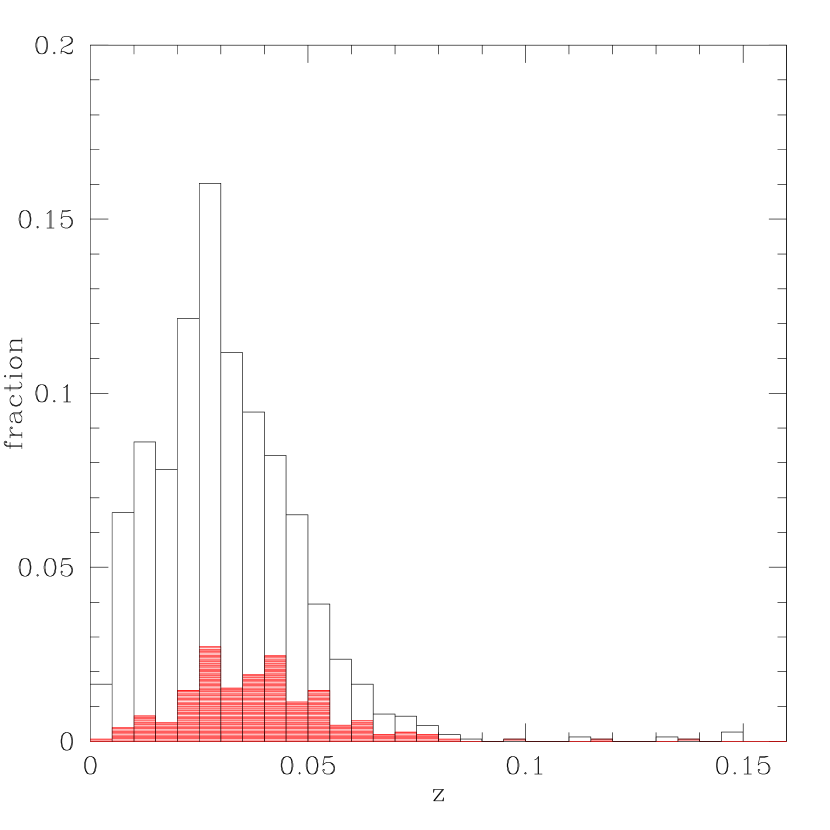
A first preliminary view of the relationship among some physical parameters of the galaxies in the UNAM-KIAS sample is presented. We start by showing in Figure 8 an histogram of the redshift distribution for the original number of galaxies (1520) in the UNAM-KIAS catalog. Plots are shown distinguishing by morphological type: early (ellipticals and lenticulars) and late (spirals and irregulars) types, based on our own classification.
The mean redshift for the UNAM-KIAS sample is , which corresponds to a comoving distance of 143 Mpc for an ; cosmology. The redshift distribution of the spirals in the UNAM-KIAS catalog is consistent with a Gaussian distribution and does not show evidence of obvious concentrations associated with major components of large-scale structure. However, the bins centered at and 0.042 in the E/S0 distribution show two peaks slightly deviating from a Gaussian. This may be interpreted as a departure from an homogeneous distribution but a more careful analysis needs to be done. The apparent homogeneity in redshift distribution of the galaxies in the UNAM-KIAS catalog points to a sample that is close to a local homogeneous component of the isolated galaxy distribution.
Aitoff projections in right ascension and declination in Figures 9 and 10 show the distribution of the UNAM-KIAS sample on the sky at 3000 km s velocity intervals covering the velocity interval from 0 to 21000 km . Due to their small number, galaxies at v 21000 km were not considered. After a new search for redshifts of Abell cluster cores in the literature we show their position at every redshift range according to increasing richness classes from 0 (crosses), 1 (asterisks), 2 (rhombus) and 3 (triangles).
There is no apparent association between the positions of the Abell cluster cores and the UNAM-KIAS galaxies in the 0 to 9000 km velocity intervals. However as the velocity increases, the presence of Abell clusters is more significant and a possible association of some our galaxies to those structures may not be negligible. Any correspondence of our galaxies to complex local large-scale structure is something that needs to be further explored in more detail.
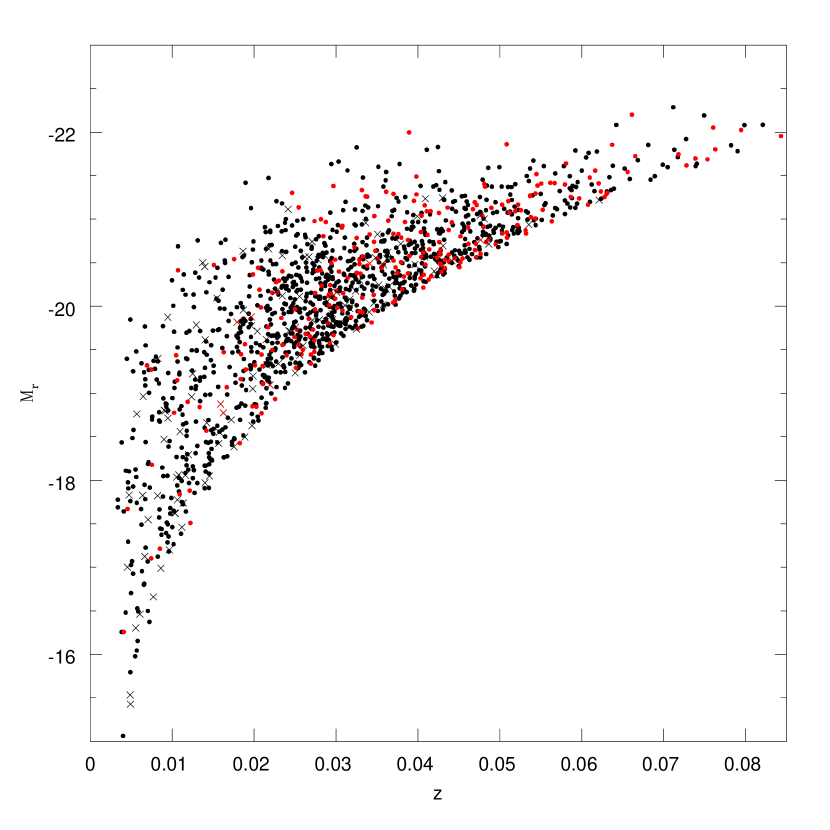
Figure 11 shows the distribution of isolated galaxies in the redshift -Absolute Magnitude diagram. Red dots represent E/S0 isolated galaxies while black dots correspond to spiral isolated galaxies. We use the seeing-corrected isophotal axis ratio in the band to take into account the inclination of the galaxies. Cross symbols indicate galaxies with inclinations greater than 70. The -band absolute magnitude is estimated from the SDSS apparent magnitudes by using the expression:
| (6) |
where is the -correction and E(z) = 1.6(z-0.1) is the mean luminosity evolution correction (Tegmark et al. 2004), is the comoving distance corresponding to redshift . We also omit the term in the absolute magnitude. We adopt a flat CDM cosmology with density parameters and to convert redshift to comoving distance. The -band rest-frame magnitude are Galactic extinction corrected (Schlegel et al. 1998) and -corrected to redshift of 0.1 (Blanton et al. 2003). This makes galaxies at have -correction of , independent of their spectral energy distributions (SEDs).
A wide range in absolute magnitudes is observed for the UNAM-KIAS sample. Notice a scarcity of nearby dwarf isolated E/S0 galaxies, and that bright E/S0 galaxies are preferentially found more at intermediate to high redshifts than spirals. The covered redshift range of UNAM-KIAS sample has increased with respect to that in the CIG catalog by about a factor of two. However, although deeper, this is also a magnitude-limited sample.
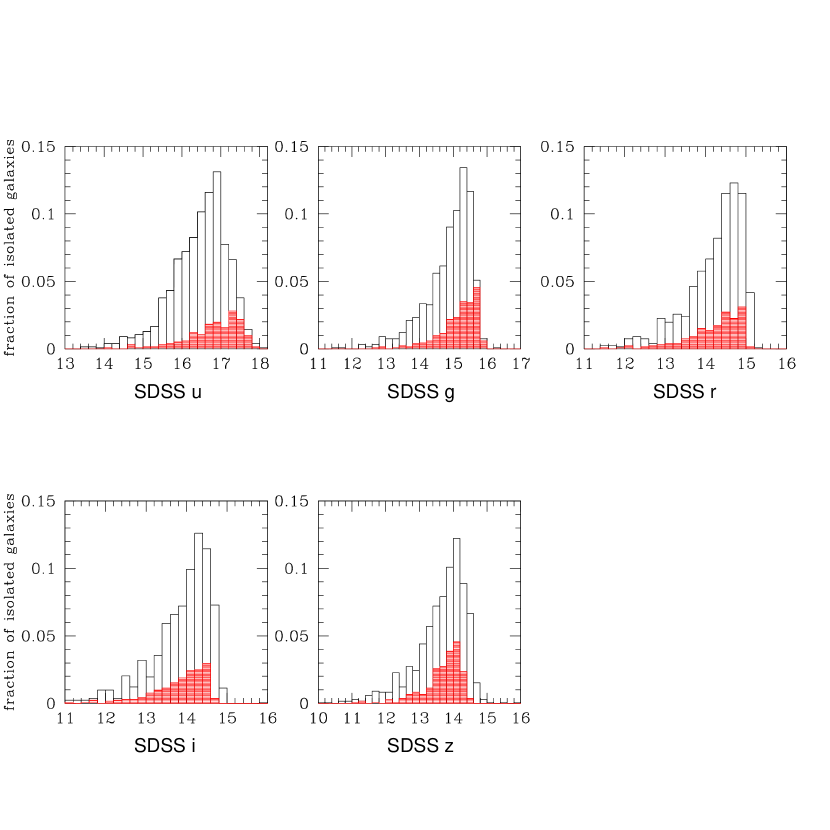
Figure 12 presents the distribution of apparent magnitudes in the SDSS photometric bands. Galaxies are sorted into E/S0 (red) and Sa-Sm (black). Apparent magnitudes were corrected for Galactic extinction according to Schlegel et al. (1998).
The cutoff at about mag in the band is a consequence of the selection criteria applied to this galaxies. The band magnitude distribution shows a similar range of variation as that shown in the band for the CIG galaxies in Karachentseva catalog, considering a proper photometric transformation.
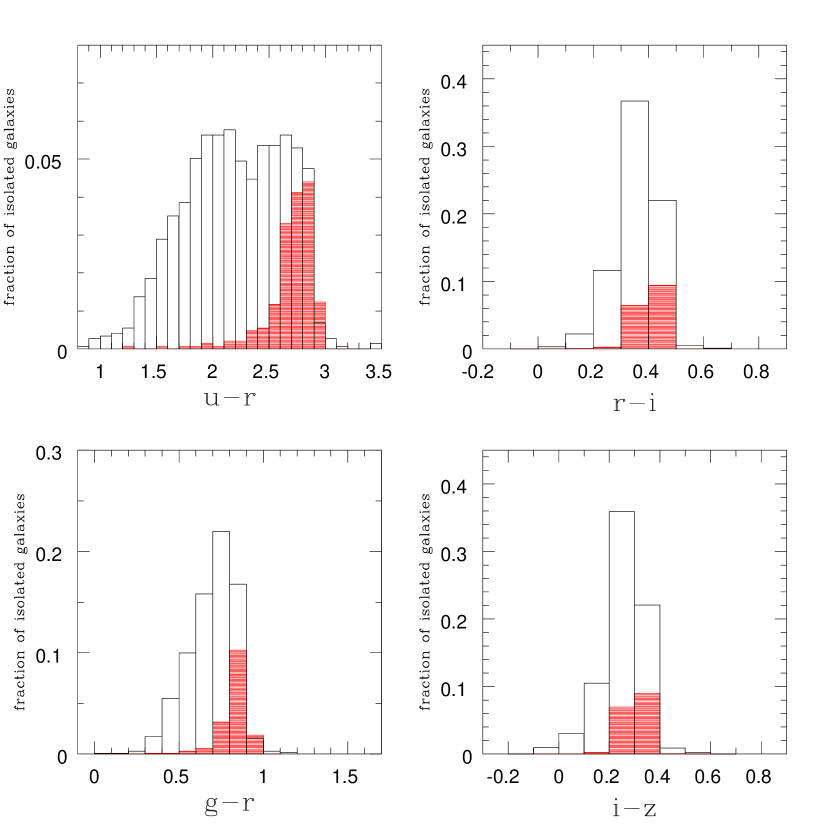
Figure 13 shows the (), (), () and () color distributions for the galaxies in the UNAM-KIAS catalog. Red histograms are denoted for E/S0 galaxies while black histograms are for Sa-Sm galaxies. The computed colors use extinction (Schlegel et al. 1998) and corrected magnitudes (Blanton 2003).
This figure shows how the () color index is more effective to distinguishing among different galaxy types, although a significant overlap is still appreciated at redder colors (see e.g. Park & Choi 2005). The () color could be used as a measure of star formation activity of galaxies in the recent past, as suggested by Choi et a. (2007).
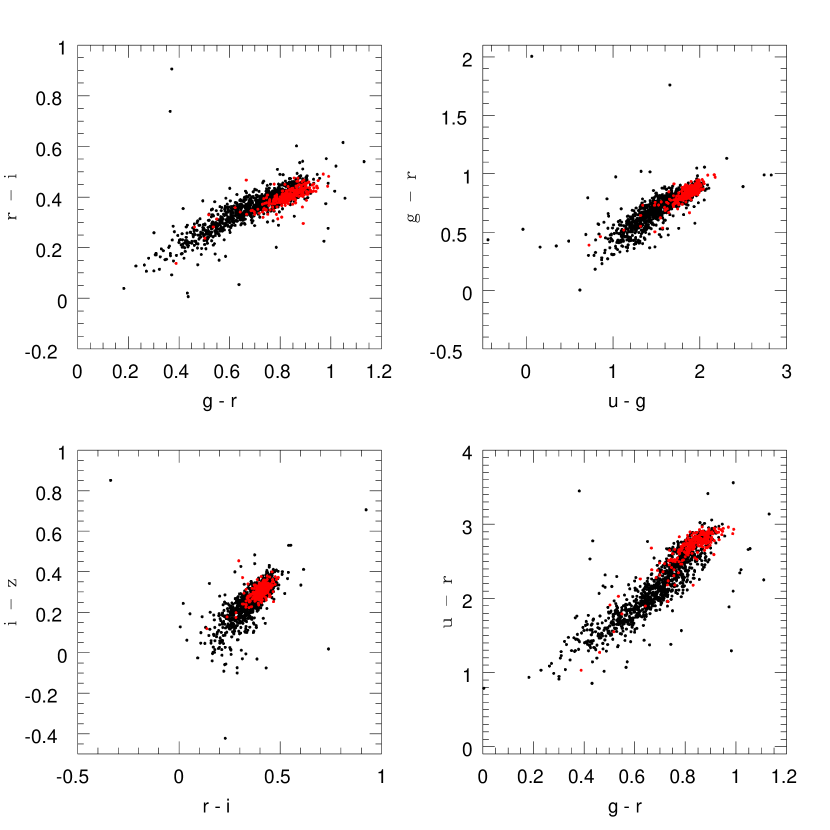
Figure 14 presents the apparent () vs (), () vs (), () vs () and () vs () color-color diagrams for all the galaxies in the UNAM-KIAS catalog. Cross symbols (red) denote E/S0 galaxies and inverted triangles (black) represent Sa-Sm galaxies.
Tighter color-color distributions are appreciated for the UNAM-KIAS Catalog compared to similar color-color diagrams for isolated galaxies from the SDSS(DR1) in Allam et al. 2005.
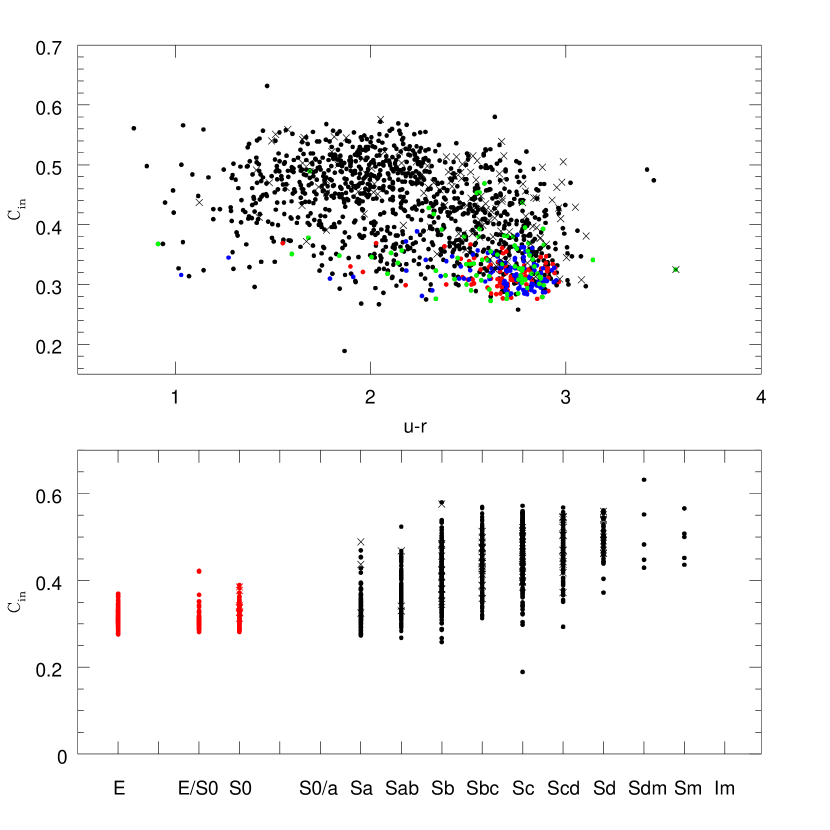
Figure 15 presents the behavior of the UNAM-KIAS isolated galaxies in the vs () and vs Morphological type diagrams. The inverse concentration index, is defined as where and are the radii from the center of a galaxy containing 50 and 90 of the flux in the band. Red dots are for E galaxies, blue dots for S0 galaxies and green dots for Sa galaxies.
Late-types are loosely distributed in the vs () diagram showing a broad overlap with early-type galaxies. Notice how highly inclined galaxies are shifted towards redder colors. The lower panel of Figure 15 shows that the inverse concentration index follows a loose tendency with morphological type. Early types are the most concentrated. The tendency is fuzzy due to the big scatter of values at later types. The high degree of overlap in morphological types at a given value in this diagram illustrates about the difficulty to distinguish not only between E/S0, S0/Sa classes but also between early and late-types by simply establishing cuts in the domain. Figure 15 compares with the similar plot for the randomly chosen SDSS galaxies brighter than shown in Figure 1 of Park & Choi (2005).
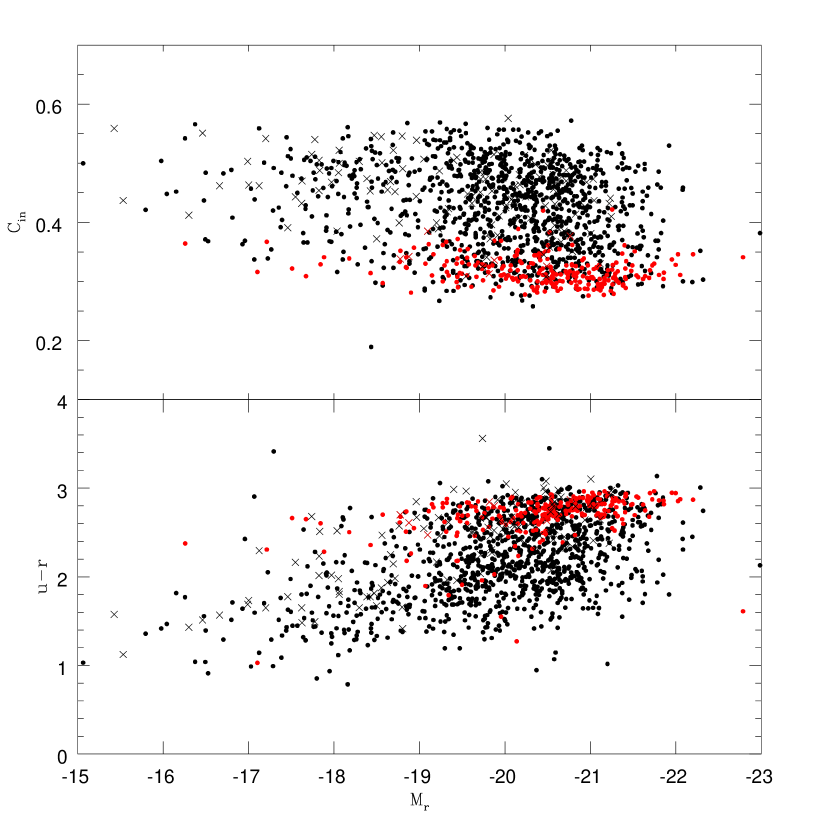
Finally Figure 16 shows the vs and color magnitude () vs diagrams.
The inverse concentration index of early-type galaxies is nearly independent of absolute magnitude but a very slight dependence towards lower concentration is noticed at fainter magnitudes. For late-type galaxies it is more difficult to see a tendency due to the large scatter at all absolute magnitude intervals. This trend has been also observed for the general SDSS early-type galaxies (see Fig. 3 of Choi et al. 2007). We inspect the color-magnitude diagram in the lower panel of Figure 16 to explore how a segregation into early (red symbols) and late-type (black symbols) sequences is possible in isolated environments. We notice a tendency of isolated early-type galaxies to have redder colors at brighter absolute magnitudes. In the case of the general SDSS galaxies the red sequence of early-type galaxies has a break in the slope at about (Fig. 3 of Choi et al. 2007). Isolated late-type galaxies show a larger scatter in () color compared to early-type galaxies. Notice that the color distribution of late-type galaxies overlaps with early types practically at all absolute magnitude intervals and thus a line dividing the sequences of red and blue galaxies is difficult to find. Although the fraction of early types located outside the red sequence is low, this diagram illustrates the danger of generating samples of early-type galaxies by a simple cut in the absolute magnitude-color diagram. We also detect a relatively small fraction of blue early-type galaxies that may be associated with recent merger events. Notice that a significant fraction of the most inclined galaxies are located towards fainter magnitudes and redder colors due to internal extinction (see also Fig. 12 of Choi et al. 2007 for a comparison).
4.1 Completeness
An estimate of the statistical completeness of the sample by means the () test (Schmidt 1968) is presented. For each object we estimated the volume at a radius corresponding to its distance and the maximum volume at a radius corresponding to the maximum distance given the magnitude limit of the UNAM-KIAS sample. We then calculate the average for objects brighter than a given magnitude limit. Figure 17 shows the results of test as a function of limiting apparent magnitudes. Approximately 1450 isolated galaxies were included in the test. Due to their small number, galaxies with radial velocities in excess of 20000 km s-1 were eliminated from this analysis.
The decreasing trend observed in the (12-13.6) band interval is interpreted as a statistical fluctuation or incompleteness due to small number of galaxies in those magnitude bins. Since the parent galaxy sample from which the UNAM-KIAS was select is intrinsically incomplete at bright magnitudes and in spite that bright galaxies from other catalogs were added, the effect this supplement had on completeness appeared to be non-significant and reflects the difficulty of having nearby isolated bright galaxies. At intermediate (13.7-15.2) band magnitudes where most of our galaxies yield statistical significance to the test, the UNAM-KIAS is about 80level of completeness for galaxies satisfying our selection criteria. Incompleteness of this sample beyond 15.2 band Petrosian magnitudes, is a natural consequence of our selection criteria that excludes galaxies beyond that magnitude range to ensure that we are within the completeness limit of the parent sample (Section 2.2). Notice how the faint-end completeness limit in the band magnitude is correctly recovered from this test.
5 Summary and Conclusions
In order to overcome some limitations of the previous major sample of isolated galaxies in the local universe by Karachentseva (1973); to mention, a lack of uniform, deep and high resolution CCD imaging, the scarcity of uniform and reliable photometry and high resolution spectroscopic incompleteness, we compiled a new catalog of isolated galaxies from the Sloan Digital Sky Survey (DR5) that adds a significant number of new isolated galaxies in the local Universe also complementing the previous census.
This catalog coined as UNAM-KIAS, has been compiled by implementing a variation on the criteria developed by Karachentseva, including full redshift information as well as more accurate photometric information now available in the SDSS database.
We have taken advantage from the high resolution ( 0.4 /pix) and high dynamic range of the SDSS images by implementing a simple digital image processing scheme that enhances structural details in galaxies of various types supporting a detailed morphological characterization for the isolated galaxies in the UNAM-KIAS catalog. A Morphological Atlas containing detailed mosaic images for the galaxies is also presented and released along with this paper. The classification presented here preserves the optically observed morphology but takes into account structural information provided from the digital image processing, the isophotal analysis (E/S0/Sa cases) and the color information provided by the SDSS RGB images.
The isolated galaxy candidates in the UNAM-KIAS catalog show a wide morphological diversity, from E to Sm types. 80 of these galaxies are in the range of (Sa-Sm) types, 14.5 are of (E,S0) type and 50 are of Sbc type or latter (up to Sm types). Although this is an attempt to provide an uniform morphological classification, the reader should notice that this classification is not free of uncertainties, specially for some E/S0/Sa galaxies at larger distances where our image procedures may no longer be enough for disentangling among their characteristic structural properties. A tentative fraction of about 62.9 of the isolated galaxies in the UNAM-KIAS catalog show evidence of barred structure: for 26.3 the evidence is clear (SB galaxies) and for 36.6 the bars are weak or suspected (SAB galaxies). The bar fraction (SAB + SB) by morphological type is 27.8 for early types and 35 for late types.
Although we did not a systematic search for bars in the present study, we notice that the tentative fraction of bars (62.9) is not so different from that reported for galaxies in other environments. This could be suggesting that interactions and the global effects of the group/cluster environment are not crucial for the formation/destruction of bars. However, in an analysis of a volume-limited sample of the general SDSS galaxies, Lee & Park (2008) have found a dependence of the bar fraction on the large-scale background density when the bars are visually identified. It is fundamental thus to carefully infer the fraction of bars in the UNAM-KIAS sample by an homogeneous method.
A first exploration of the general properties of the galaxies in the UNAM-KIAS catalog and of the relations among some of their representative physical parameters leaded us to some important conclusions:
a) The spatial distribution of the UNAM-KIAS galaxies, as seen from their redshift distribution does not show evidence of obvious concentrations associated with major components of large-scale structure in the local Universe but a more careful study in this direction needs to be done. This apparent homogeneity points to a sample that is close to a local homogeneous component of the isolated galaxy distribution.
b) Although the UNAM-KIAS galaxies comprise a nearby sample, its redshift interval has increased with respect to that in the CIG catalog by about a factor of two, making it deeper and representative of the galaxies in this environment in the local Universe.
c) The UNAM-KIAS sample is also diverse in terms of physical properties explored here. A scarcity of nearby dwarf isolated E/S0 galaxies and a tendency of bright E/S0 galaxies being farther away than spiral galaxies is observed.
d) The UNAM-KIAS catalog of isolated galaxies is a magnitude-limited sample that is reasonably complete ( 80) up to 15.2 band apparent magnitudes, providing statistical significance to studies of these galaxies in isolated environments.
The finding of reasonably nearby isolated galaxies uniformly-selected and with detailed morphological information is of high relevance. The UNAM-KIAS catalog along with the most isolated galaxies of the CIG catalog that are in common to the SDSS will provide a unique database that can be used for several studies, including (i) studies of the environmental effects on galaxies belonging to groups and clusters, and (ii) for confronting with theoretical and model predictions of galaxy evolution.
Other relevant aims, derived from the present study, are to provide as much as possible a new body of observational parameters for these isolated galaxies in different wavelengths that will greatly enable to a major understanding of the nature of the galaxies in this environment.
References
- Adelman-McCarthy et al. (2007) ade07 Adelman-McCarthy, J. K., et al. 2007, ApJS, 172, 634
- Allam et al. (2005) Allam, S., Tucker, D. T., Lee, B. C., & Smith, J. A. 2005 AJ, 129, 2062
- Avila et al. (2008) Avila-Reese, V., Zavala, J., Firmani, C., & Hernandez-Toledo, H. M. 2008, arXiv0807.0636
- Blanton (2003) Blanton, M. R., et al. 2003, AJ, 125, 2348
- Blanton et al. (2005) Blanton, M. R., et al. 2005b, ApJ, 129, 2562
- Buta (1995) Buta, R. 1995 ApJS, 96, 39
- Choi et al. (2007) Choi, Y.-Y., Park, C., & Vogeley, M. S. 2007, ApJ, 658, 884
- Colles et al. (2001) Colless, M., et al. 2001, MNRAS, 328, 1039
- De Lucia et al. (2006) De Lucia, G., Springel, V., White, S., Croton, D., & Kauffmann, G. 2006, MNRAS, 366, 499
- Fukugita et al. (1996) Fukugita, M., Ichikawa, T., Gunn, J. E., Doi, M., Shimasaku, K. & Schneider, D. P. 1996, AJ, 111, 1748F
- Gunn et al. (1998) Gunn, J. E., Carr, M., Rockosi, C., et al. 1998, AJ, 116, 3040G
- Gunn et al. (2006) Gunn, J. E., et al. 2006, AJ, 131, 2332
- Hernández-Toledo et al. (2007) Hernández-Toledo, H. M., Zendejas-Domínguez, J., Avila-Reese, V. 2007 AJ, 134, 2286H
- Hernández-Toledo et al. (2008) Hernández-Toledo, H. M., Ortega-Esbrí, S.
- Hernández-Toledo et al. (2009) Hernández-Toledo, H. M., Cano-Díaz, M., Puerari, I., Valenzuela-Tijerino, O., García-Barreto, J. A. 2009 AJ, submitted
- Hogg et al. (2001) Hogg, D. W., Finkbeiner, D. P., Schlegel, D. J. & Gunn, J. E. 2001, AJ, 122, 2129
- Ivezic et al. (2004) Ivezić, Z., et al. 2004, AN, 325, 583.
- Jones et al. (2004) Jones, D. H., Saunders, W., Colless, M., Read, M. A., Parker, Q. A., Watson, F. G., Campbell, L. A., Burkey, D., et al., 2004, MNRAS, 355, 747.
- Jones et al. (2009) Jones, D. H., Read, M. A., Saunders, W., Colless, M., Jarret, T., Parker, Q. A., et al., 2009, MNRAS, Submitted.
- Karachentseva (1973) Karachentseva, V. E. 1973, Astrof. Issledovanija Byu. Spec. Ast. Obs., 8, 3
- Lee & Park (2008) Lee, G.-H., & Park, C., 2008, in preparation
- Loveday (1996) Loveday, J., 1996, MNRAS, 278, 1025
- Lupton et al. (2001) Lupton, R. H., Gunn, J. E., Ivezíc, Z., Knapp, G. R., Kent, S., & Yasuda, N. 2001, in ASP Conf. Ser. 238, Astronomical Data Analysis Software and Systems X, ed. F. R. Harnden, Jr., F. A. Primini, & H. E. Payne (San Francisco: ASP), 269
- Park & Choi (2008) Park, C., & Choi, Y.-Y., 2008, ApJ, in press
- Park et al. (2007) Park, C., Choi, Y.-Y., Vogeley, M. S., Gott, J. R., & Blanton, M. R. 2007, ApJ, 658, 898
- Park et al. (2008) Park, C., Gott, J. R., & Choi, Y.-Y. 2008, ApJ, 674, 784
- Pier et al. (2003) Pier, J. R., Munn, J. A., Hindsley, R. B., Hennessy, G. S., Kent, Si. M., Lupton, R. H., & Ivezíc, R. 2003, AJ, 125, 155
- Schlegel et al. (1998) Schlegel, D.J., Finkbeiner, D.P. & Davis, M., 1998, ApJ, 500, 525
- Schmidt (1968) Schmidt, M., 1968, ApJ, 151, 393
- Smith et al. (2002) Smith, J. A., et al. 2002, AJ, 123, 2121
- Sofue (1993) Sofue, Y. 1993, PASP, 105, 308
- Spergel et al. (2003) Spergel, D. N., et al. 2003, ApJS, 148, 175
- Stoughton et al. (2002) Stoughton, C., et al. 2002, AJ, 123, 485
- Strauss et al. (2002) Strauss, M. A., et al. 2002, AJ, 124, 1810
- Sulentic et al. (2006) Sulentic, J. W., Verdes-Montenegro, L., Bergond, G., et al. 2006, A&A, 449 937
- Tegmark et al. (2004) Tegmark, M., et al. 2004, ApJ, 606, 702
- Tucker et al. (2006) Tucker, D., et al. 2006, Astron. Nachr., 327, 821
- Wozniak et al. (1995) Wozniak et al. 1995, A&AS, 111, 115
- York et al. (2000) York, D., et al. 2000, AJ, 120, 1579
- Zavala et al. (2003) Zavala, J., Avila-Reese, V., Hernández-Toledo, H., Firmani, C. 2003, A&A, 412, 633
| ID | SDSS ID | A | HLeda | Type | |||||
|---|---|---|---|---|---|---|---|---|---|
| 1 | J072246.73+413929.6 | 13.82 | -20.23 | 0.023 | 0.39 | Sb | SBbc(r) | ||
| 2 | J072333.23+412605.5 | 13.41 | -20.80 | 0.027 | 0.87 | SABb | SBc(r) | ||
| 3 | J072635.39+431746.8 | 12.77 | -19.43 | 0.010 | 1 | E | E | ||
| 4 | J072642.64+391724.5 | 14.64 | -20.61 | 0.045 | 0.54 | S? | SABbc | ||
| 5 | J072719.37+442538.3 | 14.85 | -19.73 | 0.032 | 0.39 | S? | Sa | ||
| 6 | J072954.29+372706.3 | 13.45 | -21.37 | 0.035 | 0.64 | Sbc | SBc(r) | ||
| 7 | J073054.71+390110.1 | 14.16 | -19.19 | 0.019 | 0.3 | Sb | SBc(r) | ||
| 8 | J073548.83+401938.2 | 14.67 | -20.54 | 0.042 | 0.68 | S? | - | ||
| 9 | J073901.44+315452.9 | 14.26 | -20.85 | 0.040 | 0.77 | SB0 | |||
| 10 | J074001.42+321140.5 | 14.65 | -19.68 | 0.027 | 0.51 | S? | Sab | ||
| 11 | J074018.11+282751.4 | 14.31 | -19.65 | 0.022 | 0.9 | Sab | |||
| 12 | J074022.74+231629.9 | 13.29 | -18.17 | 0.007 | 0.66 | E | E | ||
| 13 | J074109.47+492347.0 | 14.66 | -19.98 | 0.030 | 0.96 | S? | SABc | ||
| 14 | J074112.48+424457.7 | 13.47 | -21.44 | 0.036 | 0.64 | E? | Sa | ||
| 15 | J074127.73+294009.0 | 14.55 | -19.56 | 0.023 | 0.47 | SABb(r) | |||
| 16 | J074158.62+231035.0 | 14.18 | -21.13 | 0.043 | 0.71 | S? | E/S0 | ||
| 17 | J074232.38+491127.9 | 14.35 | -17.79 | 0.009 | 0.45 | Sa | Sd | ||
| 18 | J074252.09+220645.7 | 13.81 | -20.23 | 0.028 | 1 | SBc(r) | |||
| 19 | J074330.38+225549.9 | 14.52 | -19.71 | 0.024 | 0.28 | Sbc | Sc | ||
| 20 | J074403.33+330438.6 | 14.64 | -21.16 | 0.055 | 0.73 | S? | SABbc |
| v10000km | v15000km | v20000km | ||||||
|---|---|---|---|---|---|---|---|---|
| Type | T | |||||||
| E | -5 | 42 | 0.050 | 69 | 0.057 | 86 | 0.065 | |
| E/S0 | -3 | 9 | 0.011 | 37 | 0.031 | 45 | 0.034 | |
| S0 | -2 | 56 | 0.067 | 89 | 0.074 | 105 | 0.080 | |
| S0/Sa | 0 | 12 | 0.014 | 32 | 0.027 | 39 | 0.030 | |
| Sa | 1 | 51 | 0.061 | 67 | 0.056 | 76 | 0.058 | |
| Sab | 2 | 73 | 0.087 | 115 | 0.096 | 126 | 0.096 | |
| Sb | 3 | 110 | 0.132 | 171 | 0.142 | 185 | 0.140 | |
| Sbc | 4 | 114 | 0.137 | 179 | 0.149 | 197 | 0.149 | |
| Sc | 6 | 215 | 0.257 | 283 | 0.235 | 297 | 0.225 | |
| Scd | 7 | 93 | 0.111 | 101 | 0.084 | 102 | 0.077 | |
| Sd | 8 | 52 | 0.062 | 52 | 0.043 | 52 | 0.039 | |
| Sdm | 9 | 4 | 0.005 | 4 | 0.003 | 4 | 0.003 | |
| Sm | 10 | 4 | 0.005 | 4 | 0.003 | 4 | 0.003 | |
| E-S0 | 98 | 0.117 | 158 | 0.131 | 191 | 0.145 | ||
| Sa-Sd | 708 | 0.848 | 968 | 0.805 | 1035 | 0.785 | ||
| Sb-Sc | 439 | 0.526 | 633 | 0.526 | 679 | 0.515 |
| ID | SDSS ID | T | Bar | Ring | |
|---|---|---|---|---|---|
| 1 | SDSS J072246.73+413929.6 | 4 | 2 | 1 | |
| 2 | SDSS J072333.23+412605.5 | 5 | 0 | 1 | |
| 3 | SDSS J072635.39+431746.8 | -5 | 0 | 0 | |
| 4 | SDSS J072642.64+391724.5 | 4 | 1 | 0 | |
| 5 | SDSS J072719.37+442538.3 | 1 | 0 | 0 | |
| 6 | SDSS J072954.29+372706.3 | 5 | 0 | 1 | |
| 7 | SDSS J073054.71+390110.1 | 5 | 0 | 1 | |
| 8 | SDSS J073548.83+401938.2 | - | 0 | 0 | |
| 9 | SDSS J073901.44+315452.9 | -2 | 2 | 0 | |
| 10 | SDSS J074001.42+321140.5 | 2 | 0 | 0 | |
| 11 | SDSS J074018.11+282751.4 | 2 | 0 | 0 | |
| 12 | SDSS J074022.74+231629.9 | -5 | 0 | 0 | |
| 13 | SDSS J074109.47+492347.0 | 5 | 1 | 0 | |
| 14 | SDSS J074112.48+424457.7 | 1 | 0 | 0 | |
| 15 | SDSS J074127.73+294009.0 | 3 | 1 | 1 | |
| 16 | SDSS J074158.62+231035.0 | -3 | 0 | 0 | |
| 17 | SDSS J074232.38+491127.9 | 7 | 0 | 0 | |
| 18 | SDSS J074252.09+220645.7 | 5 | 0 | 1 | |
| 19 | SDSS J074330.38+225549.9 | 5 | 0 | 0 | |
| 20 | SDSS J074403.33+330438.6 | 4 | 1 | 0 |