Compact Sunyaev-Zeldovich ‘hole’ in the Bullet Cluster
Abstract
We present 18 GHz observations of the Bullet cluster from the Australia Telescope Compact Array; in particular, a high angular resolution measurement of the substructure in Sunyaev-Zel’dovich Effect (SZE). We report the discovery of a compact SZE ‘hole’ in the galaxy cluster. The SZE hole does not correspond to any bright feature in X-ray, optical or lensing maps; in general, the relatively deeper SZE features appear to avoid the regions with the most intense X-ray emission. These imply that the gas pressure distribution differs significantly from the distributions in gas emission measure, galaxy and dark matter distributions. This has implications for the gas physics and evolution in the cluster merger event. SZE displaced from X-ray centres implies that modeling cluster dynamics is non-trivial; our observations indicate that our current lack of understanding cluster merger astrophysics may be a limitation to modeling the cosmological distribution in SZE cluster counts and the cluster SZE contribution to small-angle cosmic microwave background (CMB) anisotropy. The SZE distribution in the western parts of the cluster are cospatial with the radio halo indicative of a common origin for the hot and relativistic electrons in the turbulent wake of the Bullet.
Subject headings:
cosmic background radiation — galaxies: clusters: individual (1E 0657–56, RX J0658–5557) —intergalactic medium — radio continuum: general — techniques: interferometric1. Introduction
1E065756, known as the ‘Bullet Cluster’, is one of the hottest known clusters that has been well-studied over the last decade for a variety of reasons; namely, the existence of a strong radio halo (Liang et al., 2000), the Sunyaev-Zel’dovich effect (Halverson et al. (2009) and references therein), its X-ray brightness (Markevitch et al., 2002), though most notably in providing the most direct proof of the existence of dark matter (Clowe et al., 2006). It is a cluster collision/merger event at 0.296, with the larger, westward cluster being 10 times the mass of the smaller ‘bullet’.
Observations from the South Pole Telescope (Lueker et al., 2009) show that on arcminute and smaller scales observed CMB anisotropy power is significantly less than levels expected from models of SZE from a cosmological distribution of clusters. This discrepancy may be an indication of our lack of understanding of the environmental impact of cluster mergers. This paper presents sub-arcmin angular resolution observations of the SZE in the Bullet cluster, which demonstrates that the relation between SZE and X-ray emission is complex and requires additional physics that may be related to the impact of the merger on intracluster gas.
2. Radio Observations and Imaging
The Australia Telescope Compact Array (ATCA) is a radio interferometer with six 22-m antennas, five of which may be positioned on stations along a ‘T’-shaped rail track that is 3-km along E-W and 214-m along N-S. Observations of the Bullet cluster were made in a pair of 2-GHz bands: a ‘17-GHz band’ covering frequencies 16-18 GHz and a ‘19-GHz band’ covering the range 18-20 GHz. Each of the 2-GHz wide bands were subdivided into 2048 frequency channels. All observations were in full polarization mode and recorded multi-channel continuum visibilities.
X-ray images of the cluster show two peaks separated by and the detected extent of X-ray emission is (Andreani et al., 1999) suggesting that hot gas pervades a significant area between and beyond the constituent clusters. Since the FWHM field-of-view of the ATCA antennas is at 18 GHz, we mosaic imaged the Bullet cluster using pointing centres at (J2000 epoch coordinates) RA: , DEC: and RA: , DEC: . These two pointing centres correspond to the X-ray brightness peaks and are separated by 0.54 of the FWHM of the ATCA antenna primary beams at 18 GHz.
Observations were made in each of two ATCA array configurations: H168 and H75 that have baselines up to 168 and 75 m respectively; the former to enable subtraction of unresolved continuum sources, the latter to provide enhanced surface brightness sensitivity for imaging of the SZE. A journal of the observations is in Table 1. In each of the observing sessions, antenna pointing corrections were updated every hour using a 5-point offset pattern observation on PKS B0537441, the unresolved calibrator PKS B074256 was observed every 10 min to monitor and correct for amplitude and phase drifts in the interferometer arms, and PKS B1934638 was observed once every session as a primary calibrator to set the absolute flux density scale. During the 10 mins between successive calibrations, the two pointing positions were alternately observed for 80 sec each. Visibilities were recorded with 10 sec averaging.
| Array configuration | Observing time (hours) | Date |
|---|---|---|
| H168 | 12 | 2009 April 25 |
| H168 | 12 | 2009 April 26 |
| H75 | 8 | 2009 June 28 |
| H75 | 8 | 2009 June 29 |
| H75 | 8 | 2009 June 30 |
The interferometer visibilities were examined, calibrated and imaged using MIRIAD; all image processing were also accomplished using utilities in this software package. The visibility data in the 17 and 19 GHz bands were separately edited for interference and calibrated before bandwidth synthesis imaging. Visibility data in each of the 2 GHz wide bands were recorded over 2048 frequency channels, and 50 channels at each of the band edges were excluded from analysis to avoid data in frequency domains where signal path gains are relatively low. Frequency channels that appeared to have relatively large fluctuations in visibility amplitude owing to hardware faults in the digital correlator were also rejected prior to calibration and imaging.
2.1. Calibration
Adopted fluxes for the primary calibrator PKS B1934638 were 1.146 and 0.992 Jy in the 17 and 19 GHz bands respectively; the spectral index (defined as , where is the flux density at frequency ) was adopted to be in both bands. Outliers in the amplitudes of visibility data on PKS B1934638 were rejected—removing 15% of data—and the reliable visibilities were used to set the absolute flux density scale as well as determine the instrument bandpass calibration. When calibrated for the bandpass, the visibility amplitudes of PKS B074256 showed continuity across the 4-GHz observing frequency range and a trend consistent with a single power-law: this was a check of the bandpass calibration. Drifts of up to were observed in the interferometer arms over the observing sessions: the calibrations for the time-varying complex gains in the antenna signal paths as well as the calibrations for polarization leakages were derived from the visibilities on PKS B074256. The rms phase variations in the antenna signal paths within the 1-min calibrator scans was within , indicating that short timescale atmospheric and instrumental phase cycling would not result in amplitude attenuation of more than 3%.
2.2. Imaging
Since no circular polarization is expected, Stokes V is expected to be consistent with thermal noise. Therefore, at times and frequency channels where Stokes V visibilities deviate more than four times rms thermal noise in the calibrated visibilities acquired towards the Bullet cluster pointings, data in all Stokes parameters were rejected. This Stokes V based clipping was aimed at automated rejection of self-generated low level interference.
The multi-channel continuum visibilities in both 17 and 19 GHz bands and in both pointings were imaged together to form a wide-field multi-frequency synthesis mosaic image of the Bullet cluster shown in Fig. 1 (upper panel). The image displayed has been truncated at where the attenuation in the mosaic image owing to the primary beam—and consequently the response to source flux density—falls below 10%. The mosaic image was made with a beam of FWHM at position angle (P.A.), and has an rms noise that is 7.4 Jy beam-1 at the centre and increases by factor five to the edges of the field of view. The rms noise in the image was estimated from Stokes V data and is consistent with expectations based on the system temperature during the observations, bandwidth and integration time. The image displayed has been tapered to make the rms noise uniform over the field of view.
Discrete sources detected by Liang et al. (2000) at 1.344 GHz are marked using symbols ‘A’ through ‘H’. All these eight sources are detected in the 18 GHz mosaic image at a level exceeding two standard deviation in image thermal noise. The brightest source in our 18-GHz image is at RA: , DEC: and is marked ‘A’ in the figure; this is a LIRG high-z galaxy (Rex et al., 2009) and is detected with a flux density of mJy at 18 GHz.
3. Imaging the SZE in the Bullet cluster
Radio images of the bullet cluster field include discrete radio sources, a radio halo (Liang et al., 2000), and SZE (Halverson et al., 2009) that is expected to appear as a decrement at the ATCA observing frequencies. For the characterization of the SZE decrement, it is essential to accurately subtract all discrete sources including the radio halo.
3.1. Subtraction of unresolved continuum sources
The image in Fig. 1 (upper panel) was made with visibility weighting close to natural in order to have low rms noise and good surface brightness sensitivity. To characterize first the unresolved continuum sources in the field, we constructed a separate image with uniform weighting of the visibilities that has a factor of two greater rms noise but, importantly, de-emphasizes extended halo emission and SZE. Sky regions that have image intensity exceeding four times the rms noise in Fig. 1 (upper panel) were examined for unresolved sources. Apart from the sources ‘A’ through ‘H’, three sources were detected with flux density exceeding four times the rms noise in the uniformly weighted image; these are marked ‘1’ through ‘3’ in Fig. 1 (upper panel). Of these, sources ‘1’ and ‘2’ are undetected in the 1.344 GHz image and are likely to have relatively flatter spectra. The flux densities of the 11 unresolved continuum sources in the field were estimated from the image made with uniform weighting and subtracted from the visibility data.
A mosaic image of the Bullet cluster made with close to natural weighting and using visibilities from which unresolved continuum sources were subtracted is in Fig. 1 (bottom panel). The beam FWHM and rms noise distribution and taper are same as for Fig. 1 (upper panel).
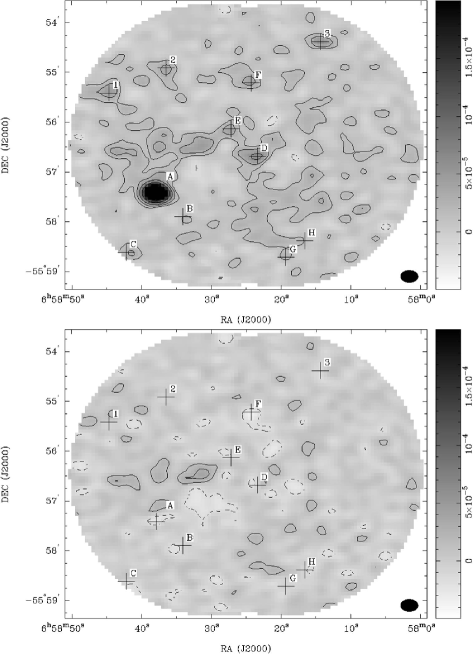
Bottom Panel: 18 GHz mosaic image of the bullet cluster with unresolved continuum sources subtracted. The beam FWHM and rms noise are same as for upper panel figure. Contour levels are at (4, 2, 2, 4, 8, 16, 32, 64) times the rms noise. Locations of discrete sources detected by Liang et al. (2000) and in our 18-GHz data are marked with cross symbols.
The positions of all the sources subtracted have been marked in Fig. 1 and in Table 2 we list the positions and 18-GHz flux densities. A negative feature appears close to the location where source ‘F’ was subtracted; this is an extended negative feature that is absent in the higher resolution images made with uniform visibility weighting. The brightest positive feature in this residual image is extended emission with a peak of 40 Jy beam-1 at RA: , DEC: ; this is 18-GHz emission from the radio halo, which was previously discovered by Liang et al. (2000).
| Source | RA (J2000) DEC | Flux Density | |||||
| h | m | s | ∘ | (mJy) | |||
| A | 06 | 58 | 38.0 | 55 | 57 | 25 | |
| B | 06 | 58 | 33.8 | 55 | 57 | 58 | |
| C | 06 | 58 | 41.4 | 55 | 58 | 41 | |
| D | 06 | 58 | 23.8 | 55 | 56 | 41 | |
| E | 06 | 58 | 27.5 | 55 | 56 | 06 | |
| F | 06 | 58 | 24.5 | 55 | 55 | 13 | |
| G | 06 | 58 | 19.3 | 55 | 58 | 41 | |
| H | 06 | 58 | 16.1 | 55 | 58 | 24 | |
| 1 | 06 | 58 | 44.6 | 55 | 55 | 24 | |
| 2 | 06 | 58 | 36.7 | 55 | 54 | 57 | |
| 3 | 06 | 58 | 14.6 | 55 | 54 | 23 | |
-
•
notes– Letters indicate discrete sources listed in Liang et al. (2000) and have the same letters as in their Table 2; numbers indicate additional discrete sources from our 18-GHz observations.
3.2. Subtraction of the radio halo
Previous observations of the radio halo in the Bullet cluster (Liang et al., 2000) provide spectral index and intensity distribution with sufficient angular resolution, and we model the radio halo contribution in our 18 GHz image based on their data. There was no evidence for spatial variations in spectral index, and the data was best fit with a single power-law spectral slope of between 0.8-8 GHz.
The 1.344 GHz image of the radio halo111The 1.344 GHz image with embedded unresolved sources subtracted was kindly provided to us by Dr. Liang. was corrected for the telescope primary beam attenuation at their observing frequency, an image of the radio halo component was isolated, scaled to 18 GHz adopting a spectral index of , and attenuated by the mosaic gain function at our observing frequency. In Fig. 2 we show the 18-GHz image of the Bullet cluster using grey scales, before any subtraction of the radio halo component, with this processed image that represents the expected halo component overlaid as contours.
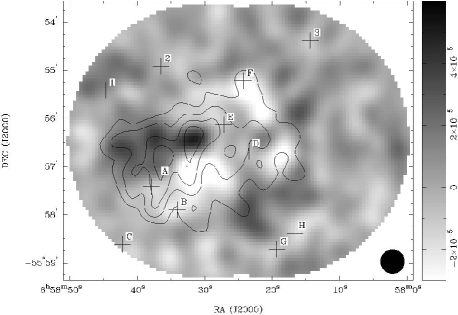
The 18-GHz image in Fig. 2, which has been smoothed to a beam of FWHM 30, clearly shows negative intensity values towards the central regions of the Bullet cluster. These SZE features appear to be confined within, and bounded by the lowest intensity contours of the halo component and are obvious in the 18-GHz image prior to any subtraction of the halo component, which would only enhance these SZE features. Before subtraction of any halo contribution, the 18-GHz image shows a peak in flux density at the peak of the halo and positive 18-GHz emission towards the eastern parts of the halo. Most noteworthy is the negative peak, representing a deep SZE ‘hole’, to the south of the peak in the expected halo contribution.
The image of the Bullet cluster shown in Fig. 1, which has unresolved continuum sources subtracted, was convolved to a final beam of FWHM at P.A., which is the beam of the 1.344 GHz image. The halo image was then subtracted from this image and a 18 GHz image of the Bullet cluster, with all continuum sources including the halo subtracted, is in Fig. 3 (upper panel).
4. A discussion of the SZE in the Bullet cluster
The sky distribution in the SZE does indeed coincide with the radio halo distribution in the western and southen parts; however, SZE is not detected towards the eastern end of the radio halo. Although the depth of the SZE detection may suffer errors owing to uncertainties in the extrapolation of the halo to 18 GHz, it is clear from our Fig. 3 (upper panel) that the detection and extent of the SZE is established. Assuming an uncertainty of 0.1 in the spectral index of the halo, we infer an uncertainty of % in the peak SZE dip and in its position. Over most of the SZE distribution as well, the estimated error in SZE decrement is %.
We may derive a temperature scale for the SZE image using the observing frequency and beam FWHM: the image rms noise of 8.4 Jy beam-1 corresponds to 35.3 K. The deepest SZE feature is at RA: , DEC: , and is clearly offset to the SE of the eastern X-ray emission peak; this deep SZE hole is a flux density decrement of 186Jy/beam and corresponds to a brightness temperature decrement of 0.78 mK. The expected SZE temperature decrement given a Compton– parameter of 3.310-4 (Halverson et al., 2009) is mK (Halverson et al. (2009) estimate 0.77 mK as the peak SZE decrement at 150 GHz from their APEX–SZE observations). Our observed SZE decrement of 0.78 mK at 18 GHz is significantly lower.
It may be noted here that our 18 GHz ATCA image of the SZE distribution is an interferometer image and would miss larger scale extended features. The smallest projected baselines in the ATCA observations correspond to the antenna diameter of 22 m, and the largest angular scale structures that may be reproduced in the ATCA image would be less than the antenna beam FWHM of . Because of missing large-scale SZE structure the absolute depth of SZE features might be reduced. Significantly differing depths in the SZE decrement in the APEX and ATCA images imply that there is substantial extended SZE structure in the Bullet cluster on angular scales of and larger, which is resolved out and missing in the ATCA inteferometer image.
In Fig. 3 (bottom panel) we show contours of the SZE overlaid on Chandra X-ray intensity distribution shown using grey scales.
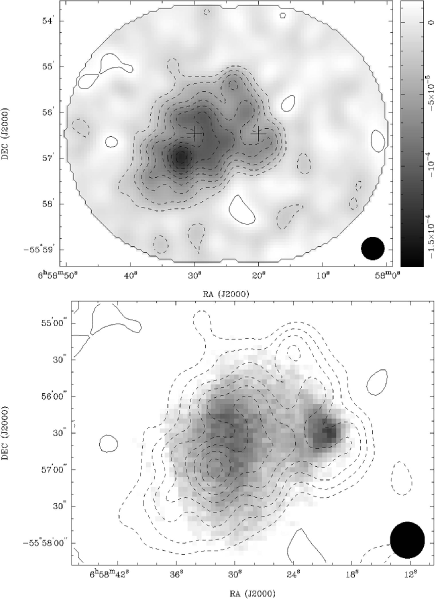
Bottom Panel: Contours represent the 18 GHz mosaic image of the SZE in the Bullet cluster; the image has been smoothed to a beam of FWHM . Contours are at (16, 12, 8, 6, 4, 3, 2, 2, 3) times the image rms noise of 8.4 Jy beam-1. Grey scales represent Chandra X-ray emission.
-
1.
We observe a deep SZE ‘hole’ that is significantly displaced to the SE of the X-ray peak in the hotter eastern cluster. Since the SZE probes the integrated pressure along the line of sight, this suggests that there are significant pressure variations in the intracluster gas, presumably because of the ongoing cluster collision. X–ray spectral luminosity is proportional to , whereas the SZE is proportional to : the two effects represent different weightings of temperature and electron density . X-ray emission images are more representative of distribution, whereas the SZE images are representative of distribution. The offset of the SZE ‘hole’ from the emission peak clearly suggests that the peak in intracluster gas temperature is spatially offset from the peak in gas density in the Bullet cluster222(Markevitch et al., 2002) have indeed reported finding highest temperatures SE of the X–ray peak.. Our observations are the first time such an effect has been observed; the high angular resolution ATCA observations of the Bullet cluster presented herein may be the first time that such a detailed comparison between the SZE substructure and X-ray emission has been possible in any cluster. The offset is a demonstration of the complexity in intracluster gas distribution properties in merging clusters. Apart from the deep SZE ‘hole’, we observe significant SZE substructure across the cluster complex. All these SZE components are displaced from the peaks in X-ray emission corresponding to the two clusters comprising the Bullet cluster complex.
-
2.
All substructure we detect in the SZE image lies within the boundary of the radio halo. Moreover, careful examination of Fig. 2 indicates that the SZE in the western parts of the cluster complex appear to follow the contours of the radio halo. This is surprising, since the radio halo arises from synchrotron plasma and the SZE from thermal intracluster gas and there is no spatial correspondence expected between these distinct components. A plausible reason for the cospatial locations of the SZE and radio halo—in the western parts of the cluster—is a common origin for the two populations of radiative electrons. Radio halos are believed to be synchrotron emission from electrons accelerated (or re-accelerated) to relativistic energies in the turbulence generated by cluster mergers. It may be that the radio halo was created in the turbulent wake of the passage of the ‘Bullet’ through the cluster gas, and the SZE also arises cospatially from relatively hotter electrons in the same turbulent wake. Absence of SZE towards the eastern parts of the radio halo would, in this picture, indicate longer lifetimes for the relativistic electrons compared to the SZE electrons. (Markevitch et al., 2002) have reported finding spatial correlation between halo brightness and local gas temperature in merging clusters; this is supplementary to the SZE and the halo being cospatial in our observations.
-
3.
The SZE decrement is relatively shallow towards the peaks in the X-ray emission. In Fig. 3 it may be noted that the SZE contours are indented in sky regions where the X-ray emission is most intense. The observed avoidance of the highest emission measure regions by SZE suggests that the highest density parts of the cluster gas may have somewhat cooler temperatures, owing to shorter cooling timescales, and consequently contribute relatively less to the SZE.
We note here that Massardi et al. (ApJL submitted) found a similar displacement of SZE dip from X–ray brightness peaks in the merging cluster CL01521357.
5. Summary
We have presented 18 GHz observations of the Bullet cluster from the ATCA, and report robust detections of substructure in the Sunyaev Zeldovich Effect. We subtract unresolved continuum sources in the cluster field using 18 GHz ATCA images made with enhanced weightings to the longer visibility spacings. We make reasonable assumptions about the radio halo in the cluster to extrapolate its observed properties from 0.8–8 GHz to 18 GHz and model and subtract the radio halo contribution. We image substantial substructure in SZE towards the Bullet cluster, finding a deep SZE hole that is significantly displaced from the peak in X-ray emission. The main conclusion from this work is that the intracluster gas in the merging Bullet cluster appears to have significant pressure distribution structure and peaks that differ from that in gas emission measure, galaxy and dark matter distributions. The work emphasizes the complexity in merger dynamics, and suggests that modeling the SZE contributions from cosmological clusters—for SZE cluster counts as well as SZE contributions to small-scale CMB anisotropy—is nontrivial.
References
- Andreani et al. (1999) Andreani, P., et al. 1999, ApJ, 513, 23
- Clowe et al. (2006) Clowe, D., Brada, M., Gonzalez, A. H., Markevitch, M., Randall, S. W., Jones, C., & Zaritsky, D. 2006, ApJ, 648, L109
- Halverson et al. (2009) Halverson, N. W., et al. 2009, ApJ, 701, 42
- Liang et al. (2000) Liang, H., Hunstead, R. W., Birkinshaw, M., & Andreani, P. 2000, ApJ, 544, 686
- Lueker et al. (2009) Lueker, M., et al. 2009, ArXiv e-prints
- Markevitch et al. (2002) Markevitch, M., Gonzalez, A. H., David, L., Vikhlinin, A., Murray, S., Forman, W., Jones, C., & Tucker, W. 2002, ApJ, 567, L27
- Rex et al. (2009) Rex, M., et al. 2009, ApJ, 703, 348