A Spitzer/IRS Study of Local Luminous Infrared Galaxies
Abstract
We present the first results of our program to study a sample of local luminous infrared galaxies (LIRGs, = 1011-10) with the Spitzer infrared spectrograph (IRS). In these proceedings we investigate the behavior of the 9.7 m silicate feature in LIRGs. As opposed to the extreme silicate absorptions observed in ultraluminous infrared galaxies (ULIRGs, = 1012-10), LIRGs exhibit intermediate silicate absorption features, comparable to those of starburst galaxies. We also find that most of the LIRGs have the minima of the [NeIII]/[NeII] ratio located at their nuclei. It is likely that increased densities in the nuclei are responsible for the smaller nuclear ratios. In the nuclei, it is also possible that the most massive stars are either absent, or still embedded in ultracompact HII regions. Finally we discuss the possible contribution of an AGN to the nuclear mid-IR emission of the galaxy, which in general is low in these local LIRGs.
1 Introduction and Data Reduction
Luminous infrared galaxies (LIRGs, = 1011-10) are an important cosmological class of galaxies as they are the main contributors to the co-moving star formation rate density of the universe at = 1. Moreover, the mid-IR spectra of high redshift (z 2) very luminous IR galaxies ( 10) appear to be better reproduced by those of local starbursts and LIRGs.
We obtained Spitzer/IRS mapping observations and analyzed archival IRS staring observations of the sample of local (d 75 Mpc) LIRGs of Alonso-Herrero et al. (2006). The maps cover the central 2020′′ or 3030′′ regions of the galaxies, and use all four IRS modules to cover the full 5-40 m spectral range. The IRS spectral mapping data reduction is described in detail by Pereira-Santaella et al. (2010). Briefly, we assembled the spectral data cubes from the staring observations with CUBISM. Then we used the low spectral resolution (R 60-120) data cubes to measure the PAH and the 9.7 m silicate features and we obtained maps of the brightest emission lines by fitting the high resolution (R 600) spectra. Using these emission line maps we calculated ratio maps.
2 The 9.7 m Silicate Feature
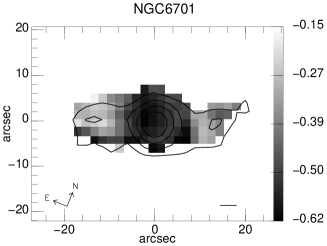
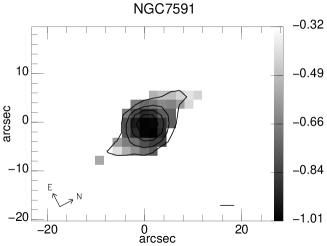
Amorphous silicate grains have a broad spectral feature at 9.7 m. Generally this feature is seen in absorption with different strengths. Although in some galaxies, most of them type 1 AGNs, it is seen in emission. We use the following definition to measure the depth of the feature (see Pereira-Santaella et al. 2010 for details). We find that the silicate strengths of our sample of LIRGs are relatively shallow compared with those of ULIRGs and comparable to those found in starburst galaxies. The spatial variations of the silicate strength within a galaxy and from galaxy to galaxy are small (see Figure 1), although most of the LIRGs have the maxima of the absorption in their nuclei. The tight range of the silicate strengths among our sample of LIRGs suggest that they may be in part a product of radiative transfer in dusty regions, rather than indicating similar amounts of extinction.
3 The [NeIII]/[NeII] Ratio
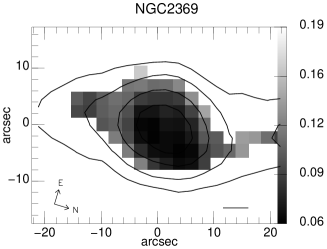
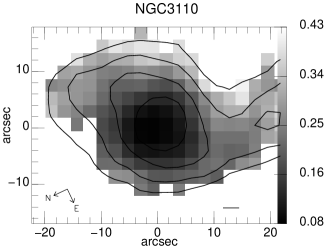
The [NeIII] at 15.6 m and the [NeII] at 12.8 m emission lines are tracers of recent ( 10 Myr) star formation. The [NeIII]/[NeII] ratio has a strong dependence on the age of the stellar population and metallicity and it falls below 10-3 for ages 6 Myr. Figure 2 shows the [NeIII]/[NeII] ratio maps for two of the LIRGs. Most of the galaxies have the minima of the [NeIII]/[NeII] ratio in their nuclei. The exceptions are those LIRGs classified as active that have more complex morphologies for this ratio. The variation of the nuclear [NeIII]/[NeII] ratio is small from galaxy to galaxy and its value is lower than that found in starbursts and below the range predicted by star-formation models. Two possible explanations for these nuclear ratios are: (1) the IMF is truncated at 30 in the LIRG nuclei; (2) the most massive stars are still buried in ultracompact HII regions.
4 The AGN Contribution
AGNs tend to have low PAH equivalent widths (EW), bright high ionization lines (ionization potential 54 eV) and a hot dust continuum. We used two methods that utilize these characteristics to estimate the AGN contribution in our sample of LIRGs
Figure 3 illustrates the method proposed by Nardini et al. (2008) to estimate the AGN contribution at 6 m of three sources of the Arp 299 interacting system. It uses the 5-8 m spectral region to separate out the starburst component in the form of PAH emission and the AGN component in the form of hot dust continuum.
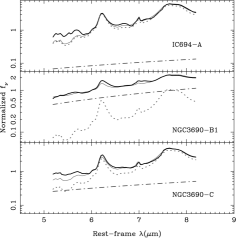
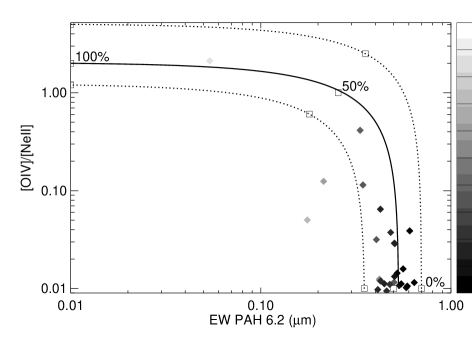
Figure 4 shows the [OIV] 25.9 m/[NeII] 12.8 m ratio (55 eV and 22 eV, respectively) versus the equivalent width of the 6.2 m PAH feature. The gray scale code corresponds to the estimation from the Nardini et al. method. We used the typical [OIV]/[NeII] ratios and PAH 6.2 m EWs of a pure AGN and starburst for the mixing curve (Brandl et al. 2006; Dale et al. 2006; Pereira-Santaella et al. 2010b). Both methods are in good agreement and show that for most of the LIRGs the AGN contribution is small ( 25%). Only few of these LIRGs (10% - 20%) are dominated by an AGN in the mid-IR.
Acknowledgments.
MP-S acknowledges support from the CSIC under grant JAE-Predoc-2007. Support for this work was provided by NASA through contract 1255094 issued by JPL/California Institute of Technology. MP-S, AA-H, and LC acknowledge support from the Spanish Plan Nacional del Espacio under grant ESP2007-65475-C02-01. AA-H also acknowledges support for this work from the Spanish Ministry of Science and Innovation through Proyecto Intramural Especial under grant number 200850I003.
References
- Alonso-Herrero et al. (2006) Alonso-Herrero, A., Rieke, G. H., Rieke, M. J., Colina, L., Pérez-González, P. G., & Ryder, S. D. 2006, ApJ, 650, 835
- Alonso-Herrero et al. (2009) Alonso-Herrero, et al. 2009, ApJ, 697, 660
- Brandl et al. (2006) Brandl, B. R., et al. 2006, ApJ, 653, 1129
- Dale et al. (2006) Dale, D. A., et al. 2006, ApJ, 646, 161
- Nardini et al. (2008) Nardini, E., et al. 2008, MNRAS, 385, L130
- Pereira-Santaella et al. (2010) Pereira-Santaella, M., et al. 2010, ApJS, accepted (arXiv:1004.1364)
- Pereira-Santaella et al. (2010b) Pereira-Santaella, M., Diamond-Stanic, A. M., Alonso-Herrero, A., & Rieke, G. H. 2010b, ApJ, submitted