The Dearth of Chemically Enriched Warm-Hot Circumgalactic Gas
Abstract
The circumgalactic medium (CGM) around galaxies is believed to record various forms of galaxy feedback and contain a significant portion of the “missing baryons” of individual dark matter halos. However, clear observational evidence for the existence of the hot CGM is still absent. We use intervening galaxies along 12 background AGNs as tracers to search for X-ray absorption lines produced in the corresponding CGM. Stacking Chandra grating observations with respect to galaxy groups and different luminosities of these intervening galaxies, we obtain spectra with signal-to-noise ratios of 46-72 per 20-mÅ spectral bin at the expected O VII K line. We find no detectable absorption lines of C VI, N VII, O VII, O VIII, or Ne IX. The high spectral quality allows us to tightly constrain upper limits to the corresponding ionic column densities (in particular 14.2–14.8). These nondetections are inconsistent with the Local Group hypothesis of the X-ray absorption lines at commonly observed in the spectra of AGNs. These results indicate that the putative CGM in the temperature range of K may not be able to account for the missing baryons unless the metallicity is less than 10% solar.
Subject headings:
Cosmology: observations — intergalactic medium — quasar: absorption lines — X-rays: general1. Introduction
Modern simulations are converging on the formation and evolution of the dark galactic halos as well as the large-scale intergalactic structure of the Universe (e.g., Navarro et al. 1996; Sheth et al. 2001; Cen & Ostriker 1999; Davé et al. 1999; Springel et al. 2005). However, serious difficulties are present in reproducing the visible parts of galaxies, including the mass/luminosity functions at low and high masses, the angular momentum distribution of galactic disks, and the supermassive black hole (SMBH) and bulge-mass relationship (e.g., Gilmore 2008; Primack 2009; Cattaneo et al. 2009). For instance, the ratio of the visible baryonic mass to the gravitational mass of all galaxies is 3-10 times less than the cosmic value () inferred from the Wilkinson Microwave Anisotropy Probe (Komatsu et al. 2009; also see Bregman et al. 2009 and references therein); the discrepancy seems to be more severe in less massive galaxies than in more massive ones (e.g., Hoekstra et al. 2005; McGaugh 2008). This missing link between the intergalactic medium (IGM), dark halos, and visible galaxies is attributed largely to our poor understanding of the complex “gastrophysics”, in particular the coupling between gas and galaxy feedback (e.g., Davé & Oppenheimer 2007).
Galaxy feedback comes in many forms. Starbursts are known to generate galactic winds, which must be chiefly responsible for the chemical enrichment and non-gravitational heating of the IGM at high redshifts (e.g., Mac Low & Ferrara 1999). Nuclear starbursts are also believed to be intimately related to the formation and growth of the SMBHs, which are an additional source of feedback, especially in massive galaxies (e.g., Strickland et al. 2002; Swartz et al. 2006). While the radiation pressure in a high-accretion phase can be a key driving force of the winds, the mechanical energy injection in a radiatively inefficient accretion phase may balance the cooling of the surrounding gas. Feedback from stars, even from evolved ones alone (e.g., Type Ia supernovae), can play an essential role in maintaining hot gaseous halos around galaxies (Tang et al., 2009a, b). Cosmic-ray pressure can also play an important role in driving large-scale galactic outflows (Everett et al., 2008). The relative importance of these various forms of the galaxy feedback, however, remains very unclear. Direct observational constraints on the physical process and history of the galaxy feedback are thus badly needed.
A potentially effective approach is to observe the circumgalactic medium (CGM) around nearby galaxies. On scales from a few tens of kpc up to Mpc, the CGM includes the gas that has been significantly affected by the galaxy feedback but is outside of the boundaries of the traditionally-known stellar and multi-phase interstellar components of such galaxies. It is quite possible that the CGM around the galaxies contains their “missing” baryons (e.g., Dehnen & Binney 1998; Sommer-Larsen 2006).
Searches for the CGM have been conducted in ultraviolet (UV), but the association between galaxies and IGM absorbers still remains an unsettled issue. Within impact distances of kpc from the sight lines of background QSOs, all galaxies with seem to have “associated” Ly or other low ionized absorbers (e.g., Chen & Tinker 2008; Wakker & Savage 2009). However, not all Ly absorbers have an associated galaxy found within 1 Mpc (e.g., Morris et al. 1993; Stocke et al. 2006). These absorbers could be either associated with faint galaxies that are beyond the detection limits of current galaxy surveys or not related to any galaxies at all (some absorbers are detected in voids; Chen & Mulchaey 2009; Stocke et al. 2007.) Also, it is possible that much of the injection into the IGM occurred at high redshifts, and in the time that has subsequently passed, substantial separations in space and velocity have developed between the ejected matter and the galaxies from which it originated (Tripp et al., 2006). The highly ionized absorbers, O VI absorbers in particular, may trace the CGM at high temperatures. Covering fraction of these absorbers varies with respect to galaxy luminosities and the impact distances of these absorbers to their nearest galaxies (Stocke et al., 2006; Prochaska et al., 2006; Ganguly et al., 2008; Wakker & Savage, 2009).
X-ray observations could provide complementary or even key constraints on the existence and properties of the CGM. The bulk of the CGM, at least for galaxies with masses similar to and higher than our Galaxy, is believed to be in a gaseous phase at temperatures of K and mainly emits and absorbs X-ray photons (e.g., Birnboim & Dekel 2003). However, because of the low density and potentially low metallicity of the CGM, its X-ray emission, except for that in galaxy clusters where the missing baryon problem becomes less severe, is expected to be hard to detect (e.g., Hansen & Sommer-Larsen 2006), and the observational evidence is still absent (e.g., Rasmussen et al. 2009; Anderson & Bregman 2010).
The high spectral resolution grating instruments aboard Chandra and XMM-Newton now provide us with a new powerful tool — X-ray absorption line spectroscopy — to probe the low-surface brightness diffuse hot CGM. Unlike X-ray emission that is sensitive to the emission measure of the hot gas, absorption lines produced by helium- and hydrogen-like ions such as O VII, O VIII, and Ne IX directly probe their column densities, which are proportional to the mass of the gas and are sensitive to its thermal, chemical, and kinematic properties. Indeed, both the Chandra and XMM-Newton grating observations of bright AGNs and X-ray binaries have been used to firmly detect and characterize the global hot gas in and around the Milky Way (e.g., Wang et al. 2005; Yao & Wang 2005, 2006, 2007; Fang et al. 2006; Bregman & Lloyd-Davies 2007). However, our location in the midst of the hot gas makes it hard to determine the presence of the CGM around the Galaxy; our previous investigations only yield tentative upper limits to the column densities of the CGM beyond the hot gas-rich Galactic disk (e.g., Yao et al. 2008, 2009a).
In this work, we search for absorption lines of C VI, N VII, O VII, O VIII, and Ne IX produced in the CGM of intervening galaxies along 12 AGN sight lines by extensively exploring Chandra grating observations. Because detection sensitivities of current high resolution X-ray instruments are still limited, to enhance the signal-to-noise (S/N) ratio, we stack spectra with respect to group membership and luminosity properties of intervening galaxies. This stacking technique, as implemented in our previous paper (Yao et al., 2009b), enables us to probe the absorbing gas to unprecedented low column densities.
The paper is organized as follows. In Section 2, we discuss the background AGNs and survey of intervening galaxies, and we describe the data reduction process. We search for and measure the X-ray absorption lines produced in the CGM in Section 3, and discuss the implications of our results in Section 4.
Throughout the paper, we adopt the Schechter luminosity function with characteristic luminosity (or absolute B magnitude ) and use the cosmology with , , and .
2. Background AGNs, Intervening galaxies, Chandra Observations, and Data Reduction
We selected our background AGNs and their Chandra observations using the following criteria. For all AGNs observed with Chandra grating instruments, we chose those sources without intrinsic () soft X-ray emission/absorption lines reported in the literature. We also included those AGNs with intrinsic lines (e.g., Yaqoob et al. 2003; Mason et al. 2003; Różańska et al. 2004; also see McKernan et al. 2007 and references therein), but showing no lines with ( is the equivalent width of a line) at wavelengths longer than 10 Å in their Chandra spectra. We excluded observations with nonstandard configurations [e.g., observations that put target source outside of the S3 chip of the advanced CCD Imaging Spectrometer (ACIS) for calibration purposes] to avoid spectral resolution degradation. We did not use several short ( ks) exposures of PKS 2155-304 that together contribute to the total spectral counts. Among the candidate AGNs, we only used those sight lines along which there are 1 intervening galaxies at projected impact distances of 500 kpc. We used 500 kpc as a test limit, which is comparable to the size of regular galaxy groups (e.g., Tully 1987; Helsdon & Ponman 2000). The O VI and C III ultraviolet absorbers are found to have a median impact distance of 350-500 kpc and a maximum distance of 800 kpc around galaxies (Stocke et al., 2006).
The information on the intervening galaxies was extracted from the same galaxy database as used by Stocke et al. (2006). This database was assembled from several galaxy redshift surveys and has been updated with SDSS DR7. Only those galaxies with reported B-band magnitudes were used, and the K-correction of Fukugita et al. (1995) had been applied to obtain the absolute magnitude of these galaxies. Table 1 summarizes our selected AGNs, the number of Chandra grating observations and total exposure time used in this work, and the number of intervening galaxies along each sight line. Table 2 lists the intervening galaxies used in this work. Figure 1 shows the intervening galaxy distributions along the 3C 273 and PG 1116+215 sight lines for demonstration.

| Src. Name | No. of Obs. | Exp. | No. of gal. | |
|---|---|---|---|---|
| (ks) | ||||
| H1821+643 | 0.297 | 5 | 600 | 7(5) |
| 3C 273 | 0.158 | 17 | 530 | 47(44) |
| PG 1116+215 | 0.176 | 1 | 89 | 12(11) |
| PKS 2155-304 | 0.117 | 46 | 1075 | 14(13) |
| Ton S180 | 0.062 | 1 | 80 | 3(3) |
| PG 1211+143 | 0.081 | 3 | 141 | 46(45) |
| Mrk 766 | 0.013 | 1 | 90 | 13(12) |
| H1426+428 | 0.129 | 3 | 184 | 3(3) |
| 1H 0414+009 | 0.287 | 2 | 88 | 4(2) |
| Mrk 509 | 0.034 | 1 | 59 | 1(1) |
| IC 4329a | 0.016 | 1 | 60 | 3(3) |
| Fairall 9 | 0.047 | 1 | 80 | 1(1) |
| Sub total: | 82 | 3076 | 154(143) | |
Note. — Values in parentheses indicate numbers of intervening galaxies with reported B-magnitudes. Only these galaxies were used in this work.
| RA (J2000) | Dec (J2000) | |||||
|---|---|---|---|---|---|---|
| (deg) | (deg) | (arcsec) | (kpc) | (mag) | ||
| 275.365 | 64.203 | 0.027519 | 9.02 | 300.9 | 20.60 | 0.006 |
| 275.010 | 64.315 | 0.027879 | 12.55 | 424.1 | 18.50 | 0.041 |
| 275.512 | 64.361 | 0.121537 | 1.19 | 176.0 | 18.30 | 1.502 |
| 275.403 | 64.357 | 0.170858 | 2.38 | 492.3 | 19.10 | 1.857 |
| 275.477 | 64.335 | 0.225603 | 0.60 | 164.8 | 19.50 | 2.920 |
| 275.520 | 64.348 | 0.284400 | 0.85 | 291.8 | 22.20 | 0.593 |
Note. — is calculated in B band. Information of intervening galaxies along other sight lines are available online.
There are two detectors [the ACIS and the high resolution camera (HRC)] and two grating spectrographs [the high energy transmission grating (HETG) and the low energy transmission grating (LETG)] aboard Chandra 111Please refer to Chandra Proposer’s Observatory Guide (http://asc.harvard.edu/proposer/POG/) for further information.. Observations with the LETG collected the majority of the data used in this work.
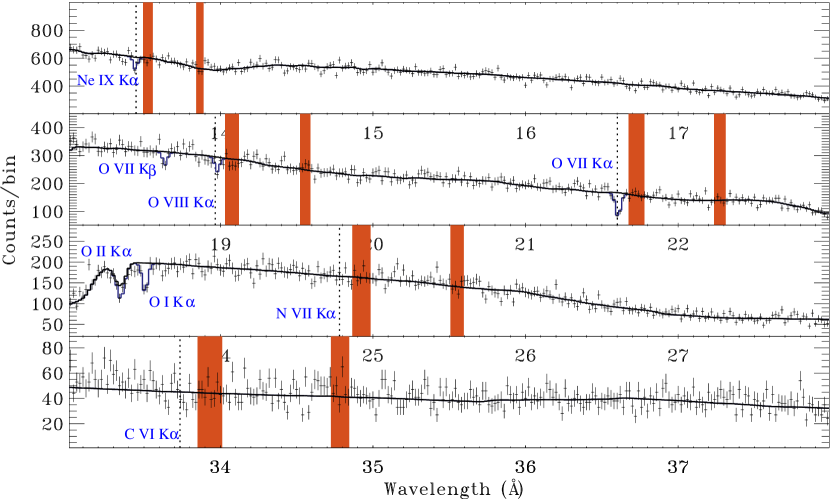
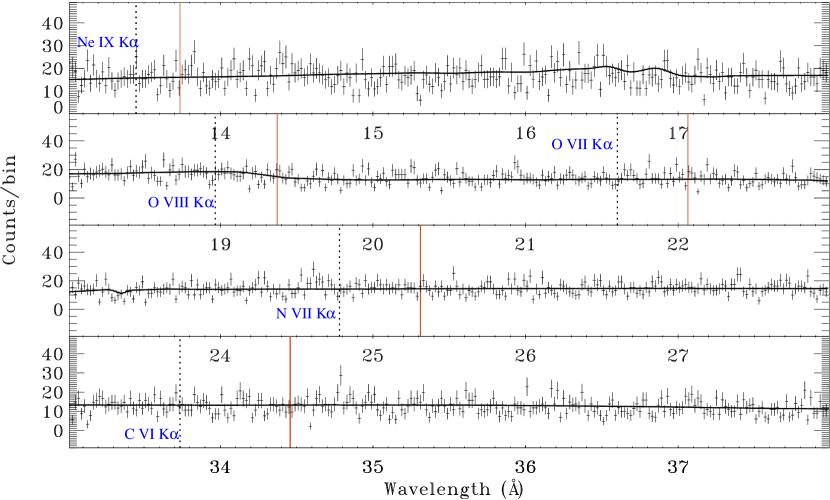
We followed the same procedures as described in Wang et al. (2005) and Yao & Wang (2005, 2007) to perform the Chandra data reduction. Most observations of the first six sources listed in Table 1 have been reported in Yao et al. (2009b), and the same spectra and the corresponding instrumental response files as obtained by Yao et al. (2009b) were used here. We extracted spectra and calculated the instrumental response files for those observations that have not been analyzed. For each sight line with multiple observations, we also combined spectra and corresponding response files to form a single coadded spectrum and response file. Figures 2 and 3 demonstrate the final spectra of 3C 273 and PG 1116+215, and Table 3 summarizes S/N ratios of each AGN spectrum in 20-mÅ bins around the restframe wavelengths of the K transitions of Ne IX, O VIII, O VII, N VII, and C VI.
| Src. Name | Ne IX | O VIII | O VII | N VII | C VI |
|---|---|---|---|---|---|
| H1821+643 | 13.1 | 9.6 | 7.6 | 8.1 | 3.7 |
| 3C 273 | 24.2 | 16.8 | 12.3 | 12.9 | 6.6 |
| PG 1116+215 | 4.1 | 4.1 | 3.8 | 3.7 | 3.5 |
| PKS 2155-304 | 45.3 | 37.9 | 30.4 | 31.0 | 21.6 |
| Ton S180 | 6.2 | 5.4 | 3.4 | 3.7 | 1.6 |
| PG 1211+143 | 5.3 | 4.4 | 3.3 | 3.5 | 1.5 |
| Mrk 766 | 5.3 | 3.3 | 2.4 | 2.7 | 1 |
| H1426+428 | 10.8 | 6.3 | 4.4 | 4.1 | 1 |
| 1H 0414+009 | 3.4 | 2.0 | 1 | 1.1 | 1 |
| Mrk 509 | 5.4 | 3.1 | 2.1 | 2.0 | 1 |
| IC 4329a | 5.5 | 1.9 | 1 | 1.3 | 1 |
| Fairall 9 | 4.7 | 2.5 | 1.4 | 1.8 | 1 |
Note. — The restframe wavelengths of the K transitions of Ne IX, O VIII, O VII, N VII, and C VI are 13.448 Å, 18.967 Å, 21.602 Å, 24.781 Å, and 33.736 Å, respectively (Verner et al., 1996).
3. Data analysis and results
We first search for the K absorption lines of Ne IX, O VIII, O VII, N VII, and C VI produced in the CGM along individual sight lines. Most of the spectra of our selected AGNs are of low counting statistics, and only three of them, H1821+643, 3C 273, and PKS 2155-304, have sufficiently high S/N ratios to warrant such a search (Figures 2-3 and Table 3). Visual inspection reveals no convincing X-ray absorption line at the redshift of each intervening galaxy along any of these sight lines.
We then search for the X-ray absorption lines produced in the CGM of the intervening galaxies from stacked spectra. We classify the galaxies into five categories, corresponding to galaxies in groups, galaxies with luminosites of , , , and all galaxies. We define a galaxy group along a sight line as consisting of three or more galaxies with line-of-sight velocity differences , where is the speed of light and is the redshift interval of any two galaxies in the group. Figure 4 illustrates the number of galaxies in each category as a function of impact distances. We coadd the spectra with respect to redshifts of the intervening galaxies () in the same category. Redshifts of the CGM absorption lines are expected to be the same as those of the intervening galaxies 222The redshift of the putative CGM of a galaxy could be offset from the by several hundred km s-1 (e.g., Stocke et al. 2006), which, however, is unresolvable by current X-ray instruments. Please see Section 4.1 for further discussion.. To properly conduct the coadding, along each sight line, we first blueshift the AGN spectrum and accordingly squeeze the instrumental response file by , the redshift of each intervening galaxy 333Please refer to Yao et al. (2009b) for procedures of blueshifting a spectrum and the corresponding response file., and then stack them to form a single spectrum and response file for each of the five categories. To assure independence each shifted spectrum in coadding, for those galaxies along the same sight line and in the same category but at very close redshifts that cannot be resolved by Chandra spectral resolution (e.g., ; we take the resolution of 1000 as a conservative value), we use an average redshift defined as
| (1) |
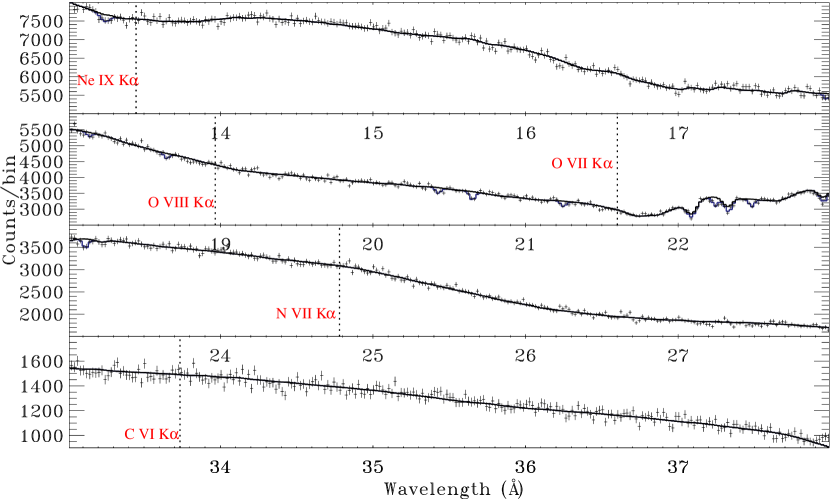
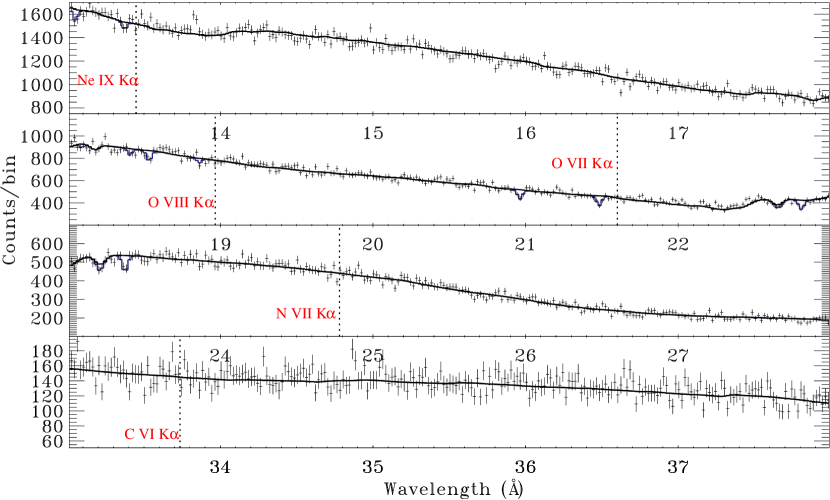
where and are the redshift and the impact distance of a galaxy, respectively. For instance, along the 3C 273 sight line, galaxies at only two redshifts (Figure 1a) are used to form the coadded spectrum of the “galaxies in groups” category. Among the 143 intervening galaxies listed in Table 1, only 29 are “independent” in the “all intervening galaxies” category (Table 4). Since the PKS 2155-304 sight line dominates the spectral counts of these coadded spectra (Table 3), to avoid possible bias caused by a single sight line, we also obtain another five similar coadded spectra but without contribution of the PKS 2155-304 sight line. Figures 5-6 show two examples of these coadded spectra. Table 4 summarizes the S/N ratios of these coadded spectra around the expected X-ray absorption lines and the number of the galaxies and the sight lines that these spectra are sampling.

| No. | Galaxies | Sight lines | Ne IX | O VIII | O VII | N VII | C VI |
|---|---|---|---|---|---|---|---|
| 1a | 10(7) | 6(5) | 86.7(36.9) | 66.2(25.6) | 54.5(19.2) | 55.6(19.4) | 38.6(10.7) |
| 2b | 6(4) | 4(3) | 68.5(19.5) | 49.9(12.5) | 46.0(13.2) | 39.5( 8.5) | 29.6( 4.8) |
| 3c | 15(12) | 8(7) | 88.0(38.9) | 67.2(27.9) | 54.8(21.0) | 55.7(21.0) | 38.9(12.1) |
| 4d | 16(14) | 11(10) | 76.5(41.2) | 58.1(29.0) | 46.4(21.4) | 47.9(22.0) | 32.5(12.0) |
| 5e | 29(24) | 12(11) | 113.(48.4) | 85.1(34.1) | 72.4(26.9) | 69.2(25.3) | 49.2(14.3) |
Note. — Values in parenthesis indicate without contribution from the PKS 2155-304 sight line.
a Sampling 10(7) intervening galaxies in groups along 6(5) sight lines.
b Sampling intervening galaxies with .
c Sampling intervening galaxies with .
d Sampling intervening galaxies with .
e Sampling all intervening galaxies.
We measure the absorptions of the CGM from these coadded spectra. Since all background AGN spectra have been shifted by the redshifts of the intervening galaxies before being coadded, the absorption lines produced in the CGM are thus expected to be at the restframe wavelengths of these lines in the coadded spectra. Again, visual inspection reveals no convincing absorption line in any of these coadded spectra, with or without contribution from the PKS 2155-304 sight line (e.g., Figures 5-6). Adding the Gaussian profiles at the restframe wavelengths of K transitions of Ne IX, O VIII, O VII, N VII, and C VI, we constrain the 95% upper limits to the equivalent widths (EWs) of these absorption lines. Replacing the Gaussian profiles with our absorption line model absline 444This model is similar to an analysis of the curve of growth. Please refer to Yao & Wang (2005) for a detailed description. and fixing the dispersion velocity to for the absorbing medium, we also obtain the upper limits to the corresponding ionic column densities in the CGM, which are reported in Table 5.
| No. | Ne IX | O VIII | O VII | N VII | C VI | |||||
|---|---|---|---|---|---|---|---|---|---|---|
| EW | log[N(cm-2)] | EW | log[N(cm-2)] | EW | log[N(cm-2)] | EW | log[N(cm-2)] | EW | log[N(cm-2)] | |
| (mÅ) | (mÅ) | (mÅ) | (mÅ) | (mÅ) | ||||||
| 1a | 0.99(2.71) | 14.99(15.57) | 0.77(2.55) | 14.53(15.01) | 0.41(2.60) | 14.25(14.96) | 0.99(4.78) | 14.34(15.04) | 0.73(6.57) | 14.06(14.96) |
| 2b | 0.55(2.11) | 14.76(15.36) | 2.56(8.76) | 14.05(16.29) | 1.62(3.28) | 14.76(15.25) | 1.18(9.96) | 14.41(15.53) | 1.56(18.8) | 14.29(15.67) |
| 3c | 0.87(2.19) | 14.96(15.35) | 0.70(3.42) | 14.41(15.18) | 0.39(2.50) | 14.20(14.86) | 1.18(4.11) | 14.52(14.96) | 0.67(7.03) | 13.93(15.02) |
| 4d | 0.92(2.06) | 14.92(15.35) | 1.05(1.81) | 14.56(15.35) | 0.69(1.25) | 14.51(14.86) | 0.97(2.32) | 14.37(14.66) | 0.83(3.03) | 14.01(14.62) |
| 5e | 0.64(2.17) | 14.71(15.40) | 0.96(2.26) | 14.61(14.98) | 0.41(1.08) | 14.16(14.51) | 0.74(3.19) | 14.20(14.96) | 0.49(5.27) | 13.80(14.87) |
Note. — a-e Measurements are obtained from the spectra, sorted to the same order as listed in Table 4.
4. Discussion
We have presented a search for X-ray absorption lines of the CGM along 12 sight lines. The limited counting statistics of the X-ray spectra of the background AGNs usually doesn’t warrant such a search. To improve the S/N ratios, we have stacked the AGN spectra with respect to different group and luminosity properties of the intervening galaxies. We do not detect any X-ray absorption line in the coadded spectra although the high S/N ratios enable us to constrain the ionic column density to be as low as (Table 5). In the following, we first examine the reliability of our results (Section 4.1) and then discuss implications of these results for the galaxy feedback (Section 4.2) and for the origin of the absorption lines at routinely detected in spectra of many AGNs (Section 4.3).
4.1. Validity of our data analysis procedures
Here we address two crucial questions regarding to the analysis procedures employed in this work: (1) Can our stacking restore the line significance if there were X-ray absorptions produced in the CGM at various redshifts? (2) Could the absorption signal be severely blurred if the CGM absorptions are of several hundred km s-1 velocity offset from those of galaxies? To answer these questions, we run Monte-Carlo simulations to obtain detection rates of the LETG for three different scenarios.
First, we simulate the probabilities of detecting an absorption line from a single spectrum. Since the LETG collects most of the photons for the spectra used in this work (Section 2) and the S/N ratios of the stacked spectra are 40-50 around the O VII K absorption line (Table 4), we use the response file of the LETG to simulate spectra with spectral counts of 2000 per 20-mÅ bin around 21.6 Å. We then measure the significance () of a simulated line for different input column densities () and a fixed Doppler dispersion velocity of . We repeat these simulations 10,000 times and obtain the 68% and 90% detection rates, which describe the probabilities of detecting the O VII line at certain significance levels or higher for various (Figure 7). For instance, the simulations indicate that for an assumed , the 68% and 90% of the detections are at 3.1 and 2.4 .
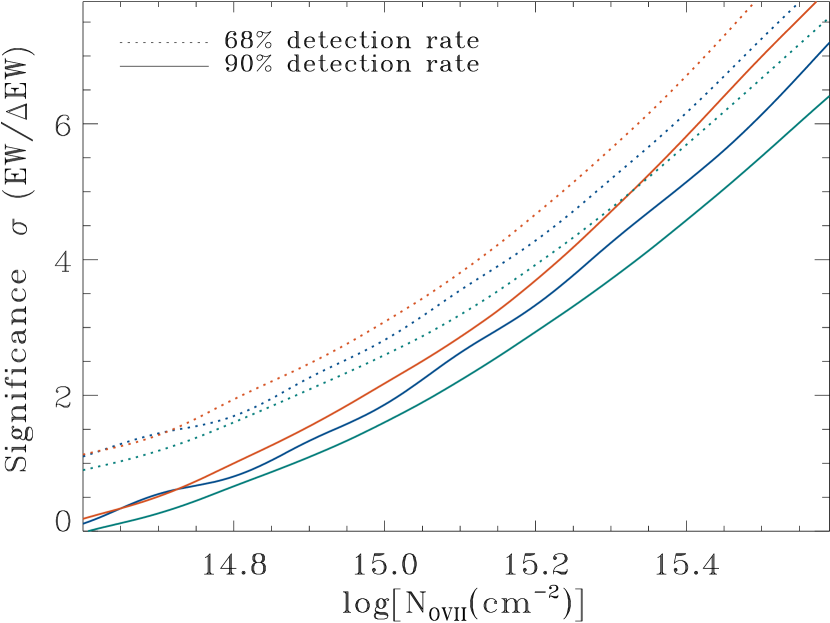
Second, we check the validity of our shifting and coadding procedures. In this scenario, we first simulate a set of ten spectra, each with spectral counts of 200 per bin around the O VII K line. In these ten spectra, the lines, all characterized with the same and , are placed at ten redshifts distributed evenly between 0.01 and 0.1, to mimic various redshifts of the intervening galaxies. We then use the same procedures as used in the actual data analysis to blueshift these spectra by the corresponding redshifts, coadd them to form a single spectrum, and then measure the line significance. As in the first scenario, we repeat the whole process 10,000 times to obtain the 68% and 90% detection rates for different inputs, which are also presented in Figure 7. It is interesting to note that, for a given and with the same detection possibility, a line in the shift-coadded spectrum is expected to be detected at a higher significance level than in a single spectrum with a similar S/N ratio. This slightly enhanced significance is caused by the higher spectral resolution () of the LETG at longer wavelengths and channel rebinning when spectra are blueshifted. This comparison validates our stacking procedures used in this work.
Finally, we examine the effect of the possible velocity offsets between the CGM absorptions and the intervening galaxies. We run similar simulations as in the second scenario, except that in each set of ten spectra, the absorption lines have random velocity offsets from the redshifts of the intervening galaxies. The offset velocities follow a normal distribution with a standard deviation of from each redshift (Stocke et al., 2006). Simulations indicate that in the high column density end (e.g., ), the detection significance, though could be discounted, is still high. In the low column density end (e.g., ), to which our stacked spectra is approaching, the detection significance is not of much differences (Figure 7). In short, velocity offsets of several hundred km s-1 between intervening galaxies and the surrounding CGM would not significantly blur the putative absorption signals in our stacked spectra.
4.2. Implications for the missing baryon state
As discussed in Section 1, galaxy feedback could be in various forms for galaxies on different mass/luminosity scales and at different evolutionary stages. The CGM is expected to contain important information about the galaxy feedback and could also be a significant baryonic reservoir of individual dark matter halos. Taking and assuming that the CGM is uniformly distributed around galaxies, we can estimate the total mass contained in the CGM as , where , , and are the ionization fraction of O VII, metallicity, and the radial distance of the CGM, respectively. In contrast, the hot CGM is expected to contain baryons for Milky Way type galaxies and a typical galaxy group (McGaugh, 2008). These results thus indicate that the bulk of the CGM is unlikely to reside in a chemically enriched warm-hot phase (at temperatures ranging from K) where our X-ray absorption line spectroscopy is sensitive.
Our results, together with existing measurements of various species in other wavelength bands, can be used to constrain the state and/or extent of the CGM, hence its effect on galaxy evolution. One possibility is that the bulk of the baryon matter that was initially associated with the dark matter has been expelled out to large regions possibly on scales greater than individual group halos. Such stratification of baryon matter relative to dark matter halos may be a natural result of galactic feedback, initially via superwinds from starbursts and possibly AGNs (e.g., Mo & Mao et al. 2004) and later maintained by relatively gentle, but long-lasting energy injection from continuing star formation and by evolved stars (e.g., Type Ia SNe; Tang et al. 2009a). The exact physical/chemical state and extent of the stratified region is still uncertain, depending on the efficiency of the energy outputs from the starbursts and the star formation history as well as the environment of the galaxies.
While in this work the intervening galaxies are located at projected impact distances of 100-500 kpc along the selected sight lines (e.g., Figure 1), the “associated” Ly and O VI absorbers have also been detected at similar distances around galaxies (e.g., Stocke et al. 2006; Wakker & Savage 2009). The gas traced by O VI absorbers (- K, if collisionally ionized) can account for up to 10% of the baryon mass associated with individual dark matter halos in the present Universe (Tripp & Savage, 2000; Danforth & Shull, 2008; Wakker & Savage, 2009). But recent work indicates that a large fraction of the O VI absorbers could be due to photoionization of cool gas clouds (e.g., Tripp et al. 2008). Therefore, for a remaining component to account for the missing baryons, its temperatures must be too high (e.g., K) and/or its metal abudance is too low () to avoid the detection in X-ray absorption lines.
While the metal abundance of the CGM is hardly constrained, the commonly accepted value is about 0.2 , as indicated by a few measurements of cool high-velocity clouds ( K) around the Galaxy (e.g., Lu et al. 1994; Tripp et al. 2003; Shull et al. 2009) and by the modeling of quasar absorption lines (e.g., Keeney et al. 2005). However, some studies have found circumgalactic material with substantially higher metallicities (e.g., Jenkins et al. 2005; Aracil et al. 2006). One may expect that the hot component would also have higher metal abundances, as indicated by measurements for the medium in numerous galaxy clusters and a few well-observed groups (e.g., De Grandi & Molendi 2001; Pratt et al. 2007).
A high temperature and low density CGM component is predicted in numerical simulations, particularly for the evolution of Milky Way type galaxies and group environments (Tang et al., 2009a; Kim et al., 2009). The high temperature is also consistent with observations of the large-scale hot intragroup medium, which seems to be concentrated around galaxies and is always at temperatures higher than K (Sun et al., 2009). A significant portion of the CGM may be in the hot phase hiding from our detection; the gas is too hot to produce detectable neon, oxygen, nitrogen, or carbon absorption lines. The observed O VI absorptions can arise from either photo-ionization of embedded cool clouds or collisional ionization at their interfaces with the hot components (e.g., Wakker & Savage 2009). How well the hot CGM is mixed with the cool clouds and the relative fractions of the CGM in the two phases likely depend on both the masses of individual galaxies and the richness of the environment.
Although our present investigation cannot constrain the CGM on scales of 100 kpc around galaxies, our recent studies of the Galactic halo/CGM suggest that the observed O VII absorption arises primarily in regions around the Galactic disk/bulge on scales of kpc (Yao et al., 2008, 2009a). Additional constraints have been discussed in a more recent work by Anderson & Bregman (2010), who conclude that the hot gas cannot explain the missing baryon matter on galactic halo scales. This conclusion complements the constraints obtained in this paper primarily on larger scales.
Properties of the CGM could vary from one galaxy to another. This variation may have been revealed by the different column densities and the non-unit covering factor of the O VI absorbers (e.g., Stocke et al. 2006; Wakker & Savage 2009). In this work, we group galaxies with respect to different luminosities. The upper limits to the column densities of the X-ray absorbers and to the total mass of the CGM thus should be regarded as average values for these galaxies.
In short, we find little evidence for the warm-hot gas in the temperature range of a few times - K to account for a significant fraction of the missing baryons in the vicinity of galaxies. The bulk of the CGM likely exists in cool clouds (e.g., Wakker & Savage 2009) or in a hot gas ( K).
4.3. Implication for absorption lines at
The results presented here also have strong implication for the origin of absorption lines at as demonstrated in Figure 2. Highly ionized absorption lines at , in particular the O VII K at 21.602 Å, have been observed in all AGN spectra as long as the spectra have sufficiently high S/N ratios (e.g., Fang et al. 2006; Bregman & Lloyd-Davies 2007). The plausible locations of these absorbers include the hot interstellar medium (ISM) around the Galactic disk (e.g., Yao & Wang 2005, 2007; Yao et al. 2008, 2009a), the large-scale Galactic halo (e.g., Rasmussen et al. 2003; Fang et al. 2006; Bregman & Lloyd-Davies 2007), and intra-group gas in the Local Group (e.g., Nicastro et al. 2002; Williams et al. 2005). There are no clear boundaries between the Galactic disk and the Galactic halo and between the Galactic halo and the intra-group gas, but the scale sizes of them are expected to be several kpc, 10-100 kpc, and 100-1000 kpc, respectively. This work probes the CGM located between the Galactic halo and intra-group gas. Since the selected intervening galaxies have impact distances of 100-500 kpc, our sight lines do not sample much of galactic disks and halos. If the absorption lines at are mainly produced in the intra-group gas, similar lines are also expected for intervening galaxy groups (e.g., Figures 1a). However, we only obtain tightly constrained upper limits to the ionic column densities, in particular (the first row of Table 5), which, compared to the absorption (e.g., Williams et al. 2005, 2007), indicate that the contribution of the intra-group gas, if it exists at all, must be . This conclusion is consistent with the constraint obtained by comparing the X-ray absorption with emission measurements (Fang et al., 2006; Yao & Wang, 2007) and with the non-detection of the expected spatial preferences of the gas along the Local Group geometry (Bregman & Lloyd-Davies, 2007), as well as with the differential absorption line spectroscopy based on different depths of sight lines (Yao et al., 2008, 2009a).
References
- Anderson & Bregman (2010) Anderson, M. E., & Bregman, J. N. 2010, ApJ, in press
- Aracil et al. (2006) Aracil, B., et al. 2006, MNRAS, 367, 139
- Birnboim & Dekel (2003) Birnboim, Y., & Dekel, A. 2003, MNRAS, 345, 349
- Bregman & Lloyd-Davies (2007) Bregman, J., & Lloyd-Davies, E. 2007, ApJ, 669, 990
- Bregman et al. (2009) Bregman, J., et al. 2009, arXiv:0906.4993
- Cattaneo et al. (2009) Cattaneo, A, et al. 2009, Nature, 460, 213
- Cen & Ostriker (1999) Cen, R., & Ostriker, J. 1999, ApJ,514, 1
- Chen & Tinker (2008) Chen, H.-W., Tinker, J. L. 2008, ApJ, 687, 745
- Chen & Mulchaey (2009) Chen, H.-W., Mulchaey, J. S. 2009, ApJ, 701, 1219
- Davé et al. (1999) Davé R., et al. 1999, ApJ, 511, 521
- Davé & Oppenheimer (2007) Davé R., & Oppenheimer, B. D. 2007, MNRAS, 374, 427
- Danforth & Shull (2008) Danforth, C. W., & Shull, J. M. 2008, ApJ, 679, 194
- De Grandi & Molendi (2001) De Grandi, S., & Molendi, S. 2001, ApJ, 551, 153
- Dehnen & Binney (1998) Dehnen, W., & Binney, J., 1998, MNRAS, 294, 429
- Everett et al. (2008) Everett, J. E., et al. 2008, ApJ, 674, 258
- Fang et al. (2006) Fang, T., et al. 2006, ApJ, 644, 174
- Fukugita et al. (1995) Fukugita, M., et al. 1995, PASP, 107, 945
- Gilmore (2008) Gilmore, G. 2008, Science 322, 1476
- Ganguly et al. (2008) Ganguly, R., Cen, R., Fang, T., & Sembach, K. 2008, ApJ, 678, L89
- Hansen & Sommer-Larsen (2006) Hansen, S., & Sommer-Larsen, J. 2006, ApJ, 653, L17
- Helsdon & Ponman (2000) Helsdon, S. F., & Ponman, T. J. 20000, MNRAS, 315, 356
- Hoekstra et al. (2005) Hoekstra, H, et al. 2005, ApJ, 635, 73
- Jenkins et al. (2005) Jenkins, E. B., Bowen, D. V., Tripp, T. M., & Sembach, K. R. 2005, ApJ, 623, 767
- Keeney et al. (2005) Keeney, B. A., et al. 2005, ApJ, 622, 267
- Kim et al. (2009) Kim, J., Wise, J, H., & Abel, T. 2009, ApJ, 694L, 123,
- Komatsu et al. (2009) Komatsu, E., et al. 2009, ApJS, 180, 330
- Lu et al. (1994) Lu, L., Savage, B. D., & Sembach, K. R. 1994, ApJ, 437, L119
- Mac Low & Ferrara (1999) Mac Low , M.-M., & Ferrara, A. 1999, ApJ, 513, 142
- Mason et al. (2003) Mason, K. O., et al. 2003, ApJ, 582, 95
- Morris et al. (1993) Morris, S. L., et al. 1993, ApJ, 419, 524
- McGaugh (2008) McGaugh, S. S. 2008, IAUS, 244, 136
- McKernan et al. (2007) McKernan, B.,Yaqoob, T., & Reynolds, C. S., 2007, MNRAS, 379, 1359
- Mo & Mao et al. (2004) Mo, H. J. & Mao S. 2004, MNRAS, 353, 829
- Navarro et al. (1996) Navarro J. F., et al. 1996, ApJ, 462, 563
- Nicastro et al. (2002) Nicastro, F., et al. 2002, ApJ, 573, 157
- Pratt et al. (2007) Pratt, G. W., et al. 2007, A&A, 461, 71
- Primack (2009) Primack, J. P. 2009, NJPh, 11, 5029
- Prochaska et al. (2006) Prochaska, J. X., Weiner, B. J., Chen, H.-W., & Mulchaey, J. S. 2006, ApJ, 643, 680
- Rasmussen et al. (2003) Rasmussen, A., Kahn, S. M., & Paerels, F. 2003, in The IGM/Galaxy Connection, ed. J. L. Rosenberg & M. E. Putman (ASSL Vol. 28: Dordrecht: Kluwer), 109
- Rasmussen et al. (2009) Rasmussen, J., et al. 2009, ApJ, 697, 79
- Różańska et al. (2004) Różańska, A., et al. 2004, ApJ, 600, 96
- Sheth et al. (2001) Sheth R. K., et al. 2001, MNRAS, 323, 1
- Shull et al. (2009) Shull, J. M., et al. 2009, ApJ, 699, 754
- Sommer-Larsen (2006) Sommer-Larsen, J. 2006, ApJ, 644, 1
- Springel et al. (2005) Springel, V., et al. 2005, Nature, 435, 629
- Stocke et al. (2006) Stocke, J. T., et al. 2006, ApJ, 641, 217
- Stocke et al. (2007) Stocke, J. T., et al. 2007, ApJ, 671, 146
- Strickland et al. (2002) Strickland, D. K., et al. 2002, ApJ, 568, 689
- Sun et al. (2009) Sun, M., et al. 2009, ApJ, 693, 1142
- Swartz et al. (2006) Swartz, D. A., et al. 2006, ApJ, 647, 1030
- Tang et al. (2009a) Tang, S., et al. 2009a, MNRAS, 392, 77
- Tang et al. (2009b) Tang, S., et al. 2009b, MNRAS, 398, 1468
- Tripp & Savage (2000) Tripp, T. M., & Savage, B. D. 2000, ApJ, 542, 42
- Tripp et al. (2006) Tripp, T. M., et al. 2006, ApJ, 643, L77
- Tripp et al. (2003) Tripp, T. M., et al. 2003, AJ, 125, 3122
- Tripp et al. (2008) Tripp, T. M., et al. 2008, ApJS, 177, 39
- Tully (1987) Tully, R. B. 1987, ApJ, 321, 280
- Verner et al. (1996) Verner, D. A., et al. 1996, ADNDT, 64, 1
- Wakker & Savage (2009) Wakker, B., & Savage, B. 2009, ApJS, 182, 378
- Wang et al. (2005) Wang, Q. D., et al. 2005, ApJ, 635, 386
- Williams et al. (2005) Williams, R., et al. 2005, ApJ, 631, 856
- Williams et al. (2007) Williams, R., et al. 2007, ApJ, 665, 247
- Yao & Wang (2005) Yao, Y., & Wang, Q. D., 2005, ApJ, 624, 751
- Yao & Wang (2006) Yao, Y., & Wang, Q. D., 2006, ApJ, 641, 930
- Yao & Wang (2007) Yao, Y., & Wang, Q. D., 2007, ApJ, 658, 1088
- Yao et al. (2008) Yao, Y., et al. 2008, ApJ, 672, L21
- Yao et al. (2009a) Yao, Y., et al. 2009a, ApJ, 696, 1418
- Yao et al. (2009b) Yao, Y., et al. 2009b, ApJ, 697, 1784
- Yaqoob et al. (2003) Yaqoob, T., et al. 2003, ApJ, 582, 105