Effects of strain on the electronic structure of VO2
Abstract
We present cluster-DMFT (CTQMC) calculations based on a downfolded tight-binding model in order to study the electronic structure of vanadium dioxide (VO2) both in the low-temperature () and high-temperature (rutile) phases. Motivated by the recent efforts directed towards tuning the physical properties of VO2 by depositing films on different supporting surfaces of different orientations we performed calculations for different geometries for both phases. In order to investigate the effects of the different growing geometries we applied both contraction and expansion for the lattice parameter along the rutile -axis in the 3-dimensional translationally invariant systems miming the real situation. Our main focus is to identify the mechanisms governing the formation of the gap characterizing the phase and its dependence on strain. We found that the increase of the band-width with compression along the axis corresponding to the rutile -axis is more important than the Peierls bonding-antibonding splitting.
pacs:
71.15.Ap, 71.27.+a, 71.30.+h, 79.60.-iI Introduction
Vanadium oxides compounds exhibiting exotic transport phenomena are subjects of extensive interest. In particular vanadium dioxide, VO2, undergoes a first-order transition from a high-temperature metallic phase to a low-temperature insulating phase at almost the room temperature (K) morin . There are intensive efforts around the world to make devices such as switches, transistors, detectors, varistors, phase change memory, exploiting the unique properties of VO2.
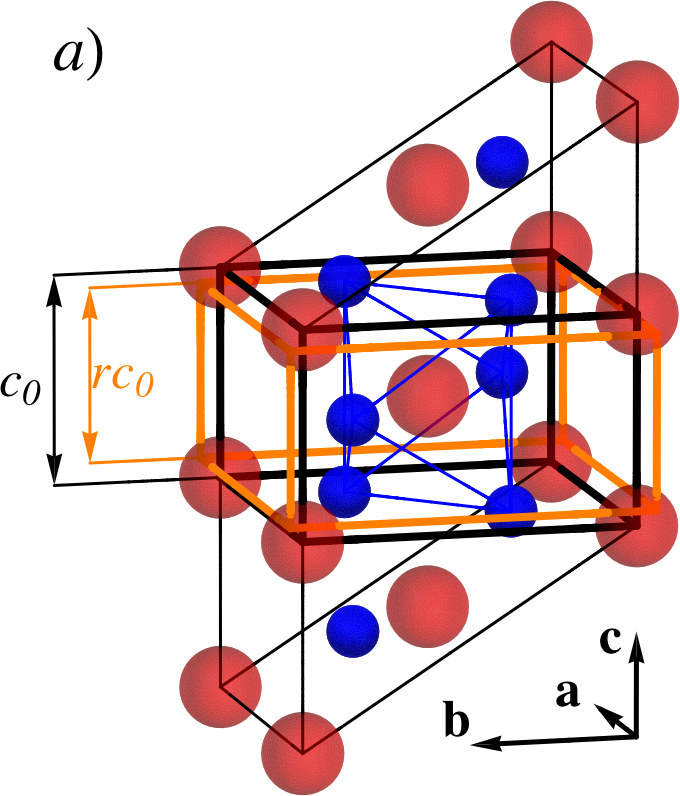
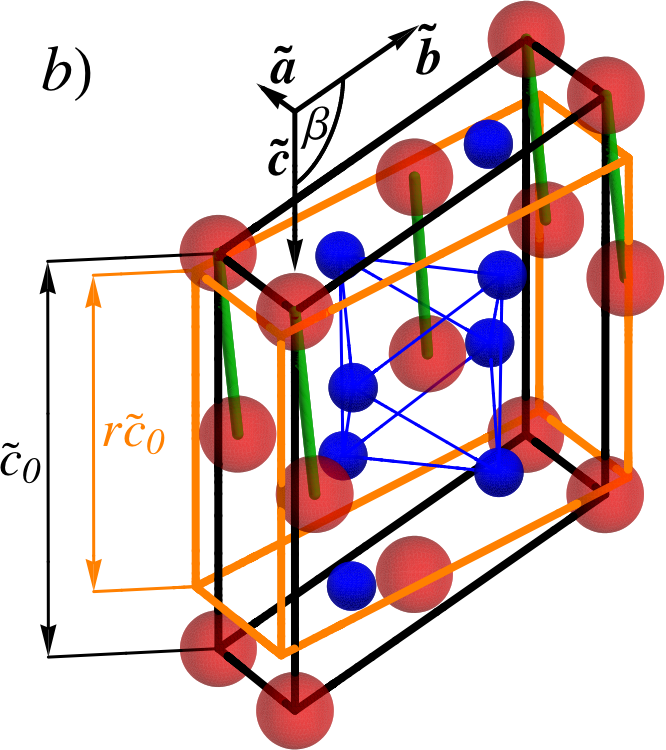
At low-temperature VO2 has a simple monoclinic () structure with space group ( phase) while at high temperature it has a simple tetragonal lattice with space group rutile (R-phase) as displayed in Fig. 1. The lattice structures of the two phases are closely related as emphasized in Fig. 1 by showing similar wedges of the different lattices: the unit cell is similar to the R unit cell, when the latter is doubled along the rutile -axis. For the sake of simplicity, we will use the notation -axis for both the and R phase when referring to the axis equivalent to the rutile -axis (in phase this axis is sometimes called -axis). The phase is characterized by a dimerization of the vanadium atoms into pairs, as well as a tilting of these pairs with respect to the -axis KL70 ; andresson as indicated by showing bonds between the paired V atoms in Fig. 1b.
The electronic and transport properties are dramatically different for the two phases. The resistivity jumps by several orders of magnitude through the phase transition, and the crystal structure changes from R-phase at high-temperature to monoclinic -phase at low-temperature morin ; allen . While the rutile phase is a conductor, the phase is an insulator with a gap of eV KHH+06 at the Fermi energy. VO2 has also attracted a great deal of attention for its ultrafast optical response, switching between the R and the phases lysenko ; cavalleri ; Baum . Despite the large number of experimental Baum ; MH02 ; Maekawa ; Qazilbash1 ; Qazilbash2 ; Qazilbash3 ; QBW+08 ; Eguchi ; Ruzmetov ; Braichovich ; Dmitry ; KHH+06 and theoretical BPL+05 ; Tomczak1 ; Tomczak2 ; Sakuma ; Gatti ; E02 ; RSA94 ; LCM06 ; LIB05 studies focusing on this material the physics driving this phase transition and the resulting optical properties are still not identified undoubtedly. In the theoretical works using LDA E02 ; RSA94 ; allen the formation of the gap was not found. The single site DMFT approach LCM06 ; LIB05 is known to correctly describe the metallic phase but can not take into account the formation of the bonding states of the dimers in the insulating phase which requires the cluster DMFT method BPL+05 . As shown in Ref. Tomczak2 the fully interacting one-electron spectrum of the phase can be reproduced by an effective band structure description. The optical conductivities calculated by using cluster DMFT shows good agreement with the experiment for both phases TB09 .
The metal-insulator transition (MIT) of VO2 is usually attributed to two different physical mechanisms. One of them is the Peierls physics, i.e. the dimerization of the V atoms along the rutile -axis g60 , and consequently opening of the gap in the Brillouin-zone reduced in the direction along the -axis. In this case, the gap opening can be explained in the framework of effective one-electron theories. The other one is the Mott mechanism where the gap opens due to the strong Coulomb repulsion between the localized V- orbitals ZM76 and the related dynamical effects. Understanding in detail the interplay and relative importance of both the Peierls and the Mott mechanisms for the electronic structure is crucial for controlling this material with an eye towards applications. For example, whether the driving force of this transition is electronic (i.e. occurring on femtosecond timescales) or structural (occurring on the picosecond timescale) is important to understand the speed of the switching from the to the rutile phase. From the perspective of applications, in order to control the properties of vanadium dioxide, it is essential to identify the effects of compressive and tensile stress resulting from the various substrates, on which the films are deposited MH02 ; Maekawa .
The experimental results of Ref. MH02 showed that compressive uniaxial strain (along the -axis) stabilizes the metallic phase. This result cannot be explained by applying a simple Peierls picture exclusively. The Peierls mechanism predicts that a compression along the -axis increases the splitting between the bonding and antibonding state, formed by the combinations of particular orbitals residing on the different V atoms in a dimer, and hence would promote insulating state. The Peierls mechanism thus increases the tendency to open the gap in the phase, which would stabilize the insulating phase at the expense of the metallic phase. In this picture, the transition temperature would increase under uniaxial compressive strain, opposite to experiment MH02 .
The LDA calculations fail to reproduce the gap in the phase E02 . This suggests that the correlations are important in this material. Motivated by this and the above mentioned experiment we have examined the influence of strain on the electronic structure of VO2 microscopically applying the dynamical mean-field theory GKK+96 combined with the local density approximation of density functional theory (LDA+DMFT) KSH+06 . We carried out LDA+DMFT calculations of VO2 under strain. We established that in addition to the Peierls distortion, other factors like the position of the band and the band-width of the bonding state in the phase showing definite sensitivity to the strain, play a defining role in driving the MIT in VO2. Theoretical predictions for the strain dependence of many spectroscopic quantities are made, including the photoemission, the optical conductivity, the inverse photoemission and XAS in the and phases. The insights achieved in this study together with the computational machinery developed, will serve as a basis for rational material design of VO2 based applications.
II Method
The unit cell of the rutile structure contains two vanadium and four oxygen atoms while the structure contains four vanadium (2 dimers) and eight oxygen atoms. The calculations in the rutile phase were performed with the doubled unit cells (four V and eight O atoms) to allow the formation of a bonding state between the V atoms separated along the -axis, a mechanism which has dramatic effect in the phase. The lattice structure parameters for the rutile (referred as , and in the following) and cases (, , and ) were published by McWhan et al. in Ref. MMR+74 and Kierkegaard and Longo in Ref. KL70 , respectively. Note that our notation of the axis differs from the published data E02 , in order to emphasize the similarity of the R and structures.
The strain was applied by changing the lattice constants but not the internal parameters of the atomic positions. The strain is characterized by the ratio between the experimental lattice constant along the -axis of the unstrained crystal, and the one used in the calculation, in the rutile and in the case. The applied strains correspond to , 1.00 and 1.02 ratios both for the R and phases in order to make calculations which are compatible with the experiment in Ref. MH02 . The lattice parameters were changed with the constraint to preserve the volume of the original unit cell and to form a structure to closely resemble the original structure. This is illustrated in Fig. 1 for both phases. The constant volume constraint in the rutile phase requires for the other two lattice constants and . For the structure, two other constraints were introduced: the two ratios and were kept constant. Hence we used the following lattice constants and angles , , and .
For the R-phase, we used a local coordinate system introduced by Eyert in Ref E02, , as shown in Fig. 2. In the rutile geometry the -axis is parallel to the rutile -axis while the -axis points along the direction, pointing to the adjacent oxygen atom in the vanadium plane. In the phase, our local coordinate system is somewhat tilted to align to monoclinic geometry. The symmetry classification of the electronic orbitals is also adopted, namely and stand for the states and , and for the orbitals. The manifold is divided further: the notation is used for state and for the and states. In this choice of the local coordinate system the dimerization strongly affects the states, which have large electron density along the V-V bond.
First, a self-consistent LDA calculation was performed using the linear muffin-tin orbitals method combined with the atomic sphere approximation (LMTO-ASA) lmto . For a satisfactory description of the interstitial region 48 empty spheres were added in the LDA-ASA calculations. In the next step we determined a downfolded parameters of the low energy, effective Hamiltonian, , including only the subset of electronic states lying in the vicinity of the Fermi energy. The effective Hamiltonian is constructed as:
| (1) |
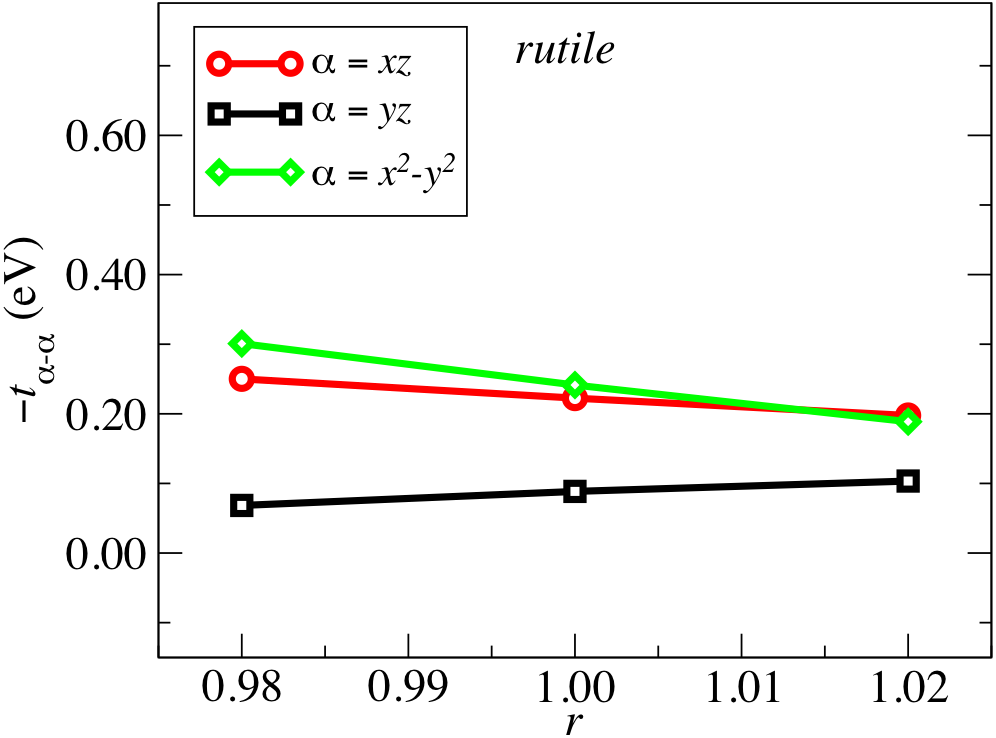
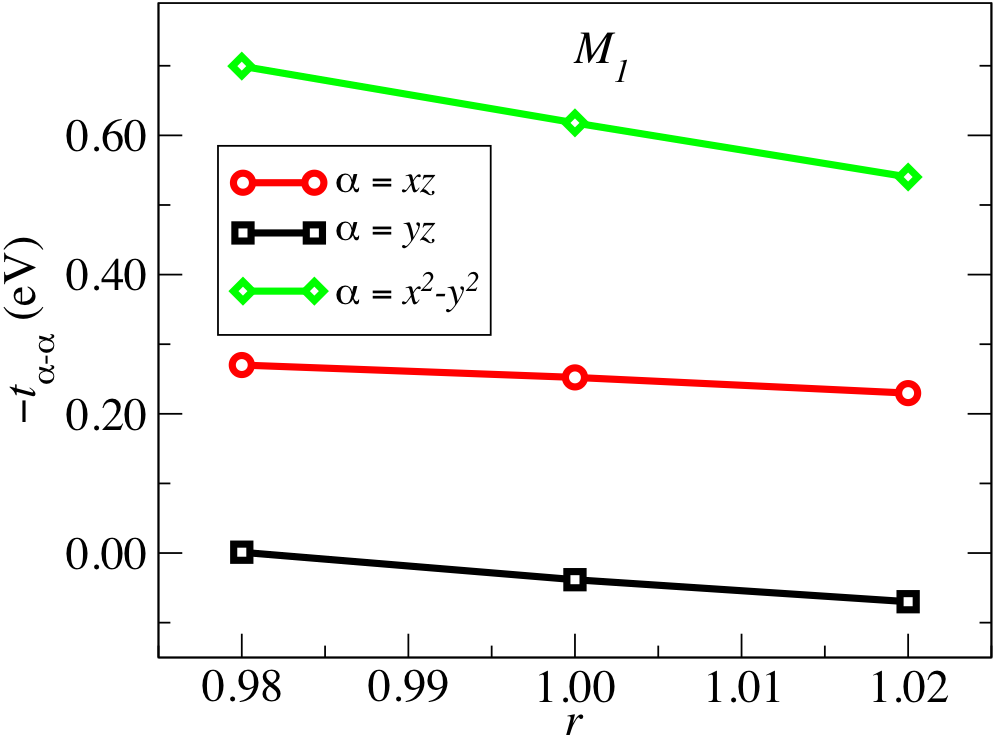
with off-diagonal hopping () and diagonal one-electron energy () parameters belonging to different sites and states (, , ) with a spin character . The applicability and accuracy of the above downfolding method is determined by the mutual positions and characters of the electronic bands. In the studied case of VO2 both in the and R phases the bands in the proximity of the Fermi level have mainly character and are well separated from both the low-lying -bands of the oxygen, and from the bands of vanadium, due to the strong crystal-field splitting ( eV E02 ). The crystal field splitting is due to oxygen octahedron surrounding the individual V atoms. This mapping of the LDA band structure onto a tight-binding type Hamiltonian provides a reasonably good description of the electronic structure as compared to the LDA serving as a good starting point for the following DMFT calculations. The evolution of the intra dimer V-V hopping matrix elements corresponding to the three different orbitals induced by the strain are shown in Fig. 3. Although, the relative changes in the parameters are small, the manifestations of these changes in the low energy spectral function, and therefore in the transport properties, are significant.
The effects of the electron-electron interaction beyond LDA are treated by means of the dynamical mean-field theory GKK+96 ; KSH+06 . The coulomb interaction was taken into account for the V-V dimers by using the cluster extension of the DMFT KSH+06 . In this approach the quantities describing the electronic states of a cluster (Green’s function, self-energy, etc.) are matrices of both the site and electronic state indices. Having two sites (two V atoms) and three states ( states) the resulted matrices have dimensions of for non-magnetic calculations. For solving the impurity problem, we used the continuous time quantum Monte Carlo method (CTQMC) H07 at the temperatures K and K, below and above the critical temperature, for the and R cases, respectively. In the present calculations we assumed on-site Coulomb interaction on the V atoms written as:
| (2) |
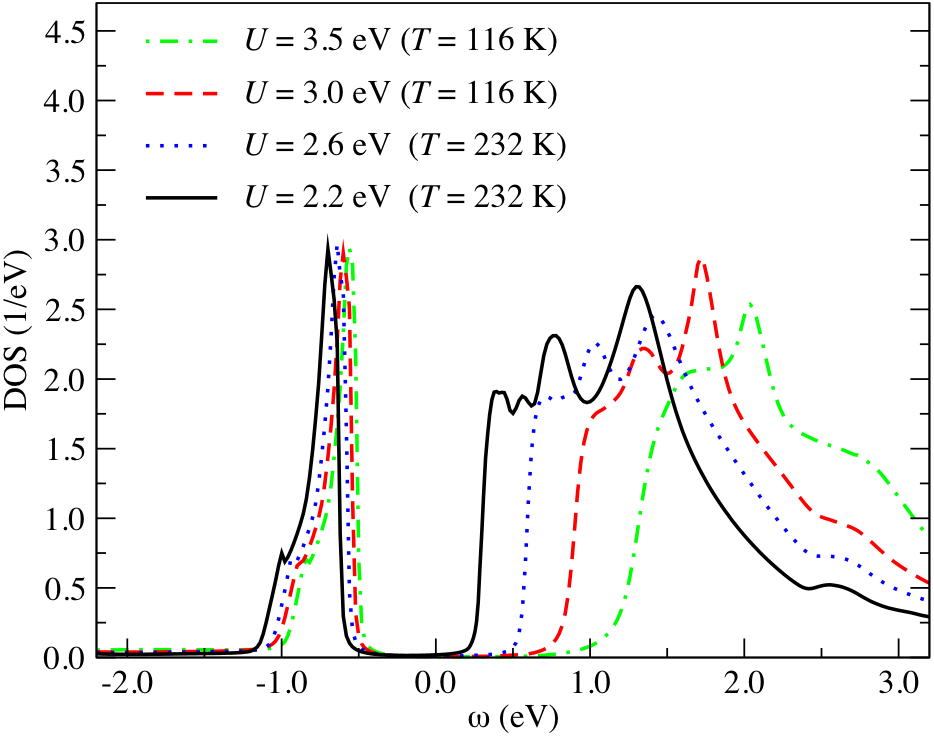
excluding the terms with similar orbital and spin character at same time. We fixed the parameter at eV, to reproduce the experimentally measured gap in the phase, which shows a weak temperature dependence between 100 and 340 K, varying between and eV OFO01 ; KHH+06 . The strong dependence of the gap size on the parameter is shown in Fig. 4.
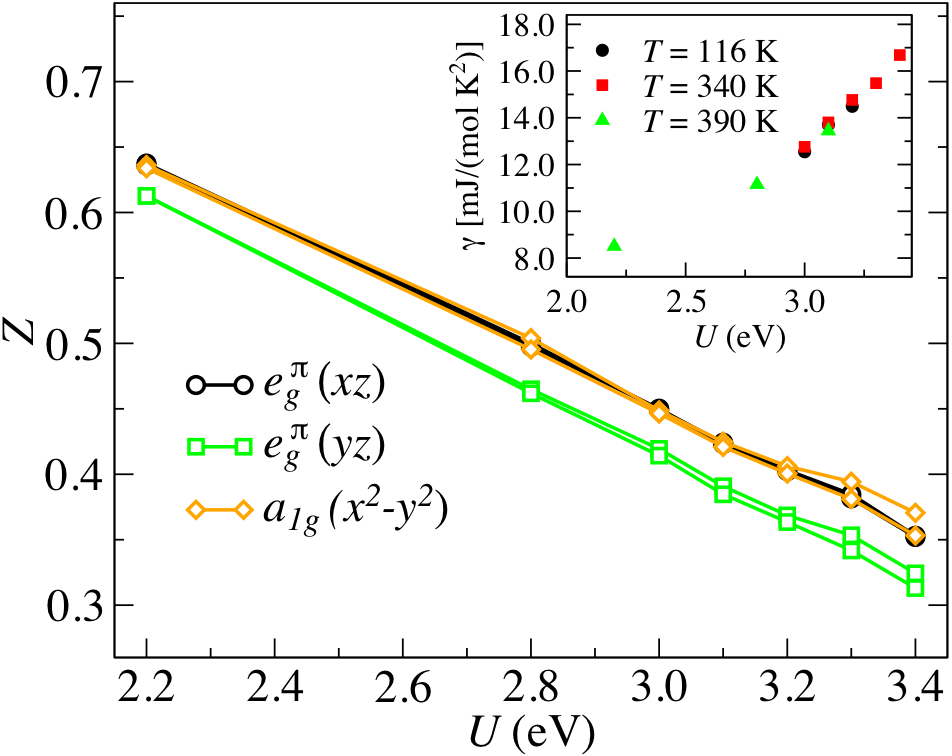
The linear dependence of the renormalization factor calculated from the real part of the self-energy of the different orbitals as and the electronic specific heat, , of the rutile phase are shown in Fig. 5. The value obtained at eV is in good agreement with the one published in Ref. BPL+05 . An alternative method to determine the value of factor is to take the ratio of the experimentally measured plasma frequency in the rutile phase ( eV)QBW+08 and devide it by the band theoretical LDA-LAPW calculation wien2k ( eV), i.e., , which agrees well with in the case of eV. Although the was chosen to reproduce the gap in the -phase, it is satisfying that this value is also compatible with the alternative estimation, based exclusively on the optical and thermodynamic properties of the rutile phase.
In order to achieve a structured (almost diagonal) self-energy matrix for the cluster, we used a basis of symmetric and anti-symmetric combination of the states localized on the individual V atoms of the dimers defined as
| (3) |
To obtain the physical properties at real energies we performed analytic continuation to the real axis using a recently developed method of expansion in terms of modified Gaussians and a polynomial fit at low frequencies, as described in details in Ref. HYK09 .
III Results and Discussion
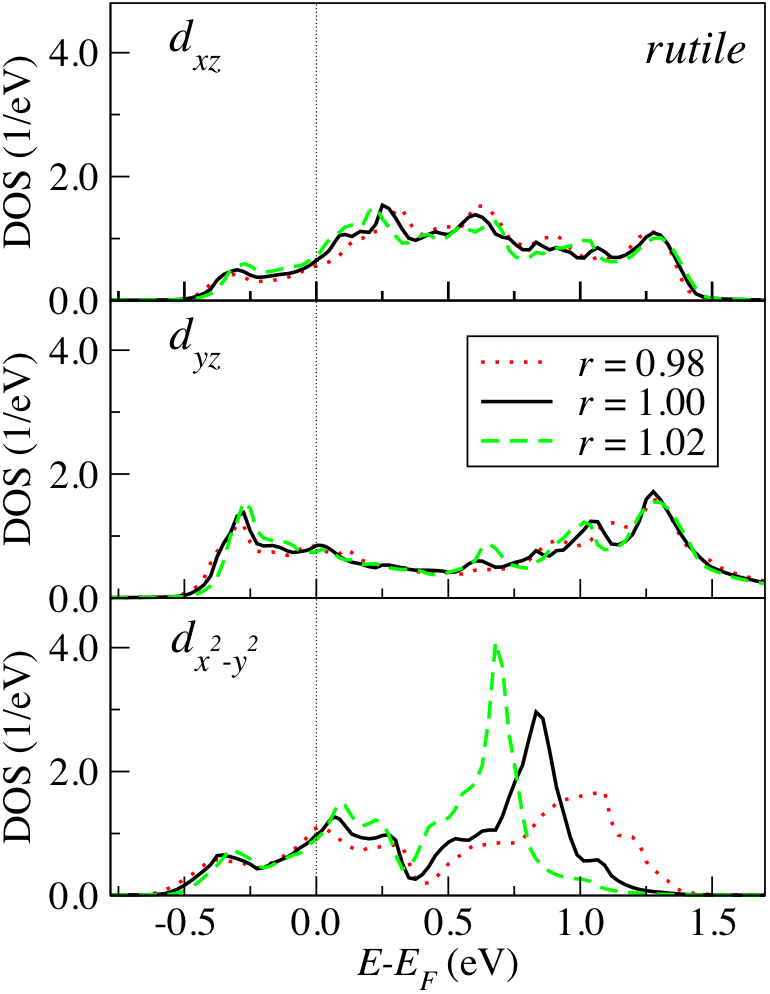
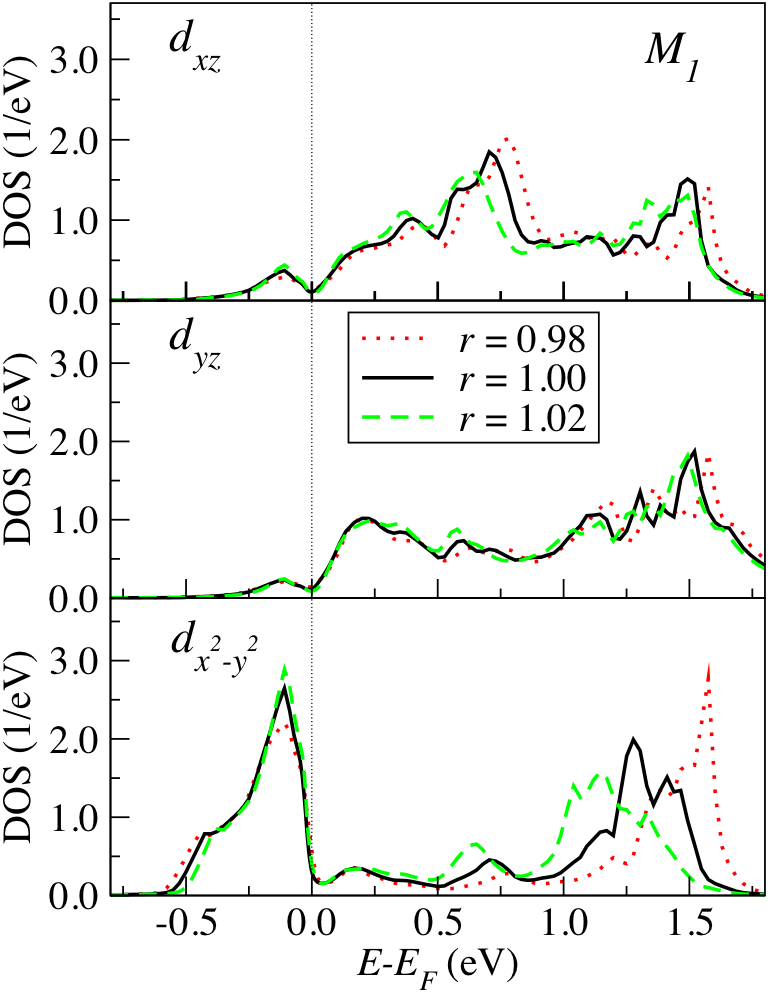
Fig. 6 displays the LDA densities of states (DOS) of the V atoms in both the rutile and phases for different ratios (, 1.00, 1.02). The total band-width ( eV for both phases) and also the fine details of the DOS obtained by the LDA-LMTO agree well with previous studies E02 ; LCM+06 . The minor discrepancies are probably a consequence of the different electronic structure method or the slightly different geometry.
The effect of the stress applied along the rutile c-axis on the electronic DOS can be clearly seen. The position of the peak is changed considerably, while the total band-width is only slightly changed ( eV) under application of stress. Only the orbital changes significantly, while the two orbitals remain mostly unchanged. This is due to the sensitivity of the overlap integral of states along the -axis. It is clear from Fig. 6 that the splitting of the peaks strongly increases with decreasing lattice parameter roughly following the linear dependence of the intra-dimer hopping parameter on ratio , shown in Fig. 3. However, even under compressive stress of , the splitting is not large enough to open a gap in the phase. The value of the intra-dimer hopping parameters corresponding to the states, which plays a significant role in the formation of the electronic structure of VO2, are eV and eV for the R and cases, respectively. These values are in a good agreement with published values of Ref. BPL+05, . One can observe that the splitting of the peaks are larger for the geometry ( eV) than for the rutile structure ( eV). This can be attributed to the reduced V-V distance along the -axis due to the dimerization. The splitting of the bands can be roughly approximated by for the different ratios. This behavior resembles the bonding and anti-bonding splitting of a dimer molecule, suggesting that the splitting of these states is determined mainly by the intra dimer hopping, especially in the case. For the states, this correspondence is less clear, showing the importance of the inter-dimer hoppings. It is worth to note that the LDA calculations can capture only the Peierls physics, which alone is not sufficient to explain the formation of the gap even if a reduced V-V distance is considered.
To trace the effect of the electron-electron interactions e.g., appearance of the gap in the phase and the reduction of the band-width, we carried out LDA+DMFT calculations. Our theoretically calculated orbitally resolved spectral functions can be directly compared to the measured angle integrated photoemission (PES) and x-ray absorption spectroscopy spectra (XAS). In the last few years a large number of experimental studies of these kind were carried out probing also the many body character of the occupied and the unoccupied states in VO2 and serving as a stringent test of the theoretical approach. This validation of our LDA+DMFT results is crucial before proceeding to make reliable predictions for the strained materials for which these spectroscopic information is not yet available.
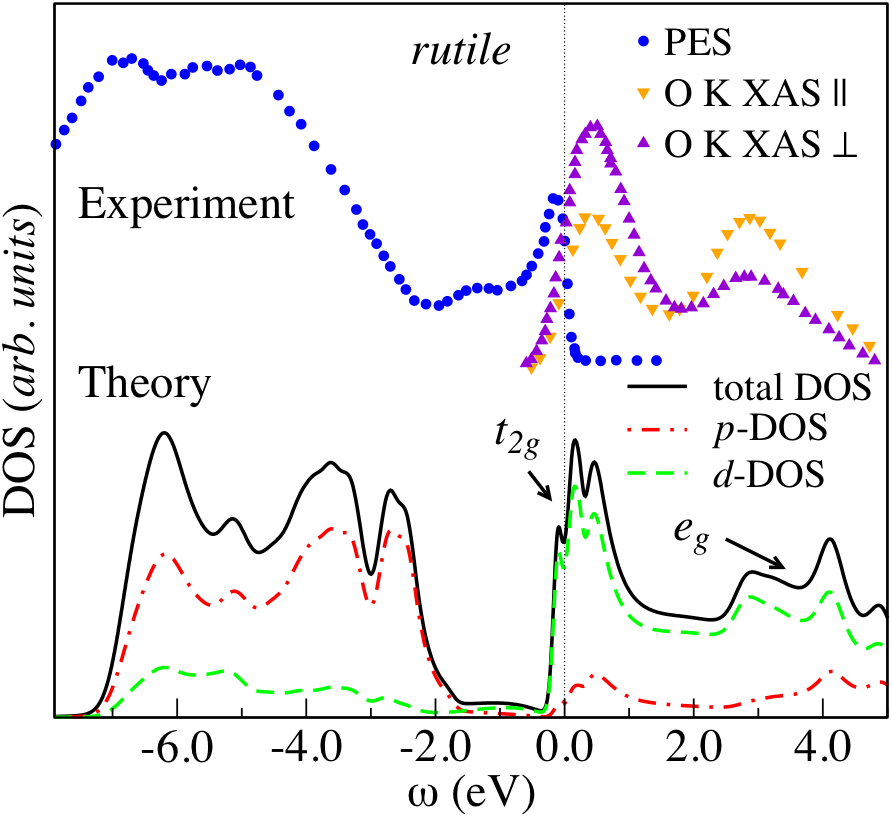

The upfolded density of states of the LDA+DMFT, which includes besides the V- states the O- and the V- states, are shown in Fig. 7. The dynamical correlation effects, not included in LDA, decrease the width of the quasiparticle states for times, in agreement with our calculated quasiparticle renormalization amplitude . In the rutile structure two Hubbard bands appear: a very weak lower Hubbard band around -1.0 eV (was previously reported in theoretical BPL+05 and experimental KHH+06 studies) and a stronger upper hubbard band at 2.0 eV which overlaps with the band (can be seen better in Fig. 9 where the band is not shown). In the phase, the most prominent effect of the DMFT theory is the appearance of a gap of eV at the chemical potential. For both the rutile and phase the positions of the O- and the V- states show good agreement with the experiments. Our calculated factors for the phase are for the state and for the state confirming that the phase is ”less correlated” than the rutile phase, as emphasized in Ref. Tomczak2, .
Fig. 8 shows the momentum resolved spectra in the R and -phase. Notice the downshift of the two bonding bands in the phase, primarily of character (notice that there are four V atoms per unit cell, and hence two bonding bands). The states above the Fermi level move slightly up and shrink due to many-body renormalization similarly to the states in the R phase. The bands around eV also acquire substantial lifetime in both phases. The oxygen bands below eV and the bands above eV are almost unchanged compared to LDA.
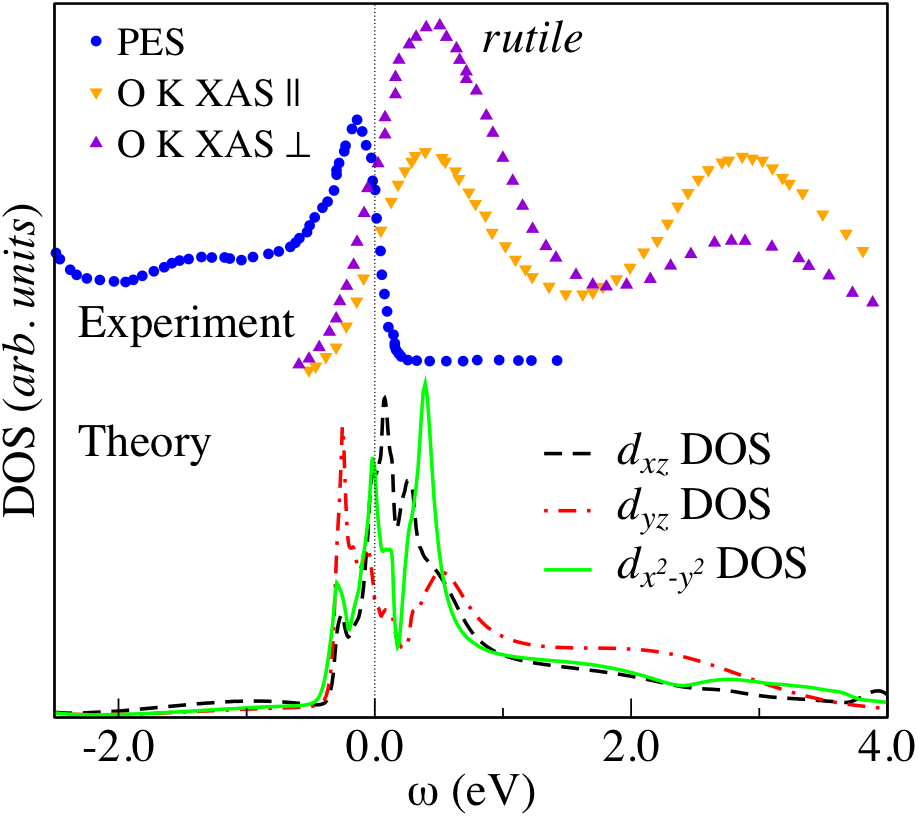
The results for the orbitally resolved spectral functions are shown in Fig. 9. In the rutile phase one can see that the three states are approximately equally occupied predicting isotropic transport properties. For the state the bonding anti-bonding structure can be also recognized similarly to the phase with a splitting of eV which is by a factor of 2 smaller then in the LDA results. The calculated positions of the states agree well with the XAS results. In the phase, the weight redistribution is very different: only a single state, namely the bonding orbital is occupied. One can observe that the bonding state is shifted for eV lower, which is in good agreement with the previous theoretical results BPL+05 . The spectral function at the upper edge of the gap has predominantly the character, but there is also some weight of the anti-bonding character, which is in agreement with experiment showing that the spectral density has not purely character above the gap KHH+06 . The first two peaks at eV above the chemical potential are attributed mainly to the states, and the third one is due to the state. This is consistent with the recent results of polarization dependent O K XAS experiments from Koethe at al. KHH+06 where the orbital character of the states can be deduced by changing the polarization of the x-ray from parallel (O K XAS ) to the -axis to perpendicular polarization (O K XAS ). The anti-bonding state lies at 1.3 eV above the Fermi level. This peak did not appear in previous theoretical studies of Ref BPL+05, , but agrees well with current XAS results, which show that there is a prominent eV above the peak KHH+06 ; AGF+91 ; SST+90 . It is interesting to note that the position of the anti-bonding state is roughly the same in both the DMFT results and the pure LDA results. The calculated separation between the bonding and anti-bonding peaks of the state is eV, which agrees reasonably with the experimentally found value ( eV)KHH+06 . Finally, the peak around eV of the XAS spectra may be assigned to the contribution from the states, included in Fig. 7, but excluded in Fig. 9. This is consistent with the experimental finding of Ref. KHH+06 where negligible change of the peak weight was observed across the MIT, but strong sensitivity to the polarization was noticed.

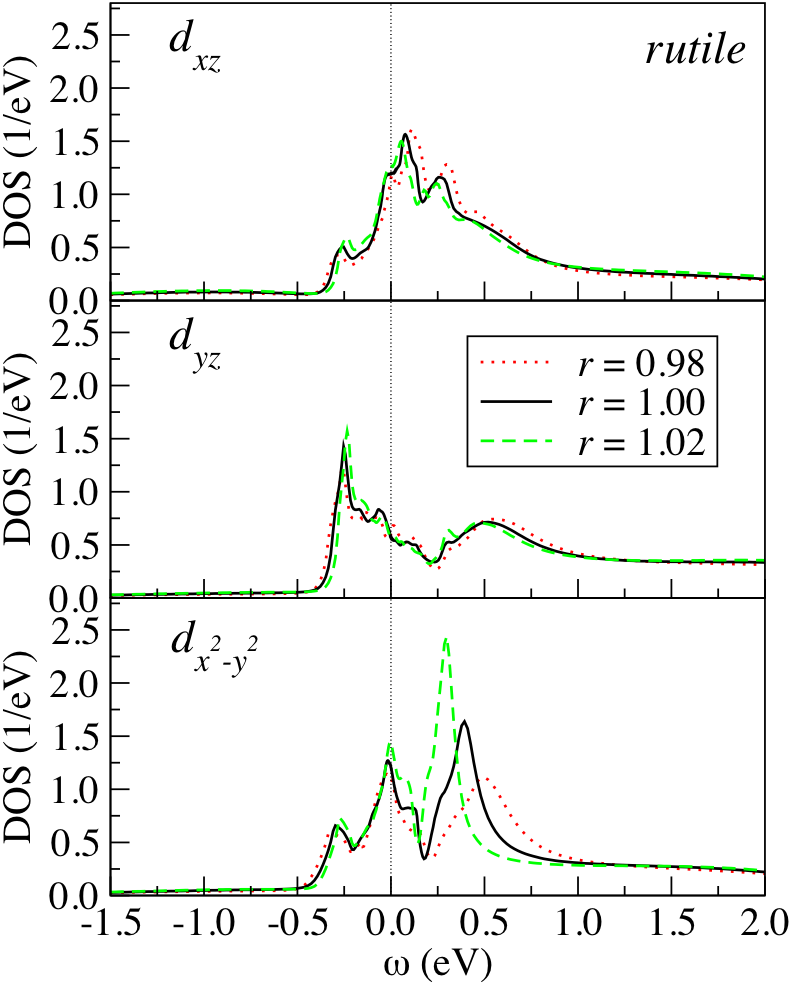
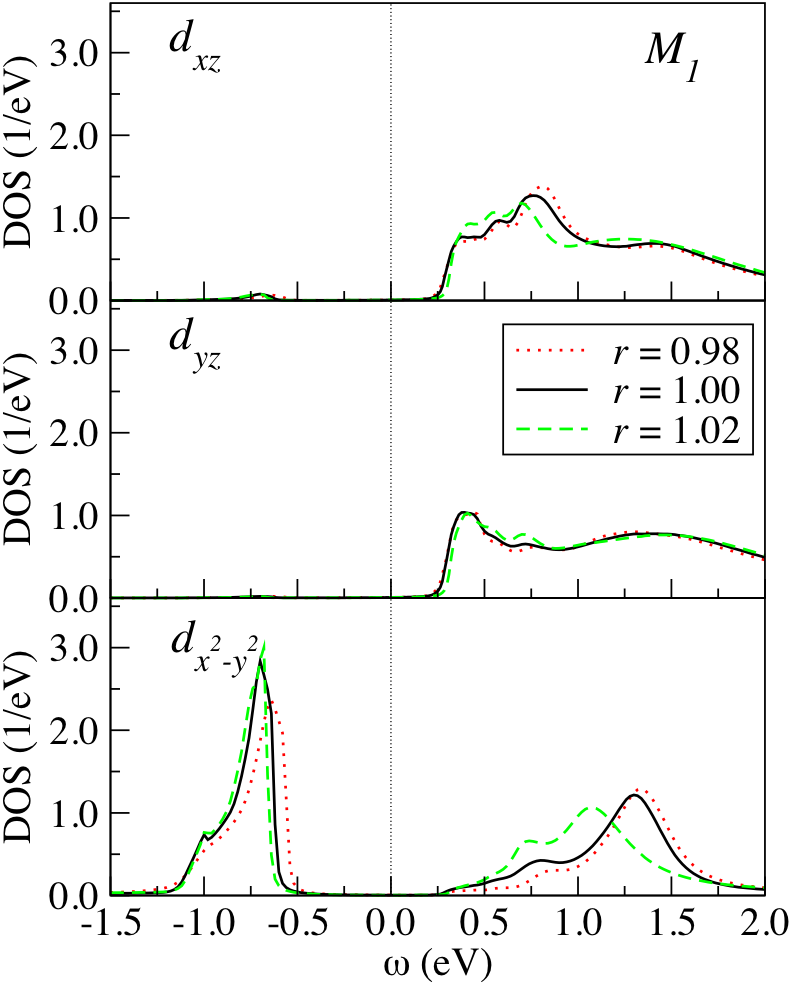
To elucidate the effect of the strain along the -axis the spectral functions of the orbitals for different ratios (, 1.00 and 1.02) are shown in Fig. 10 for both phases. In the rutile phase the states are hardly affected by the strain. In contrast, the bonding anti-bonding splitting of the states shows a strong sensitivity to strain. The width of the upper peak at eV decreases with increasing , which is due to the weaker hybridization between the V atoms, as indicated by the decreasing hopping integrals. Surprisingly, the spectral weight at the chemical potential is practically unaffected by the changes of the lattice constant . Similar calculation using cluster DMFT was carried out for the rutile phase, allowing for the formation of split bonding-anti-bonding pairs along the -axis. We did not find an appreciable sign for the development of the bonding-antibonding splitting even for the case, confirming that the single site DMFT is quite accurate in the rutile phase.
Fig. 10 clearly shows that the width of the bonding peak is increased with decreasing ratio, which can be attributed to the increase in inter dimer hoppings. For all ratios , the gap in orbital space is indirect, i.e., the valence band is of character and the conduction band of character. This is in agreement with the experimental findings of Ref. KHH+06, demonstrating that the Peierls physics is playing a secondary role in the gap opening in phase. Due to the decreasing length of the -axis, the states are shifted to slightly lower energy, which together with the broadening of the bonding peak results in the contraction of the gap, despite the increase in the bonding anti-bonding splitting of the peaks. The decrease of the gap size due to decreasing -axis length is more apparent in the inset of Fig. 11, which shows the total DOS. This result is supported by the experimental result of Muraoka and Hiroi MH02 demonstrating that the decrease in lattice parameter leads to decrease in the metal-insulator transition temperature. This is a clear indication that smaller -axis length leads to a weakened stability of the insulator in the phase, and consequently a smaller gap in phase. This behavior is not expected for a Peierls type gap, which increase as the lattice parameter decreases along the dimerized chains.
The evolution of the gap is reflected also in the gap of the optical conductivity millis04 . In Fig. 11 the real part of the average optical conductivity is shown, where is the optical conductivity in the case where the polarization of incident light is parallel (perpendicular) to the -axis. The calculated optical gap and the intensity of the first peak corresponding to the excitations compare well with the experimental results for polycrystalline VO2 films QBW+08 . The shoulder around eV in the experimental optical conductivity, which is primarily due to the inter-band transitions, is shifted slightly upwards ( eV) in the theoretical result. This is an indication that the applied downfolding method describes well the low-energy properties, but not so well the higher energy interband excitations.

The fact that the gap in the density of states arises between orbitals of different symmetry, indicates that the anisotropy of the transport properties in this phase will be very sensitive to disorder and grain boundaries which can drastically alter the orientation of these orbitals changing the matrix elements for hopping and conductivity.
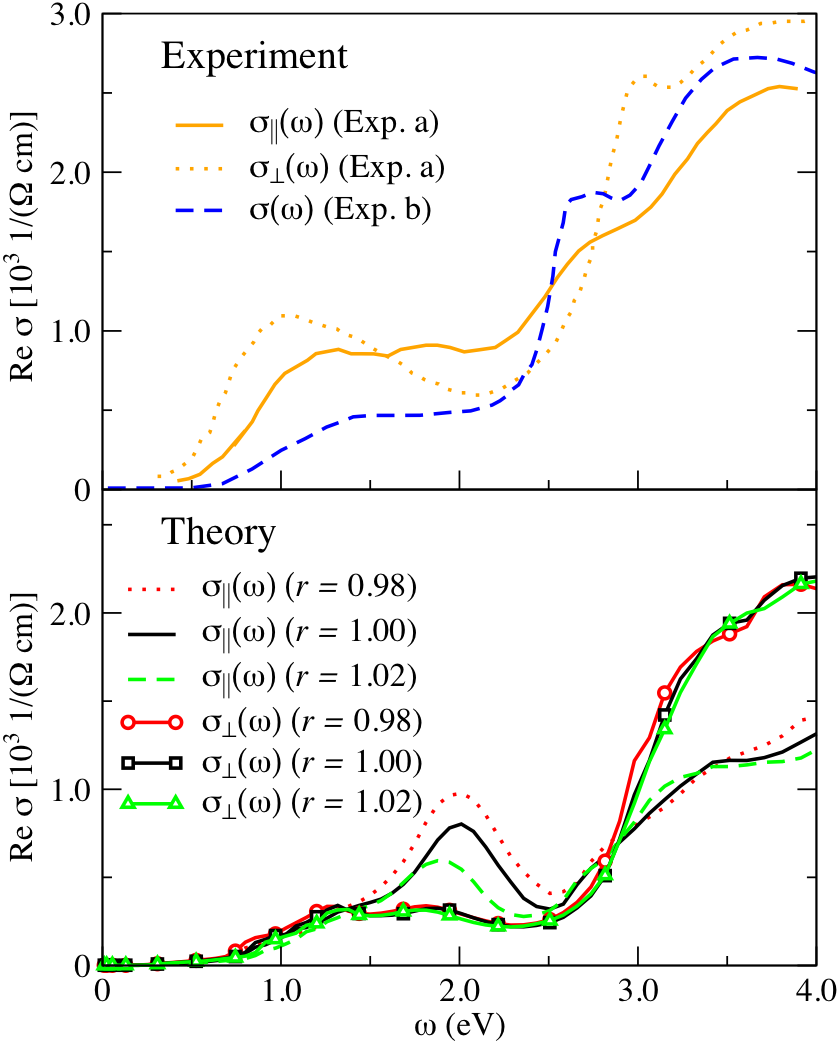
Fig. 12 shows the calculated and experimentally measured optical conductivity for differently polarized light. It can be seen that the trends of the dependence of the optical conductivity on the polarization are in a good agreement with experimental results, although the values are slightly different. When the polarization is perpendicular to the -axis the optical response is practically unaffected by the strain. In case of parallel polarization the optical conductivity is strongly modified by changing the lattice parameter , especially in the frequencies between eV. This region can be attributed to the excitations as can be concluded from the positions of the bonding and antibonding peaks in Fig. 10. This results strongly indicate that the anisotropy of the transport properties is due to directed V-V bonds along the -axis.
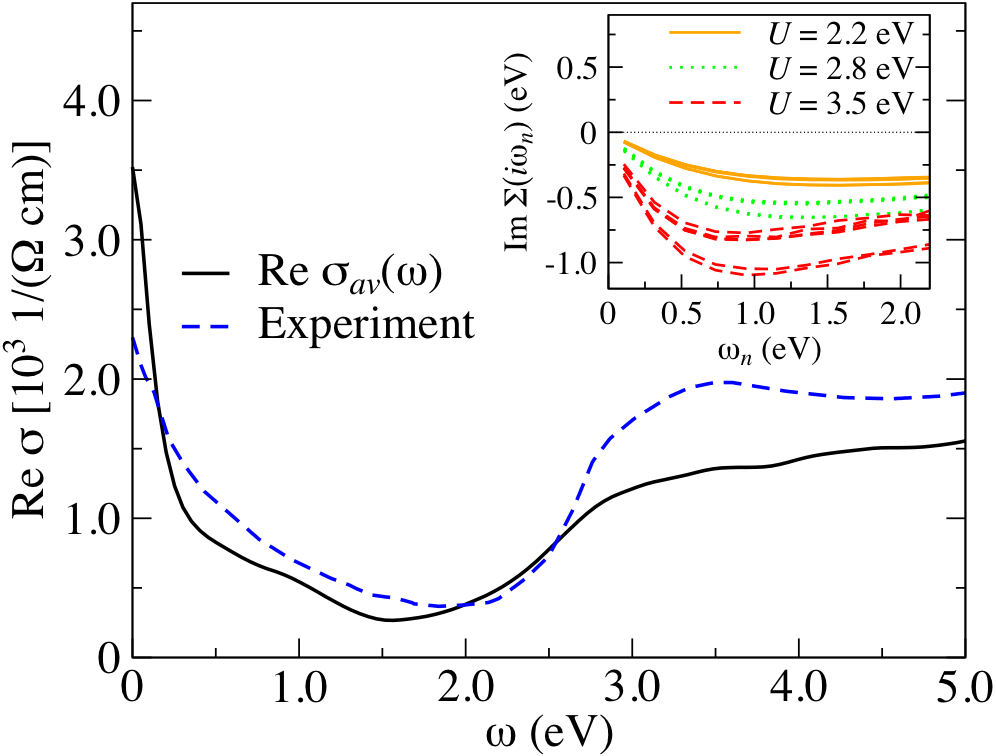
In Fig. 13, the orientation average optical conductivity of the R phase and the imaginary part of the self-energy at the Matsubara frequencies close to zero are shown. While the area below the calculated and experimentally measured QBW+08 optical conductivity (plasma frequency) agree fairly well, the width of the two Drude peaks are different. In order to improve the agreement with experimental results QBW+08 an imaginary part of 0.55 eV (scattering rate) was added to the self-energy for the low frequency part of the optical conductivity, to simulate the experimentally measured broadening of the Drude peak. Inspecting the inset of Fig. 13, one can see that even by employing larger values, the scattering rate () is not large enough to reproduce the experimental results, and the calculated optical conductivity will not show bad metal behaviour at this temperature. From this result one can draw the conclusion that the experimentally measured large scattering rate is a consequence of an inhomogeneity of the system as indicated in recent experiments Qazilbash3 ; CES+09 .
IV Phase diagram and limits of downfolding

In Fig. 14, a sketch of the phase diagram of the rutile structure based on calculated points within the cluster DMFT is displayed as a function of the temperature and the Coulomb repulsion parameter . Three different phases are distinguished: the metal (M), the insulator (I) and the coexistent (C) regions. To identify them, the imaginary part of the local Matsubara Green’s function, , of the cluster was investigated. We considered that the solution is insulating when converges to 0 at low imaginary frequencies for all orbitals, as shown in an example in the right inset of Fig. 14. The metallic solutions are the ones where tends to a finite value for at least one of the orbitals (see the left inset in Fig. 14). In the metallic region only the metallic solution is stable. In the insulator region only the insulating solution is stable, and in the coexistence region, both are stable. In order to decide whether a solution is stable or not, the DMFT calculations were started from an ansatz of a specified type (metal or insulator) and if it remained of the same type after the self-consistent solution is reached, one can regard it as a stable mean-field solution. In Fig. 14 it can be observed that below eV only the metallic solutions are stable while above eV only the insulator is stable. The nature of the insulating state in rutile phase is very different from the insulating state in phase. The lower Hubbard band in the rutile insulator is an almost equal mixture of all three orbitals. However, the interaction strength needed to open the true Mott gap without the help of the Peierls mechanism, is considerably larger. In the coexistence region, one can expect a crossover between the two phases governed by the free energy of the system PHK08 . There is a strong experimental indication that the rutile phase resides in the vicinity (but on the metallic side) of this crossover. Pouget and Launois showed that the metallic feature of the rutile phase is very sensitive by substitutional alloying of VO2 with Nb (V1-xNbxO2) which increases the ratio and results in the appearance of a gap keeping the rutile structure at JL76 . Recently, Holman et al. HMW+09 reported insulator to metal transition in V1-xMoxO2 system at . All those experiments suggest that VO2 is in the crossover region near the coexistence of two solutions in the cluster DMFT phase diagram.
On the basis of our calculation we conjecture that the rutile phase might be able to support either metallic or insulating solution (with a very small gap), and hence either of the two phases can be stabilized depending on small external stimuli. On the other hand, the phase at the same interaction strength supports only insulating solution, and it is unlikely that small external perturbation can turn it to metallic state.
One possibility to improve the agreement between the experimental and theoretical results is that one should use different parameters in the downfolded model. The second possibility is that the material is strongly inhomogeneous which was not taken into account so far in any theoretical calculations. Finally, it is most likely that calculation without invoking the downfolding approximation will result in a more accurate description of this material. This would place the VO2 closer to the Mott charge transfer insulator boundary in the Zaanen-Sawatzky-Allen phase diagram. Work in this direction is in progress.
V Conclusions
Our exploratory theoretical research set up the machinery for describing the subtle interplay of Coulomb correlations, orbital degeneracy and strain in determining the mechanism of the MIT in VO2. Our theory, coupled with existing strain experiments, clearly shows that the Peierls distortion is only one element affecting the MIT and the switching mechanism of this material. The LDA+DMFT calculations in the unstrained material are in good agreement with experiments. We performed the first LDA+DMFT studies of the electronic structure of VO2 under strain. Besides the Peierls increase in bonding-antibonding splitting, the lowering in energy of the orbital, and the rapid change in bandwidth of the orbital due to the varying overlaps, play an equally important role in controlling the position of the MIT. These theoretical insights can be used for understanding and improving material properties by means of chemical substitutions. For a more accurate description it is mandatory to take into account the oxygen degrees of freedom, and calculations of the total energy in the regions suggested by this exploratory work.
VI Acknowledgments
This research has been supported by Grants No. DARPA W911NF-08-1-0203, NSF-DMR 0806937, and OTKA F68726. We are grateful to Jan Tomczak for stimulating discussions.
References
- (1) F. J. Morin, Phys. Rev. Lett. 3, 34 (1959).
- (2) P. Kierkegaard, and J. Longo, Acta Chem. Scand. 24, 420 (1970).
- (3) G. Andresson, Acta Chem. Scand. 10, 623-628 (1956).
- (4) P. B. Allen, R. M. Wentzcovitch, W. W. Schulz, and P. C. Canfield, Phys. Rev. B 48, 4359 (1993).
- (5) T. C. Koethe, Z. Hu, M. W. Haverkort, C. Schüßler-Langeheine, F. Venturini, N. B. Brookes, O. Tjernberg, W. Reichelt, H. H. Hsieh, H.-J. Lin, C. T. Chen,6 and L. H. Tjeng, Phys. Rev. Lett. 97, 116402 (2006).
- (6) S. Lysenko, V. Vikhnin, F. Fernandez, A. Rua, and H. Liu, Phys. Rev. B 75, 75109 (2007).
- (7) A. Cavalleri, Cs. Tóth, C. W. Siders, J. A. Squier, F. Ráksi, P. Forget and J. C. Kieffer, Phys. Rev. Lett. 87, 237401 (2001).
- (8) P. Baum, D.-S. Yang, and A. H. Zewail, Science 318, 788 (2007)
- (9) Y. Muraoka, Z. Hiroi, App. Phys. Lett. 80, 583 (2002).
- (10) K. Maekawa, M. Takizawa, H. Wadati, T. Yoshida, A. Fujimori, H. Kumigashira, M. Oshima, Y. Muraoka, Y. Nagao, and Z. Hiroi, Phys. Rev. B 76, 115121 (2007)
- (11) M. M. Qazilbash, M. Brehm, G. O. Andreev, A. Frenzel, P.-C. Ho, Byung-Gyu Chae, Bong-Jun Kim, Sun Jin Yun, Hyun-Tak Kim, A. V. Balatsky, O. G. Shpyrko, M. B. Maple, F. Keilmann, and D. N. Basov, Phys. Rev. B 79, 075107 (2009).
- (12) M. M. Qazilbash, A. A. Schafgans, K. S. Burch, S. J. Yun, B. G. Chae, B. J. Kim, H. T. Kim, and D. N. Basov, Phys. Rev. B 77, 115121 (2008).
- (13) M. M. Qazilbash, M. Brehm, Byung-Gyu Chae, P.-C. Ho, G. O. Andreev, Bong-Jun Kim, Sun Jin Yun, A. V. Balatsky, M. B. Maple, F. Keilmann, Hyun-Tak Kim, and D. N. Basov, Science 318, 1750 (2007)
- (14) M. M. Qazilbash, K. S. Burch, D. Whisler, D. Shrekenhamer, B. G. Chae, H. T. Kim, and D. N. Basov, Phys. Rev. B 74, 205118 (2006).
- (15) R. Eguchi, M. Taguchi, M. Matsunami, K. Horiba, K. Yamamoto, Y. Ishida, A. Chainani, Y. Takata, M. Yabashi, D. Miwa, Y. Nishino, K. Tamasaku, T. Ishikawa, Y. Senba, H. Ohashi, Y. Muraoka, Z. Hiroi, and S. Shin, Phys. Rev. B 78, 075115 (2008).
- (16) D. Ruzmetov, S. D. Senanayake, V. Narayanamurti, and S. Ramanathan, Phys. Rev. B 77, 195442 (2008).
- (17) L. Braicovich, G. Ghiringhelli, L. H. Tjeng, V. Bisogni, C. Dallera, A. Piazzalunga, W. Reichelt, and N. B. Brookes, Phys. Rev. B 76, 125105 (2007).
- (18) D. Ruzmetov S. D. Senanayake, and S. Ramanathan, Phys. Rev. B 75, 195102 (2007)
- (19) S. Biermann, A. Poteryaev, A. I. Lichtenstein, A. Georges, Phys. Rev. Lett. 94, 026404 (2005)
- (20) J. M. Tomczak, F. Aryasetiawan, and S. Biermann, Phys. Rev. B 78, 115103 (2008).
- (21) J. M. Tomczak, and S. Biermann, J. Phys.: Condens. Matter 19, 365206 (2007)
- (22) R. Sakuma, T. Miyake, and F. Aryasetiawan, Phys. Rev. B 78, 075106 (2008).
- (23) M. Gatti, F. Bruneval, V. Olevano, and L. Reining, Phys. Rev. Lett. 99, 266402 (2007).
- (24) V. Eyert, Ann. Phys. (Leipzig) 11, 9 (2002).
- (25) R. M. Wentzcovitch, W. W. Schulz, P. B. Allen, Phys. Rev. Lett. 72, 3389 (1994).
- (26) M. S. Laad, L. Craco, and E. Müller-Hartmann, Phys. Rev. B 73, 195120 (2006).
- (27) A. Liebsch, H. Ishida, and G. Bihlmayer, Phys. Rev. B 71, 085109 (2005).
- (28) J. B. Goodenough, Phys. Rev. 117, 1442 - 1451 (1960)
- (29) A. Zylbersztejn, N. F Mott , Phys. Rev. B 11, 4383 (1976).
- (30) A. Georges, G. Kotliar, W. Krauth, M. J. Rozenberg, Rev. Mod. Phys. 68, 13 (1996).
- (31) G. Kotliar, S. Y. Savrasov, K. Haule, V. S. Oudovenko, O. Parcollet, C. A. Marianetti, Rev. Mod. Phys. 78, 865 (2006)
- (32) O. K. Andersen, Phys. Rev. B 12, 3060 (1975).
- (33) K. Haule, Phys. Rev. B 75, 155113 (2007).
- (34) K. Okazaki, A. Fujimori and M. Onoda, J. Phys. Soc. Jpn 71, 822 (2002).
- (35) For the calculation of the plasma frequency we use the WIEN2K package. P. Blaha, K. Schwarz, G. K. H. Madsen, D. Kvasnicka, and J. Luitz, WIEN2k, An Augmented Plane Wave Plus Local Orbitals Program for Calculating Crystal Properties Vienna University of Technology, Vienna, Austria, 2001
- (36) K. Haule, C.-H. Yee, K. Kim, arXiv:0907.0195.
- (37) D. B. McWhan, M. Marezio, J. P. Remeika, P. D. Dernier , Phys. Rev. B 10, 490 (1974)
- (38) M. S. Laad, L. Craco, and E. Müller-Hartmann, Phys. Rev. B 73, 195120 (2006) and references therein.
- (39) M. Abbate, F. M. F. de Groot, J. C. Fuggle, Y. J. Ma, C. T. Chen, F. Sette, A. Fujimori, Y. Ueda, and K. Kosuge, Phys. Rev. B 43, 7263 (1991).
- (40) S. Shin, S. Suga, M. Taniguchi, M. Fujisawa, H. Kanzaki, A. Fujimori, H. Daimon, Y. Ueda, K. Kosuge, and S. Kachi, Phys. Rev. B 41, 4993 (1990).
- (41) A. J. Millis, in Strong Interactions in Low Dimensions, edited by D. Baeriswyl and L. DeGiorgi Springer Verlag, Berlin, 2004
- (42) H. W. Verleur, A. S. Barker, and C. N. Berglund, Phys. Rev. 172, 788 (1968).
- (43) J. M Tomczak and S. Biermann, Eur. Phys. Lett., 86, 37004 (2009).
- (44) J. Cao, E. Ertekin, V. Srinivasan, W. Fan, S. Huang, H. Zheng, J. W. L. Yim, D. R. Khanal, D. F. Ogletree, J. C. Grossman, and J. Wu, arXiv:0907.4769.
- (45) H. Park, K. Haule, and G. Kotliar Phys. Rev. Lett. 101, 186403 (2008).
- (46) J.P. Pouget and H. Launois, Journal de Physique 37, C4-49 (1976).
- (47) K. L. Holman, T. M. McQueen, A. J. Williams, T. Klimczuk, P. W. Stephens, H. W. Zandbergen, Q. Xu, F. Ronning, and R. J. Cava, Phys. Rev. B 79, 245114 (2009)