,
Capillary Rise and Imbibition of Liquids in Nanoporous Matrices: Rheological Concepts and Experiments
Abstract
Liquid flow propelled by capillary forces is one of the most important transport mechanisms in porous environments. It is governed by a fascinating interplay of interfacial, viscous drag as well as gravitational forces which liquids encounter upon invasion into geometries with often complex topologies, such as capillary networks of trees or interconnected fractures in soils and ice. Whereas a detailed understanding of this phenomenon has been achieved on macroscopic scales, its phenomenology is poorly explored on the meso- and nanoscale, where predictions regarding its dynamics are hampered due to a possible break-down of continuum hydrodynamics and conflicting reports with respect to the conservation of the fluidity and capillarity of liquids upon spatial confinement. Here, we present fundamentals, concepts and an experimental, gravimetric study on the capillarity-driven invasion dynamics of liquids in networks of pores a few nanometers across in monolithic, nanoporous silica glass (porous Vycor). A variation of the complexity of the building blocks of the liquids investigated (water, chain-like n-alkanes, silicon oils and rod-like liquid crystals) along with a variation of the humidity and the temperature upon spontaneous imbibition allows us to gain information regarding the fluidity and capillarity of liquids in such nanoporous environments. We observe square-root of time imbibition dynamics for all liquids applied, which we can quantitatively describe by both a conserved bulk fluidity in the pore center and bulk capillarity at the advancing menisci, if we assume a sticky boundary layer (negative velocity slip length). Moreover, pecularities of nanopore-confined liquids, such as transport via the vapor phase leading to preadsorbed liquid layers, have to be properly accounted for. Upon increasing the chain-length in the case of the n-alkanes, we found hints towards a transition from stick- to slip-flow at the pore walls with increasing chain-length and thus polymeric behavior. Meniscus freezing, that is the formation of a surfactant-like, rectified monolayer at the advancing menisci of the imbibition front, is reported for n-tetracosane confined in porous Vycor. For the rheology of a rod-like liquid nematogen (8OCB) we found no hints of the viscosity drop upon entering into the nematic phase, typical of the bulk rheology of this liquid crystal.
pacs:
47.55.nb, 47.61.-k, 87.19.rh, 47.57.Lj, 47.56.+r1 Introduction
Spontaneous imbibition, that is the capillarity-driven invasion of a liquid in porous material is a very common phenomenon. From everyday life almost everybody knows the effect of coffee or tea being absorbed by a cube of sugar. A rather unpleasant instance of being confronted with its consequences is rising moisture in your basement walls. Another well-known example is the transport of water from the roots of a tree up to its limbs, branches and leaves, which is partly driven by capillary action [1].
There has been significant progress with regard to a quantitative understanding of this phenomenon, most prominently with regard to the transport through rocks and soils, starting with the seminal work of the French engineer Henry Darcy (1803-1858) [2, 3]. Almost all experimental and theoretical studies, published to date, deal however with porous structures where the characteristic length scales, meaning the typical pore diameters, are on the macroscale, that is much larger than a typical size of the basic building blocks of the flowing liquids [4].
After a short review of, and introduction into, the imbibition phenomenology of liquids in porous media in general, we will present a study on the spontaneous imbibition of liquids in pores a few nanometers across. We will vary the complexity of the building blocks of the liquids from water to simple short-chain n-alkanes and silicon oils to rod-like liquid crystals. Examinations on the phase transition behavior of nanopore-confined liquids will be part of this study as well. The goal is to scrutinize which principles regarding the rheology of these liquids, known from the bulk state, can be safely transferred to the transport across this nano- or mesoscopic geometries.
Given the emerging interest in micro- and nanofluidic applications [5] such a study on the non-equilibrium behavior of liquids in extreme spatial confinement, on the nanometer scale, is not only of fundamental interest, but also of rather practical importance [6]. Moreover, the increasing use of nanoporous matrices as hard templates [7] for the preparation of well-defined nanoscopic, soft-matter structures, such as nanotubes and nanorods [8], necessitates a profound understanding of this phenomenology.
2 Fundamentals of liquid imbibition in nanoporous solids
2.1 Liquid flow in isotropic pore networks: Darcy‘s law
In order to introduce the fundamentals of liquid flow in nanoporous media, we start with a much simpler phenomenology: The flow of a liquid through a pipe is a prime example for the direct application of the Navier-Stokes equation resulting in the famous law of Hagen-Poiseuille. For a given pressure difference applied along a cylindrical duct with radius and length the volume flow rate is determined by
| (1) |
Here denotes the dynamic viscosity of the flowing liquid. In the following we will present a simple concept that allows one to extend the applicability of Eq. (1) to the flow through a complex pore network.
2.1.1 Characterization of a pore network
Porous Vycor glass (code 7930) provided by Corning Incorporated was used over the course of this study. It is produced through metastable phase separation in an alkali-borosilicate system followed by an extraction of the alkali-rich phase. The final glass consists of a sponge-like network of tortuous and interconnected pores with mean pore radii on the nanometer scale embedded in a matrix mostly consisting of SiO2 [9].
In general such an isotropic pore network can be characterized by three quantities. The mean pore radius and the volume porosity are probably the most intuitive ones among them. In the course of this study two different batches of the monolithic glass were applied that differed in whereas they coincided in . For convenience we will refer to them as V5 ( nm) and V10 ( nm) from now on. These matrix properties were accurately ascertained employing nitrogen sorption isotherms conducted at 77 K and through a subsequent analysis within a mean field model for capillary condensation in nano- and mesopores. More details on the matrix characterization and preparation are given in Ref. [10].
With only these two parameters a porous cuboid with edge length (and cross-sectional area ) consisting of
| (2) |
cylindrical pores with radius and length can be constructed. Assuming the capillaries to be aligned in flow direction the flow rate through the whole matrix is then given by times the single pore flow rate Eq. (1) with and . However, so far this description still lacks information on the orientation of the pores.
To account for the isotropy of the network as indicated in Fig. 1 (left) it is necessary to introduce a third parameter, the so-called tortuosity along with the transformation
| (3) |
of the volume flow rate Eq. (1). Pores totally aligned in flow direction would yield , whereas isotropic distributed pores would result in . This can be seen very easily. For a random orientation only every third pore is subjected to the pressure gradient and hence contributes to the flow. Therefore the net flow rate has to be divided by the factor three.
To date serveral techniques have been applied to extract the tortuosity of the isotropic pore network in Vycor glass. Deducing the diffusion coefficient of hexane and decane by means of small angle neutron scattering (SANS) measurements was found to be in the range of 3.4 - 4.2 [11]. Gas permeation measurements performed with an in-house apparatus resulted in [12]. Finally, calculations based on three-dimensional geometrical models yielded a value of approximately 3.5 [13].
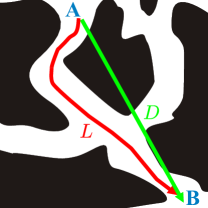
Interestingly, all values show a significant deviation from as derived from the previous considerations. Accordingly, there must be an additional aspect of the geometry that has so far been neglected. Regarding Fig. 1 (right) this issue is apparent: the pores are not straight but rather meandering. In consequence the length of the path from any point A to another point B is always larger than the length of the direct interconnection of the two points. To correct the pore length for the larger flow path an additional factor of for the tortuosity must be introduced. Assuming this consideration yields for the Vycor pore network . This result can vividly be interpreted as follows: the shortest way from the bottom of the previously introduced sample cuboid to its top is about 20 % longer than its edge length .
2.1.2 Darcy’s law
With all the preceding considerations in mind one is able to derive an expression that describes the flow of a liquid through a porous network. For a given porous matrix with cross-sectional area and thickness (along which the pressure drop is applied) the normalized volume flow rate is determined by
| (4) |
This expression is also known as Darcy’s law [14]. The proportionality constant is the so-called hydraulic permeability of the matrix. It is given by
| (5) |
At this point it must be emphasized that the permeability is solely specified by the matrix’ internal structure and consequently it should be independent of the liquid and of the temperature.
2.2 Influence of the spatial confinement
So far we have completely neglected that the mean pore diameters of the pore network investigated here are orders of magnitude smaller than characteristic in usual flow paths in common miniaturized fluid manipulating applications. Indeed, the pore radii are merely 10 to 100 times larger than typical molecular diameters of simple liquids like water. Within the systematic study of chain-like hydrocarbons, which will be presented in section 5, the dimensions of the liquid’s building blocks even exceed the channel’s diameter. For that reason it is evident that some questions about the influence of the confinement on the fluid dynamics arise. In the following the two most apparent ones will be discussed.
Though, beforehand, we will point out a remarkable feature being inherent in micro- and nanofluidic devices and applications. Because of the tiny characteristic length scales the Reynolds number
| (6) |
(with the liquid’s density ) usually fulfills . Thus, flows in such restricted geometries are most likely laminar rather than turbulent. From this point of view the implementation of the Hagen-Poiseuille law seems to be justified. But, for very high flow speeds this assumption does not remain valid. In section 2.6 it will be shown that this fact plays a crucial role in the very initial phase of a capillary rise experiment.
2.2.1 Validity of continuum mechanical theory
Up to now we have assumed the law of Hagen-Poiseuille to be valid even in pores with diameters below 10 nm. However, one must not forget that this law is based on the principles of continuum mechanical theory, in which the behavior of a fluid is determined by collective properties such as the viscosity and the surface tension . This assumption certainly holds for ensembles of molecules. But within the pore confinement such amounts are not reached. This can easily be seen in the following example. Assuming water molecules to be spheres with a radius of 1.5 Å in a hexagonal close-packed structure one arrives at only molecules per cross-sectional area. As a consequence, the validity of the continuum theory has to be put into question.
On this score especially the development of the surface force apparatus (SFA) has stimulated extensive studies over the last three decades. The mobility of water and several hydrocarbons in extremely confined films was examined by experiment [15, 16, 17] and in theory [18]. These studies revealed a remarkable robustness of the liquids’ fluidity down to nanometer and even subnanometer spatial confinement. Moreover the validity of macroscopic capillarity conceptions at the nanoscale was demonstrated [19, 20]. The measurements within this study will provide further hints whether the concepts of viscosity and surface tension still remain valid in nanopore confinement.
2.2.2 Validity of the no-slip boundary condition
The law of Hagen-Poiseuille implies the no-slip boundary condition. This means that the velocity of the fluid layers directly adjacent to the restricting walls equal the velocity of the walls themselves. Nowadays it is indisputable that this assumption does not hold unreservedly. Already 60 years ago Peter Debye and Robert Cleland introduced both slipping and sticking fluid layers at the pore walls in order to interpret a seminal experiment on liquid flow across porous Vycor [14]. In that way, they were able to quantitatively account both for increased as well as for decreased measured flow rates (compared to the predicted ones) within their examinations of the flow of hydrocarbons through porous Vycor.
The concepts of a sticking and of a slipping liquid compared to the traditional no-slip boundary condition are exemplified in Fig. 2 for a cylindrical tube with radius . The degree of slip can be quantified by the slip length with . The hydrodynamic pore radius measures the distance from the pore center to the radius where the streaming velocity reaches zero. In this representation the sticking layer boundary condition is indicated by a negative slip length whereas a positive slip length is typical of a slip boundary condition. The standard no-slip condition yields meaning .
Up to date many factors have been found that seem to influence the boundary conditions. The most prominent and maybe the least controversially discussed amongst them is the fluid-wall interaction expressed in terms of the wettability [21, 22, 23, 24, 25, 26, 27, 28, 29]. The weaker the interaction is the more likely is slip. In addition, shear rates beyond a critical value are supposed to induce slip, too [30, 31, 32, 33]. In contrast, the influence of surface roughness is rather debatable [34]. There are results for a decrease [35, 22] as well as for an increase [36] of the slip length with increasing surface roughness. Furthermore, dissolved gases [37, 38], the shape of the fluid molecules [26] or the add-on of surfactants [39] seem to influence the boundary conditions. To sum up, there is a huge set of factors (see Refs. [37, 40, 41] for some good reviews) and certainly a complex interplay between many of them finally determines the interfacial behavior.
The permeability of the membrane reflects such modified velocity boundary conditions:
| (7) |
Equation (7) illustrates the high sensitivity of on , provided is on the order of or even larger than . Therefore, measuring the hydraulic permeability gives direct access to the slip length for a given liquid under given conditions.
One has to keep in mind that boundary conditions and fluid properties derived from measured flow rates are subject to a central restriction: one cannot verify the predefined parabolic shape of the velocity profile in the nanoscopic flow geometry. This is because there is no direct access to the profile itself but only to flow rates, which correspond to the velocity profile integrated over the whole pore cross-sectional area. Nevertheless, molecular dynamics simulations prove the formation of parabolic flow profiles even down to channel radii of three molecular diameters [42, 43, 44] and, hence, justify inferences based on this major assumption.
2.3 Laplace pressure & capillary rise
From the physisist’s point of view spontaneous imbibition is an impressive example for interfacial physics. The driving force behind the capillary rise process is the Laplace pressure acting on the curved meniscus of a liquid in a pore or porous structure. It is specified by
| (8) |
with being the surface tension of the liquid and and being the local radii of curvature of the liquid surface. For that reason it is important to obtain information on the shape of the meniscus. In general it is determined by an interplay of surface forces and gravity. The influence of the latter can be estimated by means of the so-called capillary length
| (9) |
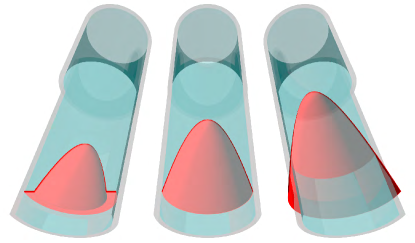
with being the acceleration due to gravity and representing the density of the liquid. For water (with and ) Eq. (9) yields a capillary length of 2.7 mm. For surfaces with characteristic lengths smaller than the gravitational force can be neglected. Therefore, in the porous structure of Vycor with mean pore diameters on the order of 10 nm the menisci are solely determined by surface forces. Consequently, they take the shape of a spherical cap (see Fig. 3) described by a unitary radius of curvature resulting in a uniform Laplace pressure at each point of the meniscus.
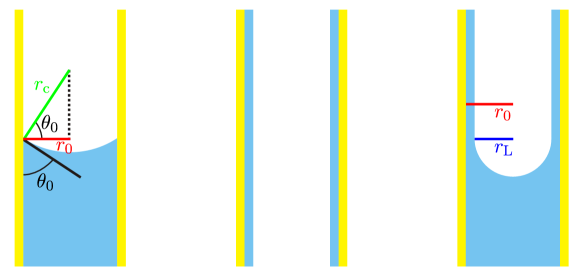
Eventually, from simple geometric considerations, one can deduce the relation between the radius of curvature and the pore radius (see Fig. 3 (left)) yielding
| (10) |
for the Laplace pressure. It is obvious that the interaction between liquid and matrix expressed in terms of the static contact angle plays a crucial role in the capillary rise process. Spontaneous imbibition can only occur for a wetting or partially wetting liquid that is a liquid whose contact angle with the matrix is smaller than 90∘. The influence of the contact angle hysteresis and a possible substitution of the dynamic contact angle for will be discussed in section 2.6.
Of course, as the liquid rises beyond its bulk reservoir to a certain level the hydrostatic pressure acting on the liquid column increases. Accordingly the driving pressure must be modified to . The final state is then derived from a balance between and [45]. The maximum rise level is given by Jurin’s law:
| (11) |
It is worthwhile calculating for water in the silica network of Vycor. Assuming ∘ for water on a glass substrate and nm Eq. (11) yields km corresponding to a Laplace pressure of 290 bar. Thus, for the here examined rise levels restricted by the maximum sample height to less than 5 cm the gravitational force can be neglected meaning that
| (12) |
The prevalence of surface forces over gravitation can likewise be expressed in terms of the dimensionless Bond number Bo:
| (13) |
because of the tiny characteristic length scales .
2.4 Influence of preadsorbed liquid layers
In order to gain information on the dynamics of the imbibition process we can now resort to Darcy’s law (Eq. (4)) discussed above. Considering Fig. 4
one is able to conclude that the sample height appearing in Darcy’s law has to be replaced by the actual rise level since only the filled parts of the sample contribute to the flow dynamics. Moreover, at any given time the imbibed fluid volume is closely related to via
| (14) |
Here denotes the initial volume porosity of the Vycor sample. This porosity is reduced with respect to because of water layers on the silica pore walls, which are immediately adsorbed under standard laboratory conditions because of the finite humidity and the highly attractive interaction between water and silica (see Fig. 3 (middle)). This wall coating amounts to a 15 % to 20 % decrease in porosity. The adsorbed water is highly stabilized and can only be removed at elevated temperatures [46].
The exact degree of coating depends on the sample temperature and the absolute humidity, thus it cannot be known beforehand. Fortunately can be extracted for each sample from the performed mass increase measurements, which will be presented later (see Fig. 8). Given the density of the imbibed liquid and the volume of the sample block one gains direct access to the initial porosity via the overall mass increase due to the liquid uptake (indicated in Fig. 8):
| (15) |
Similarly, the Laplace pressure must be influenced by the initial wall coating. The preadsorbed water layers necessarily lead to a reduction of the radius of curvature of the menisci (see Fig. 3 (right)). This effect will be taken into consideration by substituting for in Eq. (10) with . We do not have any reliable information on the layer thickness and hence on the Laplace radius . It can only be estimated from the difference between and assuming the pores to be perfect cylinders with a radius . Then enables one to estimate the upper bound Å (depending on temperature and humidity). Based on this result we will assume ÅÅ in order to account for this effect. Fortunately, the impact of on the overall imbibition dynamics is comparatively small (see Eq. (20)) and, therefore, the uncertainty in the actual Laplace radius has only little effect on the final results.
2.5 Dynamics of the imbibition process: BCLW law
With all these preliminary considerations in mind we will now return to the dynamics of the imbibition process. Darcy’s law Eq. (4) in conjunction with Eq. (14) leads to the simple differential equation
| (16) |
solved through
| (17) |
Nowadays this square root of time behavior is often referred to as the Lucas-Washburn (LW) law after its alleged discoverers [47, 48]. Actually, the -scaling was first found by Bell and Cameron [49] more than 10 years earlier [50]. Hence we will term Eq. (17) BCLW law in order to acknowledge all contributors.
Given the driving pressure in accordance to Eq. (10) and the permeability corresponding to Eq. (7) one obtains the rise level at a certain time
| (18) |
Along with Eq. (14) and the density of the liquid Eq. (18) results in
| (19) |
the mass increase of the sample due to the liquid uptake as a function of the time . The corresponding flow configuration is illustrated in Fig. 5. We introduced the imbibition strength in Eqs. (18) and (19), which is given through
| (20) |
Comparable to the hydraulic permeability it depends solely on the matrix’ internal structure.
Interestingly, relation (20) reveals that in principle the capillary rise dynamics are proportional to the square root of the capillary’s radius: . As a consequence, in common capillary rise experiments with channel diameters on the order of some hundred micron the rise dynamics are so fast that without any additional instruments merely the steady-state equilibrium configuration at the very end of the process can be observed. This is contrary to imbibition in meso- and nanoporous networks. Here, the much smaller pores induce a lot more viscous drag, which reduces the overall dynamics significantly. Typical rise times in our experiments are on the order of some hours or even days. This fact allows for an easy recording of the dynamics by measuring the sample’s mass increase as a function of the time.
2.6 Remarks on short time effects
Finally, we will outline some effects that dominate the imbibition process in its very initial phase, meaning the first few nanoseconds. However, these effects occur on time scales far beyond the temporal resolution limit of the experiment (on the order of one second) and therefore do not play a decisive role for the measurements.
2.6.1 BCLW Law in Nanopores
The BCLW law neglects inertial effects, thus it is only valid for time scales sufficient to establish viscous flow. For very short times a more general ansatz has to be applied (Bosanquet equation), which approaches the BCLW law for long times. The observed deviations from the BCLW law are possibly caused by a high degree of turbulences and initial deformations of the velocity profiles. This lasts until the flow reaches its typical low Reynolds numbers, for which turbulent flow cannot play a role at all.
The typical time that is required for the viscous flow to establish itself in the pore can be estimated with [51]
| (21) |
This typically yields times on the order of some 10 ps in high agreement with recent simulation studies [44, 52, 53, 54].
According to Ref. [55] the fluid-wall interaction, and in particular the surface friction due to molecular corrugation, additionally seem to influence . For the atomic smooth CNT is rather increased and a lengthy non-BCLW behavior can be observed. The nearly frictionless surface of the nanotubes is also supposed to be responsible for the enhanced mobility of water and hydrocarbons flowing through these tiny ducts [56, 57]. Nevertheless, this phenomenon occurs on time scales far beyond the temporal resolution limit of the experiment and does not affect our measurements at all [51, 58].
2.6.2 Dynamic contact angle
The static contact angle of a drop resting on a surface is a constant determined by an interplay of the interactions between the solid, the liquid and the vapor phase. As a rule this assumption fails if the contact line begins to move. Here, a different contact angle, the so-called dynamic contact angle is observed.
It is this dynamic contact angle that is required as a boundary condition for modeling problems in capillary hydrodynamics. In consequence, it is important to estimate the changes that arise from this effect. Unlike the static contact angle, is not a material property. Actually, for small spreading velocities expressed in terms of the capillary number Ca
| (22) |
it seems to solely be influenced by the capillary number itself [59]. This is the statement of the most widespread work relation describing the dynamic contact angle, namely the Hoffman-Voinov-Tanner law . It is valid for [58] or, with some correction, for [60]. Interestingly, Richard Hofmann carried out a systematic study of dynamic contact angles in glass capillary tubes for a wide range of capillary numbers [61] and some years later Jiang et al. gave an empirical correlation for his results [62]:
| (23) |
This expression can be used to estimate the impact of the contact angle hysteresis on the capillary rise experiments presented here. For this purpose one needs information on the prevailing capillary numbers being tantamount to the advancement speed of the liquid front. One can deduce this speed as the time derivative of Eq. (18):
| (24) |
The obvious divergence for s is again the manifestation of the deficiency of the BCLW law for very short time scales and has already been thematized in the literature [63, 51].
We obtain as the absolutely highest capillary number occuring in our experiments . Accordingly, the above approximation for low Ca Eq. (23) can be applied. With the static contact angle this finally yields the highest achievable dynamic contact angle with compared to . It is apparent that the phenomenon of the contact angle hysteresis needs no further consideration. This result agrees with MD studies of Martic et al. [64]. Indeed, they found an initial variation of for liquids sucked into channels with 5 nm radius. Nevertheless, it relaxed within some 10 ns towards what is again far beyond the temporal resolution limit of the experiment.
What is more, the contact angle remaining during the whole measurement entails an interesting side effect. In a recent lattice Boltzmann simulation Kusumaatmaja et al. [65] examined the influence of surface patterning on the capillary filling of microchannels. They found that for the structuring has only little effect on the filling process and for completely wetting liquids there is no observable influence at all. Therefore we do not have to worry about atomic irregularities of the pore shape.
3 Experimental
Imbibition dynamics are studied via a recording of the samples’ mass increase . The corresponding setup is depicted in Fig. 6. For a time-dependent measurement of the force acting on and, hence, of the mass increase of the porous Vycor block the sample is installed on standard laboratory scales applying a special mounting.
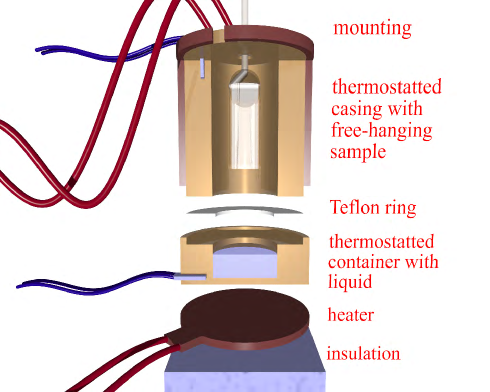
In order to perform measurements beyond room temperature a cell was constructed that allows for a simultaneous thermostatting of the sample itself and the liquid reservoir beneath.
The samples were cut into regular shapes of either cylinders (V5) or cuboids (V10) of known dimensions (cross-sectional area and height ). Prior to measurement they were stored in a desiccator to avoid the uptake of impurities from the surrounding air.
For highly volatile liquids such as water and the n-alkanes up to decane a sealing of the samples’ top and side facets is of utmost importance. Partly this is because of the possible influx of molecules via the vapor phase. However, with increasing rise level another problem gains importance, namely the evaporation from the sample. This would actually lead to a pinning of the rise level determined by a balance between the liquid supplying imbibition rate and the liquid detracting evaporation rate (see Fig. 7). For water such a sealing can very well be realized with Scotch tape. For the short-length n-alkanes a two-component adhesive was applied. For all other liquids the samples’ facets remained unsealed.
The measuring principle of the gravimetric experiments can nicely be illustrated referring to the representative mass increase measurement depicted in Fig. 8. Four distinct regimes are indicated. In the beginning the sample is put into the thermostatting cell and is mounted on the laboratory scale so that it hangs freely above the bulk reservoir. Regime (a) is now described by a mass decrease of the sample, which can be seen as the obvious manifestation of its thermalization. Due to the elevated
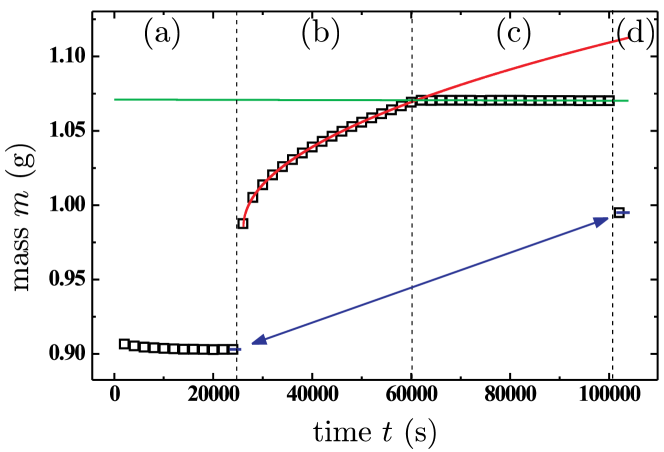
temperature (here ∘C) the sample loses a part of its preadsorbed water and accordingly gets lighter. A sufficient thermalization is then given for an adequate convergence of the mass towards .
The measurement is started by moving the cell upward until the sample touches the liquid surface. Immediately a meniscus forms along the block’s perimeter. This induces a force towards the reservoir acting on the sample, which becomes noticeable by a sudden jump in mass right at the beginning of regime (b). The connection between and the perimeter length is determined by
| (25) |
widely known from the Wilhelmy plate assembly for measuring the surface tension of a liquid. Here it enables one to quantitatively analyze the mass jump. Assuming ∘ and given the surface tension of n-tetracosane at ∘C Eq. (25) gives mN or, equivalently, an apparent mass jump of g. This is in high accordance with the measurement.
This jump is only an initial effect and can be seen as a constant offset that should not disturb the subsequent imbibition process itself. The latter is the outstanding effect in regime (b). It can be described by a -fit in accordance to Eq. (19). Thus, the -fit provides and then Eq. (19) results in the imbibition strength
| (26) |
where the initial porosity according to Eq. (15) and the bulk fluid parameters are applied. The contact angle is assumed to be 0∘ and consequently . The latter assumption was also tested experimentally and proved true for all liquids taken into consideration for this study by means of contact angle measurements.
At some point a level of saturation is entered. The deviation from the -law in regime (c) signals that the sample is completely filled. In regime (d) the sample is detached from the bulk liquid reservoir in order to extract the mass of the completely filled sample. The overall mass uptake is then .
4 Spontaneous imbibition of water in porous Vycor
| temperature | V5 | V10 |
|---|---|---|
| 25 ∘C | ||
| 40 ∘C | ||
| 60 ∘C |
Experiments on the capillary rise of water in V5 and V10 were conducted at three different temperatures (25 ∘C, 40 ∘C, and 60 ∘C). The results are summarized in Tab. 1. As predicted for the imbibition strength the obtained values are independent of the temperature . The arithmetic averages over all temperatures are for V5 and for V10. According to Eq. (20) these measured quantities correspond to hydrodynamic pore radii nm for V5 and nm for V10, or, in terms of the slip length ,
Consistently for both V5 and V10 a negative slip length of about 5 Å was found. Considering the diameter of a water molecule of approximately 2.5 Å this result can be interpreted as follows: two layers of water directly adjacent to the pore walls are immobile meaning that they are pinned and do not take part in the flow. Taking this into account (through the above-mentioned negative slip length) the imbibition dynamics can conclusively be described by the model proposed in section 2. In consequence one may conclude that the residual inner compartment of the liquid obeys classical hydrodynamics based on continuum mechanical theory. As a result, our experiments confirm former findings on the conserved fluidity [15, 16, 17] and capillarity [19, 20] of confined water – except for the pinned layers.
The assumption of the compartmentation of nanopore-confined water just stated is corroborated by recent molecular dynamics studies on the glassy structure of water boundary layers in Vycor and the expected existence of sticky boundary layers in Hagen-Poiseuille nanochannel flows for strong fluid-wall interactions [66, 67, 68, 69, 70, 71]. By means of X-ray diffraction distortions of the hydrogen-bonded network of water near silica surfaces were found [72], which might be responsible for the markedly altered liquid properties. Tip-surface measurements document a sudden increase in the viscosity by orders of magnitude in 0.5 nm proximity to hydrophilic glass surfaces [73]. It also extends former experimental results with respect to the validity of the no-slip boundary condition for water/silica interfaces, in which this condition was proven down to at least 10 nm from the surface [74] whereas slip-flow for water is only expected at hydrophobic surfaces [75, 74].
Here, it is important to highlight that a significant influence of silica dissolution in water can definitely be ruled out. The resultant aqueous electrolyte (often referred to as polywater) would of course be characterized by altered liquid properties and could therefore likewise be responsible for the observed decreased overall invasion dynamics. Nevertheless, as was pointed out in detail by Tombari et al. [76], the dissolution of silica in water for the measuring times and temperatures considered here is vanishingly small and may be neglected.
Furthermore, any by-passing material transport via the vapor phase could be excluded. According to recently conducted lattice Boltzmann simulations such condensation processes would entail a breakdown of the usual imbibition dynamics [77]. However, a significant influence of evaporation from and subsequent condensation beyond the advancing liquid front can be ruled out referring to thermodynamic argumentations [78]. Moreover, recently performed neutron radiography measurements did not only verify this prediction, but also allow us to conclude that the imbibition dynamics are only marginally affected by this transport mechanism [79].
Finally, it is worthwhile noting that water encounters a negative pressure, which linearly decreases from (on the order of some hundred bar) at the advancing menisci to atmospheric pressure at the bulk reservoir. Water’s hydrogen bridge bond network is expected to be responsible for an increase in viscosity and decrease in density under such large tensile pressures. Based on thermodynamic models for stretched water [80, 81], one may estimate a -dependent decrease in the overall dynamics due to this effect, which is, unfortunately, below the error margins. Finally, we would refer the interested reader to two more detailed publications reporting on capillary rise dynamics of water in nanoporous silica [78, 82].
5 Spontaneous imbibition of hydrocarbons in porous Vycor
The imbibition study of water in porous Vycor glass just presented reveals many aspects of the behavior of a liquid in interface-determined systems. Anyhow, these results could just as well have been obtained on a planar glass substrate, meaning that so far no effects explicitly due to the liquids’ restrictions to a cylindrical pore geometry have been reported. One might wonder whether the water molecules are too small as compared with the channel diameter to be subject to any limitations. This consideration motivates the hereinafter presented systematic study of the imbibition dynamics of chain-like hydrocarbons namely the homologous series of n-alkanes (n-CnH2n+2) and the branched hydrocarbon squalane.
The alkane molecule’s all-trans length is proportional to the number of C atoms in the chain’s backbone
| (27) |
whereas their diameter is independent of (approximately 3 Å). Hence, the alkane series allows one to easily vary the aspect ratio of the molecule, while many important liquid properties (density , surface tension , viscosity ) nearly remain the same [83]. In particular all alkanes totally wet silica. For that reason, alkanes are particularly well suitable for a systematic study of the influence of the shape of the liquids’ building blocks on the flow dynamics through channels with diameters comparable to the molecule’s length.
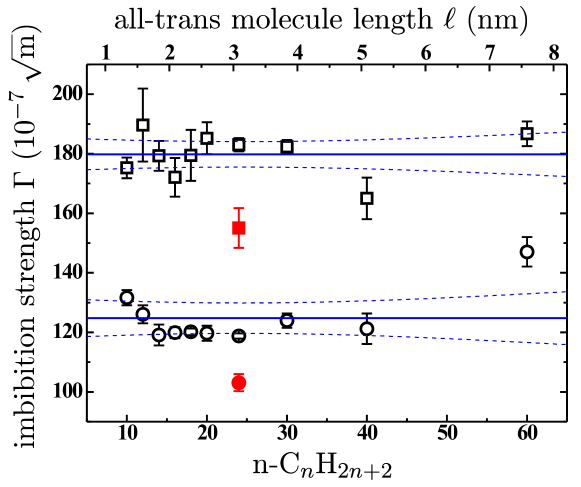
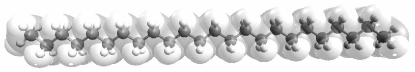
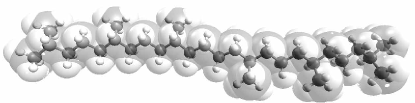
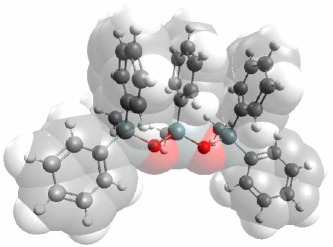
Eleven linear hydrocarbons ranging from n-decane (n-C10H22) to n-hexacontane (n-C60H122) being tantamount to all-trans molecule lengths between 1 nm and approximately 8 nm were applied. Furthermore, the branched hydrocarbon squalane (2,6,10,15,19,23-hexamethyltetracosane) with six additional methyl side groups as compared to n-tetracosane (see Fig. 9) was used. For better statistics the imbibition dynamics of each liquid/substrate combination were ascertained at least three times. The results of the study are summarized in Fig. 10. What is more, the invasion of n-hexadecane (n-C16H34) in V5 was also recorded as a function of the relative humidity (RH) of the surrounding atmosphere. For this purpose the whole setup was put into a box. Applying a humidifier the water content of the atmosphere within this housing could be increased to a maximum RH of approximately 50 %. The resultant imbibition strengths are listed in Tab. 2 together with the extracted values of the initial porosities.
Obviously the invasion dynamics are suitably described through the arithmetic averages over all measured n-alkanes for V5 and for V10. No distinct influence of the all-trans chain length on the respective n-alkane’s invasion dynamics can be detected. Only for the largest molecule n-hexacontane ( nm) in the smaller pores of V5 ( nm) hints for significant deviations from the arithmetic average towards increased overall imbibition dynamics are found . Interestingly, enhanced dynamics for long-chain molecules (mostly polymers) have already been documented in the literature [44, 32, 84] and could be ascribed to substantial slip at the liquid-substrate interface. This possibility will be addressed later on.
Again, the hydrodynamic pore radii can be deduced from the measured imbibition strengths . One attains nm for V5 and nm for V10, or in terms of the slip length
Comparable to the water measurements for both V5 and V10 a negative slip length of approximately 5 Å is found.
In this context it is worthwhile considering the impact of the pore walls’ initial water coating on the liquid invasion. According to the results presented in Tab. 2 there is no significant influence of the RH on the overall rise dynamics, provided one takes into account the initial porosity as a function of the RH. Obviously the degree of the initial water coverage does not influence the hydrocarbon invasion. This result is especially important regarding Ref. [85], in which already the presence of one to two water monolayers preadsorbed on a silica surface was found to be sufficient to considerably reduce the London force field of the glass. Nevertheless, the measured invasion dynamics prove that the modified alkane-substrate interactions do not change the wetting behavior of the hydrocarbon.
However, especially the first adsorbed water layer is highly stabilized by the attractive potential between silica and water [46]. In addition to that, a water coating on the pore walls is favored compared to an alkane coating. This is expressed by their different surface tensions and can be demonstrated by displacement measurements. Here, an initially full hydrocarbon filling in porous Vycor is replaced by a water filling through imbibition (after connecting the sample to a water reservoir). Cross checks of the sample’s mass change with the different liquid densities reveal an absolutely complete substitution of water for the alkane.
One has to assume that the imbibed hydrocarbon is not able to entirely displace the initial water coverage. At least the first layer adjacent to the pore walls should be present during the capillary rise process. This extremely immobile layer provides a first contribution of nm to the overall sticking layer thickness stated above. But there is still a residual of , which can be ascribed to either a second water layer or to a layer of flat lying hydrocarbon molecules. Thanks to their similar thicknesses one cannot distinguish between these two cases beforehand.
| RH (%) | () | |
|---|---|---|
| 24 | 0.275 | |
| 34 | 0.262 | |
| 50 | 0.245 |
Yet, the concept of a layer of flat lying hydrocarbons is confirmed by the squalane measurements, which show decreased overall invasion dynamics. The % decrease in the imbibition strength and the consequent additional reduction of the hydrodynamic pore radii [ nm for V5 and nm for V10] by nm can uniformly be explained by the larger diameter of the squalane molecule as compared with a non-branched hydrocarbon chain. The extra methyl groups attached to the n-tetracosane backbone cause an increase of the sticking layer’s thickness by a value comparable to the decrease in just mentioned. Interestingly, a similar influence of the additional side branches on the boundary conditions was already reported [26]. The continuously positive slip lengths for both n-hexadecane and squalane revealed within this FRAP study notwithstanding, was found to be always lower for the branched squalane.
Summarizing, one may assume the sticking layer to be constituted of a water layer directly adjacent to the pore walls and a contiguous layer of flat lying hydrocarbon chains whereas the innermost liquid compartment obeys classical hydrodynamics based on continuum mechanical theory. Not until the chain length of the hydrocarbon reaches the diameter of the pore the results are seemingly influenced by the respective shape of the liquids’ building blocks.
The assumption of a sticky monolayer of hydrocarbons is confirmed by forced imbibition experiments on n-alkanes in Vycor [14], by studies regarding the thinning of n-alkane films in the surface force apparatus [86, 87, 15, 88] and by molecular dynamics simulations [66, 89]. On top of this, X-ray reflectivity studies indicate strongly adsorbed, flat lying monolayers of hydrocarbons on silica [90, 91, 92, 93]. The retained viscosity of the confined alkanes was also verified by means of MD simulations [18].
With that the just stated results disagree with a series of recent publications. Especially the existence of a positive slip length of short-chain alkanes was proven several times by experiment [22, 26] as well as by simulation [94, 18], even for complete wetting and hence highly attractive liquid-substrate interaction. Interestingly, the hydrodynamic pore radius nm of n-hexacontane in V5 reveals a slip length nm, which is, admittedly, still negative. Nonetheless, it is markedly increased as compared with nm for the arithmetic average over all n-alkanes by approximately 3 Å – the thickness of the layer of flat lying hydrocarbons. This result might be interpreted as a step towards a slip boundary condition. Yet, because of the relatively large error bars it must be treated as a mere indication of altered boundary conditions.
6 Spontaneous imbibition of silicon oils in porous Vycor
So far the results on the flow of water and linear hydrocarbons in extreme spatial confinement revealed a retained fluidity and capillarity of the liquids. Considering the highly attractive interaction between fluid and substrate the verification of a sticking layer is not too surprising. Liquids slipping at a substrate are mainly observed in non-wetting configurations [75, 74, 27, 21]. Unfortunately such systems cannot be investigated by means of spontaneous imbibition, which always requires a wetting liquid.
However, applying polymeric or oily liquids also seems to facilitate the occurrence of slip at the fluid-solid interface [32]. This presumption is corroborated by a recent imbibition study of polystyrene [84]. What is more, the MD simulations carried out in Ref. [44] demonstrate a slip boundary condition for the capillary rise of a short-chain macromolecule (representative of the building blocks of silicon oil) with slip lengths on the order of 30 % of the tube radius. Therefore, when one tries to observe modified boundary conditions it will be rather promising to use such liquids.
| DC… | V5 | V10 | ||
|---|---|---|---|---|
| 704 | ||||
| 705 | ||||
For this purpose we applied the diffusion pump oils DC704 and DC705 from Dow Corning. Their main constituent is the siloxane depicted in Fig. 11 with molecular dimensions between 1 nm to 1.5 nm. They are characterized by a negligible vapor pressure and relatively high viscosities up to 200 mPas. Because of the latter the capillary rise process is substantially slowed down. The BCLW- behavior can be observed for weeks. Again, this preeminently elucidates the retained fluidity and Newtonian character of the liquid. The extracted imbibition strengths are listed in Tab. 3.
Compared to the values of water or the hydrocarbons the dynamics of the silicon oils are decreased. This is equivalently expressed in terms of the resultant slip lengths (see Tab. 3). They all indicate a sticking layer boundary condition whose thickness is approximately 1.4 nm. Interestingly this result is independent of both the sample type and the silicon oil. Thus it is not too erroneous to conclude that, again, one layer of siloxane molecules is pinned to the pore walls and does thereby substantially lower the invasion dynamics.
This result does not necessarily have to contradict the findings of the studies mentioned at the beginning [44, 32, 84]. The applied silicon oils presumably are not chain-like enough but rather block-like. Possibly this internal molecular structure is decisive for the occurrence of slip at the interface. In this regard one has to recall the increased dynamics of n-hexacontane in V5 compared to the short-chain hydrocarbons. This result stimulates future studies on more extended alkane and polymer melts with molecular weights beyond 1 .
7 Phase transitions of liquids in nanopores explored by spontaneous imbibition
In this final section the influence of the nanopore confinement on temperature induced phase transitions will be examined. Usually phase transitions are accompanied by unique variations of the fluid properties. Since the overall rise dynamics sensitively depend on these quantities one can easily detect such characteristic deviations. According to Eq. (19) the desired information is comprised in the prefactor of the observed behavior of the measured mass increase:
| (28) |
with only the quantities in the first factor depending on the temperature. Here, the slight dependence of can be neglected in the limited regions observed. Moreover, the static contact angle is zero for all . The matrix properties are -invariant and can be eliminated through normalization. Hence, by performing several imbibition measurements at different temperatures in the -range of interest a simple comparison of the prefactors might already provide an insight into the phase transition behavior of the confined liquid.
7.1 Meniscus freezing in n-tetracosane
At first we present a -dependent study of the capillary rise of the linear hydrocarbon n-tetracosane (n-C24H50) in porous Vycor. The chosen alkane exhibits a surface freezing transition at ∘C. Surface freezing is the formation of a single solid monolayer floating on the bulk melt in a -range between the bulk freezing temperature and a temperature [95, 96, 97, 98, 99]. Upon surface freezing the hydrocarbon molecules are rectified, parallel-aligned with their long axis along the surface normal, and the center of mass lattice is hexagonal, resulting in a 3 nm thick surfactant-like monolayer. The abrupt onset of surface freezing at allows one to switch on (and off) the 2D crystalline phase at the free surface by a small variation. The goal of this study is to investigate whether this particular molecular rearrangement is detectable by and how it affects the imbibition dynamics of the alkane in nanopores.
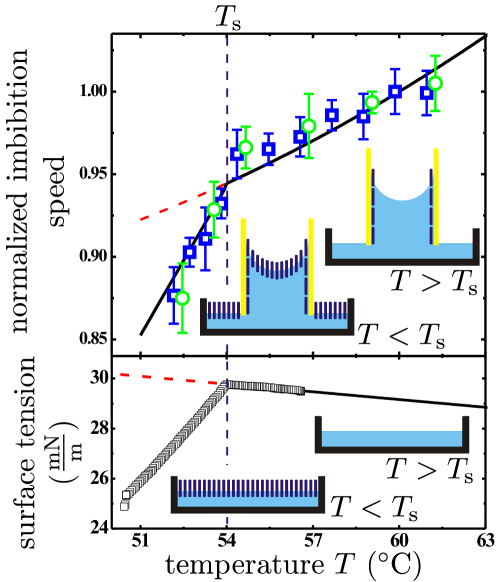
The surface freezing transition is accompanied by a distinctive signature in the behavior of the surface tension , known from bulk n-alkanes, that is a change from a small negative, above , to a large positive -slope, below (see lower panel in Fig. 12) [96]. This distinctive behavior of the surface tension must be mapped in the -dependence of the measured mass uptake.
For convenience the measured prefactors of the -imbibition dynamics are normalized by the prefactor value at an arbitrarily chosen temperature . This procedure finally yields the normalized imbibition speed of the measurement at the temperature . One should not be confused by the term ‘speed’, since is actually dimensionless. Nevertheless, it quantifies the mass uptake rate of the sample at a given temperature. According to Eq. (28) this quantity can also be calculated:
| (29) |
It is important to note that in Eq. (29) the geometry as well as the internal topology of the substrate do not play a role any longer. Assuming the kink-behavior according to Fig. 12 along with the dependency of and one can calculate theoretical values of . They are plotted as a solid line in the upper panel of Fig. 12. The measured speeds are indicated by the single points. Due to the remarkable coincidence of the temperature characteristic of the kink in and the degree of deviation from a suppressed phase transition we feel encouraged to solely attribute the distinct change in the imbibition dynamics to a change in at the advancing menisci typical of surface freezing. The corresponding nanoscopic flow configuration is illustrated in the insets of Fig. 12 for both and . We would refer the interested reader to a more detailed publication reporting on the surface freezing of n-tetracosane in nanoporous silica [100].
7.2 Flow of a rod-like liquid crystal (8OCB) in Vycor
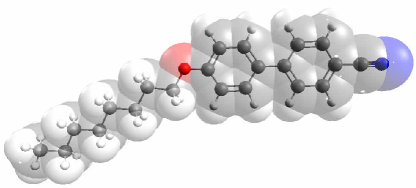
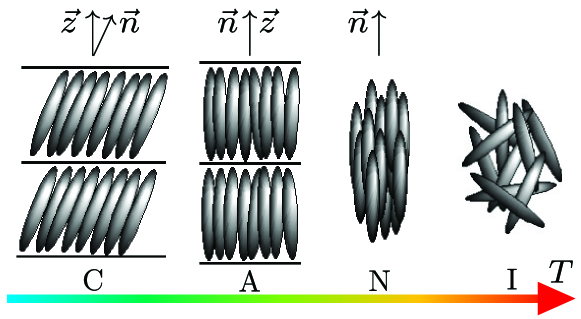
Finally, the phase transition behavior of a thermotropic liquid crystal in nanopore confinement was examined. For this purpose we applied one of the best scientifically studied liquid crystals, the rod-like octyloxycyanobiphenyl (8OCB, see Fig. 13 for an illustration of its molecular structure). At ∘C it undergoes a transition from the isotropic to a nematic phase, which is accompanied by the occurrence of a characteristic shear viscosity minimum. Again, this distinctive behavior must affect the rise dynamics which enables one to examine the phase transition in nanopore confinement. The most common phases are illustrated in Fig. 14.
7.2.1 Nemato-Hydrodynamics: Shear viscosity minimum and presmectic divergence of flowing nematic liquid crystals
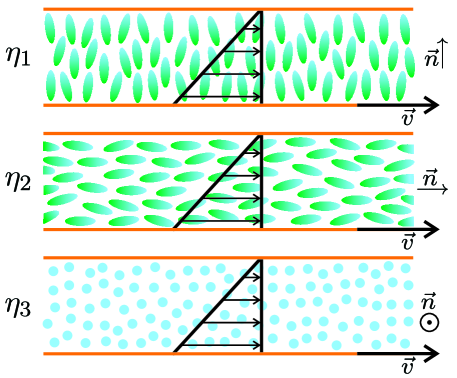
The momentum transport in nematic liquid crystals shows an anisotropy since it depends on the mutual orientations of the macroscopic molecular alignment (the director ), the flow velocity () and the velocity gradient (). In 1946 Miesowicz defined three principal shear viscosity coefficients of nematics [101], which can be measured in three different Couette flow experiments sketched in Fig. 15. Typically magnetic fields are applied in order to align the molecules in the nematic sample. Intuition suggests that the lowest resistance to the nematic flow, i.e. the lowest viscosity value, should be . Among the two remaining viscosities, should have the highest value.
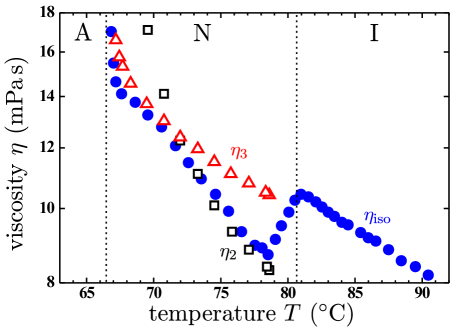
Indeed, when the orienting magnetic field, i.e. the director , is parallel to the velocity of the nematic flow, the lowest viscosity is recorded (see open symbols in Fig. 16). Nevertheless, this relatively simple picture of the viscosity of nematic liquid crystals is disturbed for the compounds exhibiting the transition to the smectic A phase. Then, with decreasing temperature, the viscosity shows a strong increase and goes to infinity at the N-A phase transition. The and viscosities are almost unaffected. At a temperature that is a few degrees below the temperature at which the transition to the smectic A phase takes place, the viscosities and interchange their roles and then the lowest nematic viscosity corresponds to the flow in the configuration. The presmectic behavior of the viscosity is due to the formation of precursors of smectic planes with that would be immediately destroyed by the velocity gradient, thus this configuration is rendered unfavorable.
The behavior of the freely flowing compound obeys a general principle that can be formulated as follows: a free fluid adopts such a manner of flow, as corresponds to the minimum of its viscosity at given conditions [103]. Accordingly, the transition from the isotropic to the nematic phase manifests itself in a strong decrease of the shear viscosity that is very close to . Consistently, beyond the presmectic cross-over of and the viscosity of the freely flowing liquid crystal follows (see filled symbols in Fig. 16). This result is interpreted in terms of rearrangements of the molecular alignment with respect to the velocity field , which can easily be assessed by means of examinations of the compound’s viscosity.
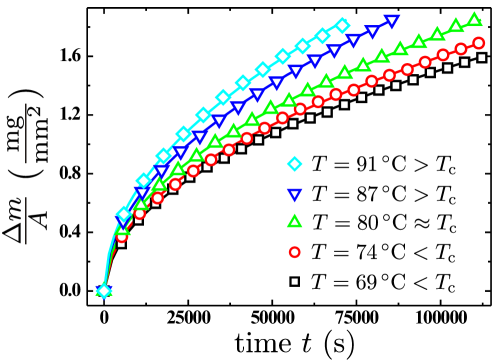
This distinctive behavior of the viscosity must be mapped in the -dependence of the measured mass uptake. In Fig. 17 some representative measurements of 8OCB invading V5 are shown along with their corresponding -fits. In analogy to the procedure employed for the evaluation of the surface freezing transition we conducted a quantitative analysis of the phase transition behavior of 8OCB in nanopore confinement referring to the prefactors obtained from the fits.
Again, the prefactors are normalized by the prefactor value at an arbitrarily chosen temperature . The thereby obtained normalized imbibition speeds calculated from the fitting parameters are indicated by the single points in the upper panel of Fig. 18. Assuming the behavior according to Fig. 16 along with the dependency of and one can calculate the theoretical values of based on Eq. (29). They are plotted as a solid line in the upper panel of Fig. 18.
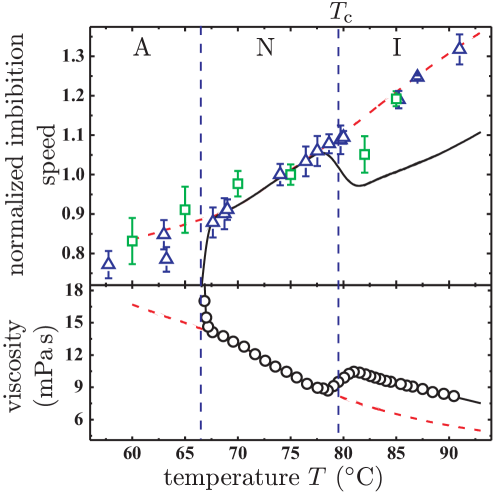
The results show a variety of astonishing features. First of all, both V5 and V10 reveal comparable characteristics of the invasion dynamics of the liquid crystal 8OCB. Anyhow, only in the nematic phase the -dependent behavior of the measured imbibition speeds coincides with the prediction based on the values presented in Fig. 16. In particular, the distinctive bump in the proximity of the clearing point as the direct manifestation of the shear viscosity minimum in the theoretical behavior of is unambiguously absent. The imbibition speed rather increases monotonously with increasing temperature.
As mentioned before this distinctive feature of the viscosity at the clearing point is caused by the inset of an alignment of the molecules (in the nematic phase) with respect to the flow direction, that is . Therefore its absence can intuitively be interpreted in terms of an already existent alignment of the molecules beyond . It is obvious to conclude that such an alignment is easily induced by the extreme spatial confinement to cylindrical pores with diameters that are not more than five times the length of the molecule itself. In addition, considering their rigidity and, in particular, the parabolic flow profile established in the pore, it is hard to think of any alternative to the tendency of molecular alignment parallel to the pore axis and, consequently, to the flow velocity . From this point of view the absence of the shear viscosity minimum and, consistently, of the nematic to isotropic phase transition is not surprising at all but rather consequent. In this context it is more suitable to label the phase beyond the clearing point not isotropic but paranematic (P). This term preeminently discloses the solely confinement-induced alignment of the liquid crystal.
It was demonstrated experimentally [104, 105, 106, 107, 108], in agreement with expectations from theory [109, 110, 111], that there is no ‘true’ I-N transition for liquid crystals confined in geometries spatially restricted in at least one direction to a few nanometers. The anchoring at the confining walls, quantified by a surface field, imposes a partially orientational, that is, a partially nematic alignment of the confined liquid crystal, even at temperatures far above the clearing point . The symmetry breaking does not occur spontaneously, as characteristic of a genuine phase transition, but is enforced over relevant distances by the interaction with the walls.
The assumption of such a paranemtic phase is corroborated by recent birefringence measurements of liquid crystals confined to an array of parallel, nontortuous channels of 10 nm mean diameter and 300 µm length in a monolithic silica membrane [112]. These measurements elucidate that the surface anchoring fields render the bulk discontinuous I-N transition to a continuous P-N transition. The transition temperature is found to be changed only marginally, due to a balance of its molecular alignment induced upward and its quenched disorder (attributable to wall irregularities) induced downward shift. This agrees with the observations of liquid crystals imbibed in tortuous pore networks [104, 105].
Interestingly, due to the complete absence of the shear viscosity minimum in the results of the -dependent series of imbibition measurements shown in Fig. 18 a definition of a P-N transition temperature in confinement is not possible at all. This is confirmed by a simple extrapolation of the viscosity to higher , which saliently reproduces the measured imbibition speeds beyond the bulk clearing point. This can only be interpreted in terms of an extremely high degree of orientation already existent in the paranematic phase; at least higher than suggested by the birefringence measurements [112]. This difference is most probably due to the basically differing detection method of the P-N transition: normally birefringence or calorimetry (DSC) measurements performed with the confined static liquid are applied for this purpose. But, the viscosity measurements presented here refer to the liquid’s dynamics in nanopore confinement. As already mentioned before, the additional emerging flow velocity and in particular the velocity gradient seemingly enhance the paranematic orientational alignment in the -configuration significantly.
The second remarkable feature of the results presented in Fig. 18 is the absence of the presmectic divergence of the viscosity of the freely flowing liquid crystal. This would result in a dramatic drop of the imbibition speed due to the inset of smectic layering. However, the measured values do not indicate such an effect. Its absence rather suggests a suppression of the A phase in favor of the N phase. This is elucidated by a simple extrapolation of the viscosity to lower as indicated in Fig. 18, which preeminently reproduces the measured imbibition speeds.
What are the reasons for this discovery? First of all, the confinement to a cylindrical pore (rather than to a film geometry like in the Couette flow depicted in Fig. 15) renders the viscosity as unfavorable as the viscosity. This again clarifies the high stability of the nematic -configuration in confinement. A cross-over behavior as ascertained for the freely flowing bulk liquid can hence be excluded. Yet, the presmectic divergence of is caused by the destruction of precursors of smectic planes for . From this point of view the suppression of the A phase is not surprising at all but a mere consequence of the overall stabilization of the -configuration in the nanopore confinement.
Even the static nanopore-confined liquid crystal shows such modified mesophase behavior [106]. For example the heat capacity anomaly typical of the second-order N-A transition in rod-like liquid crystals immersed in aerogels is absent or greatly broadened [113, 114]. Nuclear magnetic resonance (NMR) measurements revealed the lack of pretransitional smectic layering due to the rough surface of the confining walls [115]. Furthermore, a systematic study of the influence of the degree of confinement indicates that the N-A transition becomes progressively suppressed with decreasing pore radius whereas the stability range of the nematic phase is increased [116].
Finally, we will present some results from a more quantitative analysis of the measurements. According to the previously used evaluation method one arrives at slip lengths of nm for V5 and nm for V10. Again, a sticking layer boundary condition has to be applied.
In conclusion the -dependent imbibition measurements of the liquid crystal 8OCB revealed that confinement plays a similar role as an external magnetic field for a spin system: the strong first-order I-N transition is replaced by a weak first-order or continuous paranematic to nematic transition, depending on the strength of the surface orientational field [117]. Based on detailed knowledge of the static (equilibrated) liquid’s behavior in the nanopores as deduced from previously conducted birefringence experiments, we were able to procure complementary results with respect to its dynamic (non-equilibrium) behavior. The additional emerging flow velocity and in particular the velocity gradient enhance the paranematic orientational alignment significantly rendering the P-N transition even broader than known from the equilibrium state. Due to the high stabilization of the -configuration in the N phase the A phase is suppressed and the stability range of the nematic phase is increased. Nevertheless, despite the molecular alignment no indications of velocity slip were found.
8 Conclusions
We have presented a gravimetric study on spontaneous imbibition of a series of molecular liquids as a function of the complexity of their basic building blocks. By thoroughly accounting for the influence of preadsorbed liquid layers this method allowed us to gain insights regarding the flow properties and the phase transition behavior of these systems in extreme spatial confinement. We inferred from our studies an interfacial boundary layer adjacent to the pore walls with a defined thickness whose dynamics are mainly determined by the interaction between liquid and substrate. This manifests itself in terms of a negative velocity slip length for all but a few (more polymer-like) molecular systems investigated here. The flow properties of the pore-condensed molecules in the pore center are, however, remarkable robust, that is bulk-like. This finding of two distinct species (with regard to flow dynamics) is reminiscent of the partitioning of pore condensates found in vapour sorption isotherms (film-condensed versus capillary-condensed state) [118], of the two species often reported in studies on self-diffusions dynamics (slowed-down or increased self-diffusion versus bulk dynamics) [119, 120, 121, 122], of the effects of pore condensates on the deformation of the matrix (expansion versus contraction of the pore walls upon change from film-condensed to capillary-condensed state) [123]. Last but not least, it reminds of the distinct crystallization behaviour of pore condensates (an amorphous boundary layer versus a crystallized fraction of molecules in the pore center) [118]. In principle, this partitioning, but also the highly stabilized nematic phase of a confined liquid crystal, can be traced to the strong influence of the substrate potential on the liquid or solid layers, respectively, right adjacent to the pore walls [124, 125, 126]. Thus, from a more general perspective, our study highlights that this interaction is not only of importance for an understanding of the equilibrium properties of nanopore-confined condensed matter [127, 128], but also for the non-equilibrium, flow properties of the molecular assemblies studied here.
For the future the investigation of even more complex molecules and macromolecules such as proteins in mesopores may be envisioned and of interest [129, 84]. Moreover a variation of the substrate species, e.g. a change from porous silica to readily available porous silicon [130], porous alumina, porous gold [131, 132, 133] or carbon nanotube [57, 56, 134] membranes, and a modification of the pore wall chemistry, and the resulting change in the liquid/substrate interaction could lead to quite new imbibition phenomenologies. For such studies the concepts and findings presented here may set the stage for a better understanding.
Acknowledgments
It is a great pleasure to thank Andriy Kityk, Klaus Knorr, Dirk Wallacher, and Howard A. Stone for stimulating discussions. Financial support by the DFG under grants Hu850/2 (1-2) within the priority program ‘Nano- and Microfluidics’ is acknowledged.
References
References
- [1] Koch G W, Sillett S C, Jennings G M and Davis S D 2004 Nature 428 851–854
- [2] Sahimi M 1993 Rev. Mod. Phys. 65 1393
- [3] Mecke K and Arns C H 2005 J. Phys.: Condens. Matter 17 S503
- [4] Alava M, Dube M and Rost M 2004 Adv. Phys. 53 83
- [5] Sparreboom W, van den Berg A and Eijkel J C T 2009 Nat. Nanotechnol. 4 713
- [6] Eijkel J C T and van den Berg A 2005 Microfluid. Nanofluid. 1 249
- [7] Thomas A, Goettmann F and Antonietti M 2008 20 738
- [8] Luo Y, Lee S K, Hofmeister H, Steinhart M and G sele U 2004 Nano Lett. 4 143
- [9] Elmer T H 1992 Porous and reconstructed glasses (Engineered Materials Handbook vol 4) (Materials Park, OH: ASM International) p 427
- [10] Gruener S 2010 Rheology and Dynamics of Simple and Complex Liquids in Mesoporous Matrices Ph.D. thesis Saarland University Saarbr cken, Germany
- [11] Lin M Y, Abeles B, Huang J S, Stasiewski H E and Zhang Q 1992 Phys. Rev. B 46 10701
- [12] Bommer S 2008 Gas- und Proteinpermeabilit tsmessungen an biomimetischen Festk rpermembranen Diploma thesis Saarland University Saarbr cken, Germany
- [13] Crossley R A, Schwartz L M and Banavar J R 1991 Appl. Phys. Lett. 59 3553
- [14] Debye P and Cleland R L 1959 J. Appl. Phys. 30 843
- [15] Israelachvili J 1986 J. Colloid Interface Sci. 110 263 URL http://dx.doi.org/10.1016/0021-9797(86)90376-0
- [16] Horn R G, Smith D T and Haller W 1989 Chem. Phys. Lett. 162 404
- [17] Raviv U, Laurat P and Klein J 2001 Nature 413 51–54
- [18] Gupta S A, Cochran H D and Cummings P T 1997 J. Chem. Phys. 107 10335
- [19] Fisher L R, Gamble R A and Middlehurst J 1981 Nature 290 575
- [20] Fradin C, Braslau A, Luzet D, Smilgies D, Alba M, Boudet N, Mecke K and Daillant J 2000 Nature 403 871–874
- [21] Barrat J L and Bocquet L 1999 Phys. Rev. Lett. 82 4671
- [22] Pit R, Hervet H and Leger L 2000 Phys. Rev. Lett. 85 980
- [23] Cieplak M, Koplik J and Banavar J R 2001 Phys. Rev. Lett. 86 803
- [24] Tretheway D C and Meinhart C D 2002 Phys. Fluids 14 L9–L12
- [25] Cho J H J, Law B M and Rieutord F 2004 Phys. Rev. Lett. 92 166102
- [26] Schmatko T, Hervet H and Leger L 2005 Phys. Rev. Lett. 94 244501
- [27] Fetzer R and Jacobs K 2007 Langmuir 23 11617
- [28] Voronov R S, Papavassiliou D V and Lee L L 2008 Ind. Eng. Chem. Res. 47 2455
- [29] Maali A, Cohen-Bouhacina T and Kellay H 2008 Appl. Phys. Lett. 92 053101
- [30] Zhu Y and Granick S 2001 Phys. Rev. Lett. 87 096105
- [31] Craig V S J, Neto C and Williams D R M 2001 Phys. Rev. Lett. 87 054504
- [32] Priezjev N V and Troian S M 2004 Phys. Rev. Lett. 92 018302
- [33] Priezjev N V 2007 Phys. Rev. E 75 051605
- [34] Vinogradova O I and Yakubov G E 2006 Phys. Rev. E 73 045302(R)
- [35] Zhu Y and Granick S 2002 Phys. Rev. Lett. 88 106102
- [36] Bonaccurso E, Butt H J and Craig V S J 2003 Phys. Rev. Lett. 90 144501
- [37] Granick S, Zhu Y X and Lee H 2003 Nat. Mater. 2 221
- [38] Dammer S M and Lohse D 2006 Phys. Rev. Lett. 96 206101
- [39] Cheikh C and Koper G 2003 Phys. Rev. Lett. 91 156102
- [40] Lauga E, Brenner M P and Stone H A 2006 Handbook of Experimental Fluid Dynamics (New York: Springer) chap 15 Microfluidics: The No-Slip Boundary Condition
- [41] Neto C, Evans D R, Bonaccurso E, Butt H J and Craig V S J 2005 Rep. Prog. Phys. 68 2859
- [42] Todd B D and Evans D J 1995 J. Chem. Phys. 103 9804 ISSN 0021-9606
- [43] Travis K P, Todd B D and Evans D J 1997 Phys. Rev. E 55 4288 ISSN 1063-651X
- [44] Dimitrov D I, Milchev A and Binder K 2007 Phys. Rev. Lett. 99 054501
- [45] Caupin F, Cole M W, Balibar S and Treiner J 2008 Europhys. Lett. 82 56004
- [46] Wallacher D 1997 FT-Infrarot-Untersuchungen an Stickstoff absorbiert in nanopor sen Gl sern Diploma thesis Saarland University Saarbr cken, Germany
- [47] Lucas R 1918 Kolloid Zeitschrift 23 15
- [48] Washburn E W 1921 Phys. Rev. 17 273
- [49] Bell J M and Cameron F 1906 J. Phys. Chem. 10 658
- [50] Reyssat M, Courbin L, Reyssat E and Stone H A 2008 J. Fluid Mech. 615 335
- [51] de Gennes P G, Brochard-Wyart F and Quere D 2004 Capillarity and Wtting Phenomena: Drops, Bubbles, Pearls, Waves (New York: Springer)
- [52] Supple S and Quirke N 2003 Phys. Rev. Lett. 90 214501
- [53] Supple S and Quirke N 2004 J. Chem. Phys. 17 8571
- [54] Gelb L D and Hopkins A C 2002 Nano Lett. 2 1281
- [55] Whitby M and Quirke N 2007 Nat. Nanotechnol. 2 87
- [56] Majumder M, Chopra N, Andrews R and Hinds B J 2005 Nature 438 44
- [57] Holt J K, Park H G, Wang Y M, Stadermann M, Artyukhin A B, Grigoropoulos C P, Noy A and Bakajin O 2006 Science 312 1034
- [58] Ralston J, Popescu M and Sedev R 2008 Annu. Rev. Mater. Res. 38 23–43
- [59] Latva-Kokko M and Rothman D H 2007 Phys. Rev. Lett. 98 254503
- [60] Wang X D, Peng X F and Wang B X 2006 Heat Trans. Asian Res. 35 1
- [61] Hofmann R L 1975 J. Colloid Interface Sci. 50 228
- [62] Jiang T S, Oh S G and Slattery J C 1979 J. Colloid Interface Sci. 69 74
- [63] Zhmud B V, Tibert F and Hallstensson K 2000 J. Colloid Interface Sci. 228 263
- [64] Martic G, Gentner F, Seveno D, Coulon D, DeConinck J and Blake T D 2002 Langmuir 18 7971
- [65] Kusumaatmaja H, Pooley C M, Girado S, Pisignano D and Yeomans J M 2008 Phys. Rev. E 77 067301
- [66] Heinbuch U and Fischer J 1989 Phys. Rev. A 40 1144
- [67] Ricci M A, Bruni F, Gallo P, Rovere M and Soper A K 2000 J. Phys.: Condens. Matter 12 A345–A350
- [68] Gallo P, Rovere M and Spohr E 2000 Phys. Rev. Lett. 85 4317
- [69] Vichit-Vadakan W and Scherer G W 2000 J. Am. Ceram. Soc. 83 2240
- [70] Gallo P, Ricci M A and Rovere M 2002 J. Chem. Phys. 116 342
- [71] Castrillon S R V, Giovambattista N, Aksay I A and Debenedetti P G 2009 J. Phys. Chem. B 113 1438–1446
- [72] Fouzri A, Dorbez-Sridi R and Oumezzine M 2002 J. Chem. Phys. 116 791–797
- [73] Li T D, Gao J, Szoszkiewicz R, Landman U and Riedo E 2007 Phys. Rev. B 75 115415
- [74] Lasne D, Maali A, Amarouchene Y, Cognet L, Lounis B and Kellay H 2008 Phys. Rev. Lett. 100 214502
- [75] Vinogradova O I 1999 Int. J. Miner. Process. 56 31
- [76] Tombari E, Salvetti G, Ferrari C and Johari G P 2005 J. Chem. Phys. 122 104712
- [77] Pooley C M, Kusumaatmaja H and Yeomans J M 2009 Eur. Phys. J. Special Topics 171 63
- [78] Gruener S, Hofmann T, Wallacher D, Kityk A V and Huber P 2009 Phys. Rev. E 79 067301
- [79] Gruener S, Hermes H E, Egelhaaf S U and Huber P (to be published)
- [80] Stanley H E, Barbosa M C, Mossa S, Netz P A, Sciortino F, Starr F W and Yamada M 2002 Physica A 315 281
- [81] Tanaka H 2000 Europhys. Lett. 50 340
- [82] Huber P, Gruener S, Schaefer C, Knorr K and Kityk A V 2007 Eur. Phys. J. Special Topics 141 101
- [83] Small D M (ed) 1986 The physical chemistry of lipids: From alkanes to phospholipids Handbook of Lipid Research (New York: Plenum Press)
- [84] Shin K, Obukhov S, Chen J T, Huh J, Hwang Y, Mok S, Dobriyal P, Thiyagarajan P and Russell T P 2007 Nat. Mater. 6 961
- [85] Dorris G M and Gray D G 1981 J. Phys. Chem. 85 3628
- [86] Chan D Y C and Horn R G 1985 J. Chem. Phys. 83 5311 ISSN 0021-9606
- [87] Christenson H K, Horn R G and Israelachvili J N 1982 J. Colloid Interface Sci. 88 79 ISSN 0021-9797
- [88] Georges J M, Millot S, Loubet J L and Tonck A 1993 J. Chem. Phys. 98 7345 ISSN 0021-9606
- [89] Cui S T, Cummings P T and Cochran H D 2001 J. Chem. Phys. 114 7189
- [90] Mo H D, Evmenenko G and Dutta P 2005 Chem. Phys. Lett. 415 106 ISSN 0009-2614
- [91] Basu S and Satija S K 2007 Langmuir 23 8331 ISSN 0743-7463
- [92] del Campo V, Cisternas E, Taub H, Vergara I, Corrales T, Soza P, Volkmann U G, Bai M, Wang S K, Hansen F Y, Mo H and Ehrlich S N 2009 Langmuir 25 12962
- [93] Lu L B, Zander K J and Cai Y G 2010 Langmuir 26 5624
- [94] Stevens M J, Mondello M, Grest G S, Cui S T, Cochran H D and Cummings P T 1997 J. Chem. Phys. 106 7303 ISSN 0021-9606
- [95] Earnshaw J C and Hughes C J 1992 Phys. Rev. A 46 R4494 ISSN 1050-2947
- [96] Ocko B M, Wu X Z, Sirota E B, Sinha S K, Gang O and Deutsch M 1997 Phys. Rev. E 55 3164–3182
- [97] Sirota E B, Wu X Z, Ocko B M and Deutsch M 1997 Phys. Rev. Lett. 79 531 ISSN 0031-9007
- [98] Wu X Z, Ocko B M, Sirota E B, Sinha S K, Deutsch M, Cao B H and Kim M W 1993 Science 261 1018
- [99] Wu X Z, Sirota E B, Sinha S K, Ocko B M and Deutsch M 1993 Phys. Rev. Lett. 70 958
- [100] Gruener S and Huber P 2009 Phys. Rev. Lett. 103 174501
- [101] Miesowicz M 1946 Nature 158 261
- [102] Graf H H, Kneppe H and Schneider F 1992 Mol. Phys. 77 521
- [103] Jadzyn J and Czechowski G 2001 J. Phys.: Condens. Matter 13 L261
- [104] Iannacchione G S, Crawford G P, Zumer S, Doane J W and Finotello D 1993 Phys. Rev. Lett. 71 2595
- [105] Dadmun M D and Muthukumar M 1993 J. Chem. Phys. 98 4850
- [106] Iannacchione G S and Finotello D 1994 Phys. Rev. E 50 4780
- [107] Crandall K A, Rosenblatt C and Aliev F M 1996 Phys. Rev. E 53 636
- [108] Cloutier S G, Eakin J N, Guico R S, Sousa M E, Crawford G P and Xu J M 2006 Phys. Rev. E 73 051703
- [109] Sheng P 1976 Phys. Rev. Lett. 37 1059
- [110] Steuer H, Hess S and Schoen M 2004 Phys. Rev. E 69 031708
- [111] Cheung D L and Schmid F 2006 Chem. Phys. Lett. 418 392
- [112] Kityk A V, Wolff M, Knorr K, Morineau D, Lefort R and Huber P 2008 Phys. Rev. Lett. 101 187801
- [113] Bellini T, Radzihovsky L, Toner J and Clark N A 2001 Science 294 1074
- [114] Qian S, Iannacchione G S and Finotello D 1998 Phys. Rev. E 57 4305
- [115] Ondris-Crawford R J, Crawford G P, Doane J W and Zumer S 1993 Phys. Rev. E 48 1998
- [116] Kutnjak Z, Kralj S, Lahajnar G and Zumer S 2003 Phys. Rev. E 68 021705
- [117] Stark H 2002 Phys. Rev. E 66 032701
- [118] Huber P and Knorr K 1999 Phys. Rev. B 60 12657
- [119] Baumert J, Asmussen B, Gutt C and Kahn R 2002 J. Chem. Phys. 116 10869
- [120] Koppensteiner J, Schranz W and Puica M R 2008 Phys. Rev. B 78 054203
- [121] Kusmin A, Allgaier J, Richter D, Gruener S, Henschel A, Huber P and de Souza N (submitted)
- [122] Kusmin A, Allgaier J, Richter D, Gruener S, Henschel A, Huber P and Holderer O (to be published)
- [123] Guenther G, Prass J, Paris O and Schoen M 2008 Phys. Rev. Lett. 101 086104
- [124] Scheidler P, Kob W and Binder K 2000 Europhys. Lett. 52 277
- [125] Scheidler P, Kob W and Binder K 2002 Europhys. Lett. 59 701
- [126] Klapp S L and Schoen M 2002 J. Chem. Phys. 117 8050
- [127] Knorr K, Huber P and Wallacher D 2008 Zeitschrift f r Physikalische Chemie 222 257
- [128] Alba-Simionesco C, Coasne B, Dosseh G, Dudziak G, Gubbins K E, Radhakrishnan R and Sliwinska-Bartkowiak M 2006 J. Phys.: Condens. Matter 18 R15
- [129] Krutyeva M, Martin J, Arbe A, Colmenero J, Mijangos C, Schneider G J, Unruh T, Su Y X and Richter D 2009 J. Chem. Phys. 131 174901
- [130] Gruener S and Huber P 2008 Phys. Rev. Lett. 100 064502
- [131] Liu L, Lee W, Huang Z, Scholz R and G sele U 2008 Nanotechnology 19 335604
- [132] Kramer D, Viswanath R N and Weissm ller J 2004 Nano Lett. 4 793
- [133] Biener J, Wittstock A, Zepeda-Ruiz L A, Biener M M, Zielasek V, Kramer D, Viswanath R N, Weissm ller J, B umer M and Hamza A V 2009 Nat. Mater. 8 47
- [134] Hummer G, Rasaiah J C and Noworyta J P 2001 Nature 414 188