The Swift-BAT hard X-ray sky monitoring unveils the orbital period of the HMXB IGR J16493–4348
Abstract
IGR J16493–4348 is a supergiant high mass X-ray binary discovered by INTEGRAL in 2004. The source is detected at a significance level of standard deviations in the Swift-BAT survey data collected during the first 54 months of the Swift mission. The timing analysis reveals an orbital period of 6.78 days and the presence of a full eclipse of the compact object. The dynamical range (variability up to a factor 20) observed during the BAT monitoring suggests that IGR J16493–4348 is a wind-fed system. The derived semi-major axis of the binary system is with an orbit eccentricity lower than 0.15.
keywords:
X-rays: binaries – X-rays: individual: IGR J164934348. Facility: Swift1 Introduction
The IBIS/ISGRI telescope (Ubertini et al., 2003; Lebrun et al., 2003) on board the INTEGRAL satellite (Winkler et al., 2003) has detected a large number of new supergiant high mass X-ray binaries (sgHMXB) characterized by a high absorption column (N cm2) and/or by fast bright transient events. This result was achieved thanks to a continuous monitoring of the Galactic plane with deep exposure of the Galactic centre and thanks to a combination of ISGRI large field of view, good sensitivity, and wide energy range. The fourth IBIS/ISGRI survey catalogue (Bird et al., 2010) reports the discovery of 32 new objects that have been classified as HMXB and 84 unidentified sources with a Galactic latitude .
The Burst Alert Telescope (BAT, Barthelmy et al., 2005) on board Swift (Gehrels et al., 2004) has been performing a continuous monitoring of the sky in the hard X-ray energy range (15–150 keV) since November 2004. The telescope, thanks to its large field of view (1.4 steradian half coded) and its pointing strategy, covers a fraction between 50% and 80% of the sky every day. This has allowed the detection of many of the new INTEGRAL HMXBs (e.g. Cusumano et al., 2010) and the collection of their long term light curves and of their spectral energy distributions. The long and continuous monitoring of these sources allows to investigate the intrinsic emission variability, to search for long periodicities (orbital periods) and to discover the presence of eclipse events. The role of Swift-BAT is therefore fundamental to unveil the nature and the geometry of these binary systems.
In this Letter we analyze the soft and hard X-ray data collected by Swift on IGR J16493–4348. This source was discovered by INTEGRAL in 2004 (Bird et al., 2004) and it was initially associated with the radio pulsar PSR J1649–4349 because of a spatial coincidence. A later INTEGRAL observation with a deep exposure allowed to reduce the positional uncertainty and to reject the pulsar association (Grebenev et al., 2005). A follow-up observation with Chandra found a soft X-ray counterpart at RA(J2000) = 16h 49m 26.92s; Dec(J2000) = -43∘ 49’ 8.96” (Kuiper et al., 2005) allowing the optical association with 2MASS J1642695–4349090, a B0.5 Ib supergiant (Nespoli, Fabregat, & Mennickent, 2008). The Chandra observation also revealed strong evidence for variability. The IGR J16493–4348 energy distribution extracted from two RXTE observations (Markwardt, Swank,& Smith, 2005) was modeled with a highly absorbed power law (N cm-2) with a photon index of 1.4 and a 20–40 keV flux of 2.1 erg cm-2 s-1. A spectral analysis using non simultaneous data from Swift-XRT and INTEGRAL (Hill et al., 2008) showed the presence of a cutoff at keV. The information derived from the X-ray observations and the identification of the spectral type of the optical counterpart allowed the classification of IGR J16493–4348 as a supergiant High Mass X-ray Binary (sgHMXB).
This Letter is organized as follows. Section 2 describes the data reduction. Section 3 reports on the timing analysis and in Sect. 4 we discuss our results.
2 Data Reduction
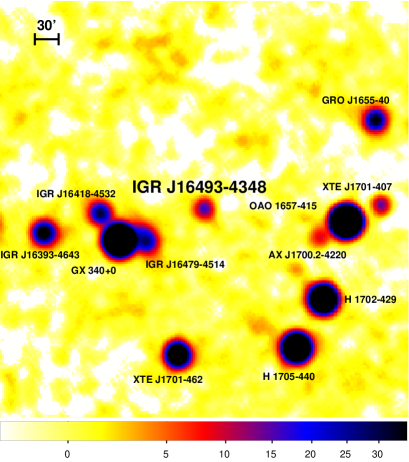
The raw BAT survey data of the first 54 months of the Swift mission were retrieved from the HEASARC public archive111http://heasarc.gsfc.nasa.gov/docs/archive.html and processed with a dedicated software (Segreto et al., 2010), that performs screening, mosaicking and source detection on BAT data and produces spectra and light curves for any given sky position. Figure 1 shows the 15–50 keV significance sky map (exposure time of 17.7 Ms, duty cycle 13%) centered in the direction of IGR J164934348. The source is clearly detected at a significance of 20.8 standard deviations. The light curve of IGR J16493–4348 was extracted in the 15–50 keV energy range with the maximum available time resolution ( s), subtracting the contamination of the nearby sources as detailed in Segreto et al. (2010). The time tag of each bin, defined as the central time of the bin interval, was corrected to the Solar system barycentre (SSB) by using the task EARTH2SUN.
We also re-analyzed the data of the Swift-XRT (Burrows et al., 2005) IGR J16493–4348 observation performed on 2006 March 11 (ObsId 00030379002), for a total exposure time of 5.6 ks. The data were processed with standard procedures (xrtpipeline v.0.12.4), filtering and screening criteria, using ftools in the heasoft package (v 6.8). The source was observed in Photon Counting mode (Hill et al., 2004) that provides a time resolution of 2.5 s.
We adopted standard grade filtering 0–12. The source events were extracted from a circular region of 20 pixels radius (1 pixel=2.36”) centered on the source position as determined with xrtcentroid. The event arrival times were converted to the SSB with the task barycorr.


3 Timing analysis
3.1 BAT survey data
The average count rate in the BAT light curve is count s-1. When considering the light curve at the highest resolution the maximum of the deviation from the average rate is about , corresponding to an increase in rate of a factor .
We analyzed the long term BAT light curve to search for intensity modulations by applying a folding technique and searching in the 0.5–100 d period range. The period resolution (Buccheri & Sacco, 1985) is given by P, where is the number of trial profile phase bins, and 140,213,639.0 s is the data time span. The average rate in each phase bin was evaluated by weighting the light curve rates by the inverse square of the corresponding statistical error
| (1) |
where is the average rate in the j-th phase bin of the trial profile, are the rate of the light curve whose phase fall into the j-th phase bin and are the corresponding statistical errors. The error on is . The weighting procedure was adopted to deal with the large span of and it is justified because the BAT data are background dominated.
Figure 2 (a) shows the periodogram where several features emerge. The highest feature, with a value of , is P d, where the error is evaluated as the standard deviation of the gaussian that best fits the values around the P0 peak with . We also see other evident features at periods multiple of P0 (2P0, 3P0, 4P0, 5P0 in Fig. 2). The pulsed profile (Fig. 2, b) folded at P0 with Tepoch=54173.757 MJD, shows a flat intensity level, abruptly broken by a deep full eclipse. The phase coverage of the light curve bins (Fig. 2, c) shows that this dip is not due to an accidental under-sampling of the light curve at these phases. The centroid of the eclipse, evaluated by fitting the data around the dip with a Gaussian model, is at phase corresponding to TP0 MJD.
As a consequence of the time variability of the source and of the presence of a periodic signal, the average in the periodogram is far from the average value expected for white noise and the statistics cannot be applied to evaluate the significance of the detected periodicity. Therefore, we applied two alternative methods to evaluate the significance of P0.
-
1.
We fit the periodogram with a second order polynomial [Fχ(P)] and subtracted the trend from the distribution. The value of z=-Fχ(P) at P0 is 196.6. We therefore built the histogram of the z distribution (Fig. 2, d) from 0.5 to 10 d excluding the interval around P0 and those around P1, P2, and P3 as marked in Fig. 2 (a). The latter features are not noise fluctuations, but are tied to P0: P1 (=P) is due to the presence of the deep eclipse, still visible in the light curve folded at half of the period; P2 (dPP) and P3 (dPP) are due to beat frequencies between P0 and P1. We fit the resulting distribution for z with an exponential function and evaluated the integral of the best-fit function beyond z=196.6. This integral yields a number of chance occurrences due to noise of , corresponding to a significance for the detected feature of standard deviations in Gaussian statistics.
-
2.
We generated 1000 light curves scrambling the observed rates while keeeping unchanged the temporal distribution of the bins. For each of them we have produced the periodogram in the 0.5–10 d time interval (49335 trial periods). The highest value obtained among all these periodograms is 97.9. Therefore, the probability of random occurrence for the observed value () is lower than that corresponds to a significance of P0 higher than 5.5 standard deviations.
Figure 3 shows the 15–50 keV light curve of IGR J16493–4348, obtained excluding all pointings where the source was at an off-axis angle higher than 40 deg, with a bin time of P d, excluding bins with an exposure fraction less than 5%.The average intensity in each P0 bin shows a maximum variability of a factor .
3.2 XRT data
The knowledge of the orbital period and of the middle eclipse time allows us to determine that the Swift-XRT observation was performed at the orbital phase interval 0.45–0.51 with respect to the epoch of the eclipse. The 0.2–10 keV light curve shows a persistent emission with an average count rate of 0.3760.015 count s-1 and a variability within a factor 3.
We applied the folding technique to search for short periodicities in the time range 5–1000 s. The XRT SSB arrival times were corrected for the pulsar binary motion using P0, Teclipse, a semi-major axis lt-s (see Sect. 4 for its derivation), and assuming an orbit inclination of 90 degrees and an accentricity e=0. We found no evidence for any significant periodic signal.

4 Discussion
We have presented the results obtained from the analysis of the data collected by Swift-BAT during the first 54 months of the Swift mission on the supergiant HMXB IGR J16493–4348. The source is detected at a significance level of 21 standard deviations.
The long monitoring coupled with a good observation duty cycle ( per day) allowed us to unveil a periodicity of d that we interpreted as the orbital period of the binary system.
The knowledge of the orbital period allows us to derive the the semi-major axis of the binary system through the Kepler’s third law: P where and are the masses of the supergiant and compact object, respectively. Adopting (Searle et al., 2008, for an B0.5 Ib star, of radius ) and a typical neutron star mass of we obtain . This orbital separation is common among classical sgHMXB (Walter & Zurita Heras, 2007). The folded light curve shows the presence of a full eclipse with an estimated time of mid-eclispe at T P0 MJD and it appears flat outside the eclipse. The duration of the eclipse ( of the orbital period) is roughly consistent with the occultation of the compact source by the companion star in a highly inclined orbit with low eccentricity.
The 15–50 keV light curve of IGR J16493–4348 is variable up to a factor 20 on timescales of 300 s while its average over an orbital period shows a variability up to a factor 4. The inferred orbital separation suggests a wind-fed system. This hypothesis and the radius of the supergiant allows to limit the eccentricity of the orbit. Figure 4 shows how the Lagrangian point between the two stars changes as a function of the orbital phase for different orbit eccentricities (Paczyński, 1971); the maximum eccentricity compatible with a wind-fed system (Lagrangian point lower than the supergiant radius) is 0.15.

Acknowledgments
This work was supported by contracts ASI I/088/06/0 and I/023/05/0.
References
- Barthelmy et al. (2005) Barthelmy S. D., Barbier L. M., Cummings J. R., et al., 2005, Space Science Reviews, 120, 143
- Bird et al. (2010) Bird A. J.,Bazzano A., Bassani L., et al., 2010, ApJS, 186, 1
- Bird et al. (2004) Bird A. J., Barlow E. J., Bassani L., et al., 2004, ApJ, 607, L33
- Burrows et al. (2005) Burrows D. N., Hill J. E., Nousek J. A., et al., 2005, Space Science Reviews, 120, 165
- Buccheri & Sacco (1985) Buccheri, R., & Sacco, B. 1985, Data Analysis in Astronomy, Edited by V. Di Gesu, L. Scarsi, P. Crane, J.H. Friedman, and S. Levialdi. New York: Plenum Press, p.15
- Cusumano et al. (2010) Cusumano G., La Parola V., Segreto A., et al., 2010, A&A, 510, A48
- Gehrels et al. (2004) Gehrels N., Chincarini G., Giommi P., et al., 2004, ApJ, 611, 1005
- Grebenev et al. (2005) Grebenev S. A., Bird A. J., Molkov S. V., Soldi S., Kretschmar P., Diehl R., Budz-Joergensen C., McBreen B., 2005, ATel, 457, 1
- Hill et al. (2004) Hill J. E., Burrows D. N., Nousek J. A. et al., 2004, SPIE, 5165, 217
- Hill et al. (2008) Hill A. B., Dean A. J., Landi R., McBride V. A., de Rosa A., Bird A. J., Bazzano A., Sguera V., 2008, MNRAS, 385, 423
- Kuiper et al. (2005) Kuiper L., Jonker P., Hermsen W., O’Brien K., 2005, ATel, 654, 1
- Lebrun et al. (2003) Lebrun F., Leray, J. P., Lavocat, P., et al., 2003, A&A, 411, L141
- Markwardt, Swank,& Smith (2005) Markwardt C. B., Swank J. H., Smith E., 2005, ATel, 465, 1
- Nespoli, Fabregat, & Mennickent (2008) Nespoli E., Fabregat J., Mennickent R. E., 2008, ATel, 1396, 1
- Paczyński (1971) Paczyński B., 1971, ARA&A, 9, 183
- Searle et al. (2008) Searle S. C., Prinja R. K., Massa D., Ryans R., 2008, A&A, 481, 777
- Segreto et al. (2010) Segreto A., Cusumano G., Ferrigno C., La Parola V., Mangano V., Mineo T., Romano P., 2010, A&A, 510, A47
- Tueller et al. (2010) Tueller J., Baumgartner W. H., Markwardt C. B., et al., 2010, ApJS, 186, 378
- Ubertini et al. (2003) Ubertini P., Lebrun F., Di Cocco, G., et al., 2003, A&A, 411, L131
- Walter & Zurita Heras (2007) Walter R., Zurita Heras J., 2007, A&A, 476, 335
- Winkler et al. (2003) Winkler C., Courvoisier T. J.-L., Di Cocco G., et al., 2003, A&A, 411, L1