Atomic and molecular adsorption on transition-metal carbide (111) surfaces from density-functional theory: A trend study of surface electronic factors
Abstract
This study explores atomic and molecular adsorption on a number of early transition-metal carbides (TMC’s) by means of density-functional theory calculations. The investigated substrates are the TM-terminated TMC() surfaces, of interest because of the presence of different types of surface resonances (SR’s) on them and because of their technological importance in growth processes. Also, TM compounds have shown potential in catalysis applications. Trend studies are conducted with respect to both period and group in the periodic table, choosing the substrates ScC, TiC, VC, ZrC, NbC, -MoC, TaC, and WC (in NaCl structure) and the adsorbates H, B, C, N, O, F, NH, NH2, and NH3. Trends in adsorption strength are explained in terms of surface electronic factors, by correlating the calculated adsorption energy values with the calculated surface electronic structures. The results are rationalized with use of a concerted-coupling model (CCM), which has previously been applied succesfully to the description of adsorption on TiC() and TiN() surfaces [Solid State Commun. 141, 48 (2007)]. First, the clean TMC() surfaces are characterized by calculating surface energies, surface relaxations, Bader charges, and surface-localized densities of states (DOS’s). Detailed comparisons between surface and bulk DOS’s reveal the existence of transition-metal localized SR’s (TMSR’s) in the pseudogap and of several C-localized SR’s (CSR’s) in the upper valence band on all considered TMC() surfaces. The spatial extent and the dangling bond nature of these SR’s are supported by real-space analyses of the calculated Kohn-Sham wave functions. Then, atomic and molecular adsorption energies, geometries, and charge transfers are presented. An analysis of the adsorbate-induced changes in surface DOS’s reveals a presence of both adsorbate–TMSR and adsorbate–CSR’s interactions, of varying strengths depending on the surface and the adsorbate. These variations are correlated to the variations in adsorption energies. The results are used to generalize the content and applications of the previously proposed CCM to this larger class of substrates and adsorbates. Implications for other classes of materials, for catalysis, and for other surface processes are discussed.
pacs:
68.43.Bc, 73.20.At, 73.20.-rI Introduction
Many studies of TMX’s (TM = transition metal and X = C or N) are motivated by a curiosity on the properties of TMX’s, such as their mixture of covalency, ionicity, and metallicity, and by a suggested importance for heterogeneous catalysis. The attention to TMX’s as potential catalysts started with an observation by Levy and Boudart that the TMC’s show a Pt-like behavior in several catalytic reactions.LeBo73 According to more recent investigations, “early TMC’s and TMN’s often demonstrate catalytic advantages over their parent metals in activity, selectivity and resistance to poisoning” and “for several reactions, such as hydrogenation reactions, catalytic activities of TMC’s and TMN’s are approaching or surpassing those of group VIII noble metals”.Chen The TMX surfaces are also technologically important as substrate materials in growth processes, e.g., in wear-resistant multilayer coatings on industrial cutting tools HaVu97 ; PrPfSa98 and for growth of carbidic nanostructures.ItOsIcAi91 ; GuBaOtSo01
For catalytic applications, the stable or ideal surfaces are not necessarily the most suitable ones. Often the best site for a reaction is found on a stepped or in some way non-perfect surface, e.g., at kinks or around defects, where less stable faces of the material are exposed. Such sites often host surface states or surface resonances (SR’s). This calls for studies on surfaces that present such surface states or resonances.
In previous studies, the reactivities of the TiC() and TiN() surfaces are attributed to the presence of SR’s of both Ti and C/N character.RuLu07 ; VoRuLu06 ; RuVoLu06 ; RuVoLu07 Calculated trends in atomic adsorption strength are explained with a concerted-coupling model (CCM), in which the atomic frontier orbitals interact with both types of SR’s. More recently, we have indentified a descriptor, defined as the mean energy of the TM-derived SR (TMSR), for atomic and molecular adsorption and for activation-energy barriers.VoHeRuLu09 Hence, the existence of several linear relations between the atomic and molecular adsorption energies, “scaling relation”, have been shown.VoHeRuLu09 Such relations are of importance in the design of novel types of catalysts. Abild-Pedersen07 ; Sehested2007 ; Studt ; Norskov2009
This paper is devoted to a deeper and more generalized understanding of the chemisorption on the TMC() surfaces, thus also laying the ground for the above mentioned descriptor. We extend the work done in our previous study of the atomic adsorption on TiC() and TiN() and use density-functional theory (DFT) to investigate whether the CCM is applicable to other TMC’s. Our method consists of a detailed study of the trends in reactivity along periods and groups of the substrate parent metal and of the adsorbate, correlated with a careful mapping and analysis of the underlying details of the changes in surface electronic structure upon adsorption.
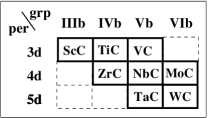
The substrates chosen in our study are the TMC’s formed with the parent metals Sc, Ti, V, Zr, Nb, Mo, Ta, and W in NaCl structure (see Fig. 1). As adsorbates we choose atomic H, B, C, N, O, and F as well as the molecules NH, NH2 and NH3. These particular choices of TMC’s and adsorbates allow us to capture changes in adsorption properties along both periods and groups in the periodic table. All studied TMC’s adopt a NaCl structure either in stable or in metastable phase.
Experiments show that after heating and ion or electron bombardment under low-temperature and low-pressure conditions the () surfaces of TiC,AonoTiC VC,RundgrenVC ZrC,HwangZrC NbC,EdamotoNbCLEED ; HayamiNbC and TaCSoudaTaCLEED ; HulbertTaC are unreconstructed and TM terminated. Therefore, our study deals with unreconstructed and TM-terminated () TMC surfaces. Surface electronic structure characterizations with angle-resolved photoemission studies (ARPES) show the presence of surface states on the () surfaces of TiC, WeaverTiC ; ZaimaTiC ; EdamotoTiC ZrC, EdamotoZrC NbC,EdamotoNbC and TaC.AnazawaTaC Also, experiments show that both H2 and O2 dissociate on TiC(),ZaimaTiC ; BrandshawTiC ; SoudaTiC ; EdamotoTiCH ; EdamotoTiCO ZrC(),TokumitsuZrCH ; NakaneZrCH ; NodaZrCO and NbC().KojimaNbCO ; EdamotoNbCO ; HayamiNbCO ; AizawaNbCO Despite this large number of experimental studies, theoretical investigations on TMC() surfaces are scarce.TanTiC111 ; ZhangNbC111 ; Kitchin ; ZhLiDiChZh02
This paper presents our results in the following order. First, a trend study of the clean TM-terminated TMC() surfaces is presented in Section II. In particular we address the properties of the surface electronic structures that are relevant for the adsorption mechanisms. Then, in Section III the adsorption-energy trends are presented together with the trends in the adorption-induced changes in surface electronic structure. The different trends in adsorption-energy and electronic-structure changes are analyzed and discussed in Section V, thus connecting our results to the previously proposed CCM. The paper is concluded by Section VI, which summarizes the main conclusions of our investigation and makes some outlooks to possible ramifications and further investigations.
II Trends in surface properties
In this Section the computational details and results from our DFT calculations on the clean TM-terminated TMC() surfaces are presented. First, the stability of the () surfaces is considered by comparing the cleavage energies of these surfaces with the corresponding results for the () surfaces. Then, the relaxed surface structures are presented and compared with existing results. This is followed by a charge transfer analysis and a detailed analysis of both the energy- and space-resolved surface densities of states (DOS’s). Particular emphasis is put on the presence and character of SR’s on the TMC() surfaces. Throughout the presentation, analyses of the trends with respect to the TM component of the studied TMC’s are made.
II.1 Computational details
The surface calculations presented in this paper are performed within the DFT formalism using the plane-wave pseudopotential code Dacapo.dacapo The ion-electron interaction is treated with Vanderbilt ultrasoft pseudopotentials.Vanderbilt The exchange-correlation energy is included by the generalized gradient approximation (GGA) using the PW91 functional.BuPeWa98 We utilize a slab geometry, with slabs of to bilayers (a bilayer being a unit of one TM layer and one C layer), a vacuum region thickness corresponding to bilayers, that is, at least Å, and periodic boundary conditions. Each atomic layer is composed of one atom in a () geometry. The atoms in the three (four) outermost atomic layers on the TM-terminated side of a () bilayer thick slab are allowed to relax until the sum of the remaining forces on all relaxed atoms is less than eV/Å, while the remaining atomic layers are fixed at the bulk geometry. A Monkhorst-Pack sampling MoPa76 of special -points and a plane-wave energy cutoff of eV are used. The slab used to model the () surface is asymmetric, which gives rise to a discontinuity in the electrostatic potential at the cell boundary. This is corrected for by using the scheme in Ref. Bengtsson, .
To characterize the surfaces we utilize several electronic structure tools. A Bader analysis is used to calculate the charge localization around individual atoms.Bader ; Baderalgorithm Total and local, that is, atom-projected, DOS’s for the surface bilayer are obtained by projecting the Kohn-Sham wave functions onto individual atomic orbitals and plotted as a function of energy (relative to the Fermi level ). To identify the surface specific properties that arise upon creation of the surface, the surface DOS’s are compared to the bulk DOS’s by studying the differences between the two quantities. Information about the spatial localization of the surface-localized states is provided by analyzing the space-resolved surface DOS, that is, the Kohn-Sham wave functions.
II.2 Cleavage energies
The cleavage energy , that is, the energy needed to create two surfaces upon cleavage of a bulk structure along a specific crystallographic plane, is calculated as
| (1) |
where is the total energy of a slab with TMC bilayers that exposes the two surfaces under investigation and
| (2) |
is the bulk energy of one TMC bilayer, if is sufficiently large. Thus, the cleavage energy corresponds to the sum of the surface energies of the two surfaces obtained upon cleavage. In the case of calculations on stoichiometric TMC() slabs, the cleavage energy is equal to the sum of the surface energies of the TM-terminated surface and of the C-terminated surface.
Our calculated values for the TMC() surfaces, after relaxation of only the TM-terminated side of the slabs, are given in Table 1. Along a period shows a maximum for group IV, thus showing the same variations as the ones found for the bulk cohesive energies in our previous study.VoRu09 Down a group, the variations in are small but discernible and do not show any apparent correspondence to the bulk cohesive energies of Ref. VoRu09, .
According to the calculated values, TiC() is the surface that requires the most energy to create among the considered TMC surfaces. Nevertheless, this surface is routinely grown by chemical-vapor deposition (CVD) under high temperatures as wear-resistant coating on industrial cutting tools.HaVu97 ; PrPfSa98 The calculated value for the TiC() surface agrees well with those of previous DFT calculations.Dudiy ; RuLu07
II.3 Surface geometry
| Period | Group | Surface | d12 | d23 | d34 | d45 | d | |||
|---|---|---|---|---|---|---|---|---|---|---|
| III | ScC | |||||||||
| IV | TiC | 111The cleavage energies for the () surfaces are adapted from Ref. VinesTMC100, as , since a stoichiometric () surface slab has two equivalent sides. | 222Ref. AonoTiC, . | |||||||
| V | VC | 111The cleavage energies for the () surfaces are adapted from Ref. VinesTMC100, as , since a stoichiometric () surface slab has two equivalent sides. | 333Ref. RundgrenVC, . | |||||||
| IV | ZrC | 111The cleavage energies for the () surfaces are adapted from Ref. VinesTMC100, as , since a stoichiometric () surface slab has two equivalent sides. | ||||||||
| V | NbC | 111The cleavage energies for the () surfaces are adapted from Ref. VinesTMC100, as , since a stoichiometric () surface slab has two equivalent sides. | 444Ref. HayamiNbC, . | |||||||
| VI | -MoC | 111The cleavage energies for the () surfaces are adapted from Ref. VinesTMC100, as , since a stoichiometric () surface slab has two equivalent sides. | ||||||||
| V | TaC | 111The cleavage energies for the () surfaces are adapted from Ref. VinesTMC100, as , since a stoichiometric () surface slab has two equivalent sides. | 555Ref. HulbertTaC, . | |||||||
| VI | WC |
The calculated relaxations of the four topmost layers of the TMC() surfaces are given in Table 1. A pronounced contraction (–) of the first interlayer spacing is found on all the surfaces. At the same time, the second interlayer spacing increases compared to the bulk separation. Further down into the slab the relaxations become smaller and the structure converges to the bulk structure after three bilayers.
Most of the TMC() surfaces exhibit an alternating positive-negative relaxation similar to the one found in metals.JoMa88andHe94 Compared to the close-packed parent metal surfaces, where the outer-layer relaxations are only a few percents of the corresponding bulk interlayer spacings,JoMa88andHe94 ; Feibelman the relaxations of the TMC() surfaces are larger and comparable to other ionic polar surfaces.RuYoLu02 This indicates that the bonding character in TMC’s has a significant ionic contribution, as discussed in Ref. VoRu09, . The relaxation of the () surfaces is hence quite different from the smaller rumpled relaxation found on the non-polar () surfaces.
The percentual relaxations of the () surfaces, relative to the bulk interlayer spacings, decrease down each group. Along the periods, the smallest percentual relaxation is found for group IV in period and group V in period . The larger percentual relaxations of -MoC and WC can be attributed to the NaCl structure being a metastable phase for these compounds. The largest structural changes are found on the ScC surface. The variations in percentual relaxations are directly correlated to the cohesive energies:VoRu09 a small cohesive energy gives a large relaxation.
For the contraction of the first interlayer distance there are some experimental data, which agree qualitatively with our calculated values and in most cases even quantitatively, as shown in Table 1. For TiC(), tight-binding TanTiC111 and DFT Kitchin calculations agree well with our values. Several of our results are also in qualitative agreement with the theoretical ones in Ref. ZhLiDiChZh02, . A deviation is found, however, for the NbC() surface, where experimental studies show a contraction of both the first and the second interlayer distance, by and , respectively.HayamiNbC The first observation agrees with our calculated value but the second one differs qualitatively from the contraction seen in our and other first-principles studies.ZhangNbC111 ; Kitchin
II.4 Bader charge transfer
| Period | Group | Surface | TM | C | ||
|---|---|---|---|---|---|---|
| rel. atom | rel. bulk | rel. atom | rel. bulk | |||
| III | ScC | |||||
| IV | TiC | |||||
| V | VC | |||||
| IV | ZrC | |||||
| V | NbC | |||||
| VI | -MoC | |||||
| V | TaC | |||||
| VI | WC | |||||
In the bulk TMC systems there is a charge transfer from the TM to the C atoms.VoRu09 Table 2 shows our calculated Bader charge values for the TM-terminated TMC() surfaces. Both the values relative to the free atoms (in units of electronic charge ) and the values relative to the bulk values (in percentages) are given.
Compared to the bulk, an accumulation of charge occurs on the first surface bilayer, mainly on the first TM atomic layer but also in several cases on the topmost C atomic layer. An exception is ScC(), where the C layer gains more electrons than the Sc layer. For all the investigated TMC’s there is a total of – reduction in the surface bilayer ionicity compared to the corresponding bulk ionicity.VoRu09 For the NbC() surface our ionicity value for the surface Nb atoms () is in good agreement with the calculated one of by Zhang et al.ZhangNbC111
To the right along each period (except for -MoC), the charge accumulation on the first TM layer atoms increases, while it decreases on the C layer atoms. The same trends are found down each group.
The calculated charge accumulation at the TMC() surfaces has its origin in the polar nature of these surface. As mentioned above, the TMC’s are partially ionic materials. Therefore there is a macroscopic electric field caused by the non-zero perpendicular dipole moment of the TMC bilayer, which makes the () surface polar and unstable.Ta79 To counteract this, a surface charge can be induced, creating a neutralizing electric field. In Ref. TsuHo82, , it is shown that for the () surface of a crystal with the NaCl structure, this surface charge should be equal to of the bulk ionicity, which is what we observe.
II.5 Electronic structure
In this Section, we investigate in detail the electronic structure of the clean TMC(111) surfaces to gain an understanding of which characteristics that are surface unique and potentially important for the adsorption.
II.5.1 Bulk characteristics
For convenience and to facilitate the discussion of the TMC() surfaces, we here provide a very short summary, based on Ref. VoRu09, , of some bulk characteristics of the TMC’s.
The bonding in bulk TMC’s has contributions from iono-covalent TM–C bonds, from TM–TM bonds, and from C–C bonds. For all considered TMC’s, the bulk DOS’s and band structures consist of a low-lying valence band (LVB), dominated by C() states, an upper valence band (UVB), with contributions from C() and TM() states, and a conduction band (CB) of mainly TM() character. The covalent TM()–C() bonding states are found in the UVB. The main contribution to the UVB (CB) comes from C() [TM()] states, thus indicating the partially ionic character of the bond. The UVB and the CB, positioned on each side of , are connected by a non vanishing continuum of TM–TM and TM–C states (for ScC also C–C states) states. The C()–C() bonds are found in the lower part of the UVB.
Towards the right along each period, both the UVB and the CB are shifted down in energy relative to and the UVB becomes less C localized. Down each group, the bands are shifted towards lower energies and the UVB becomes more C localized.
II.5.2 Common surface characteristics
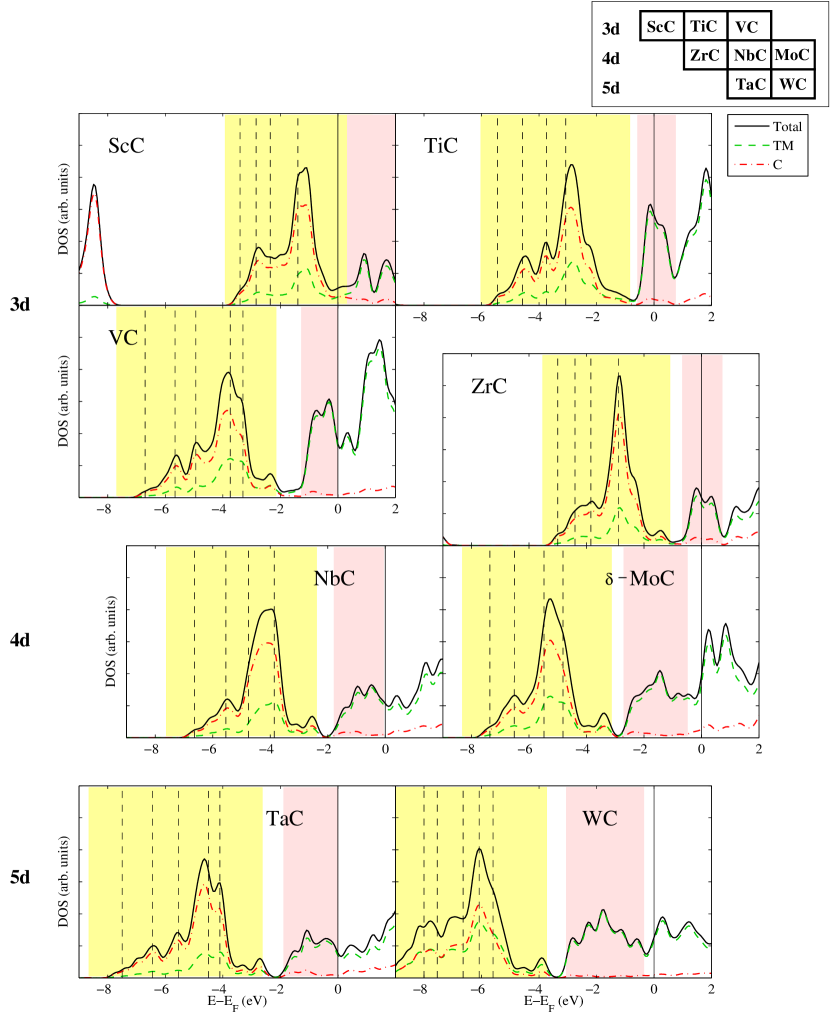
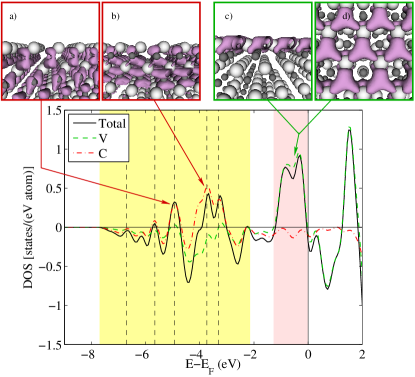
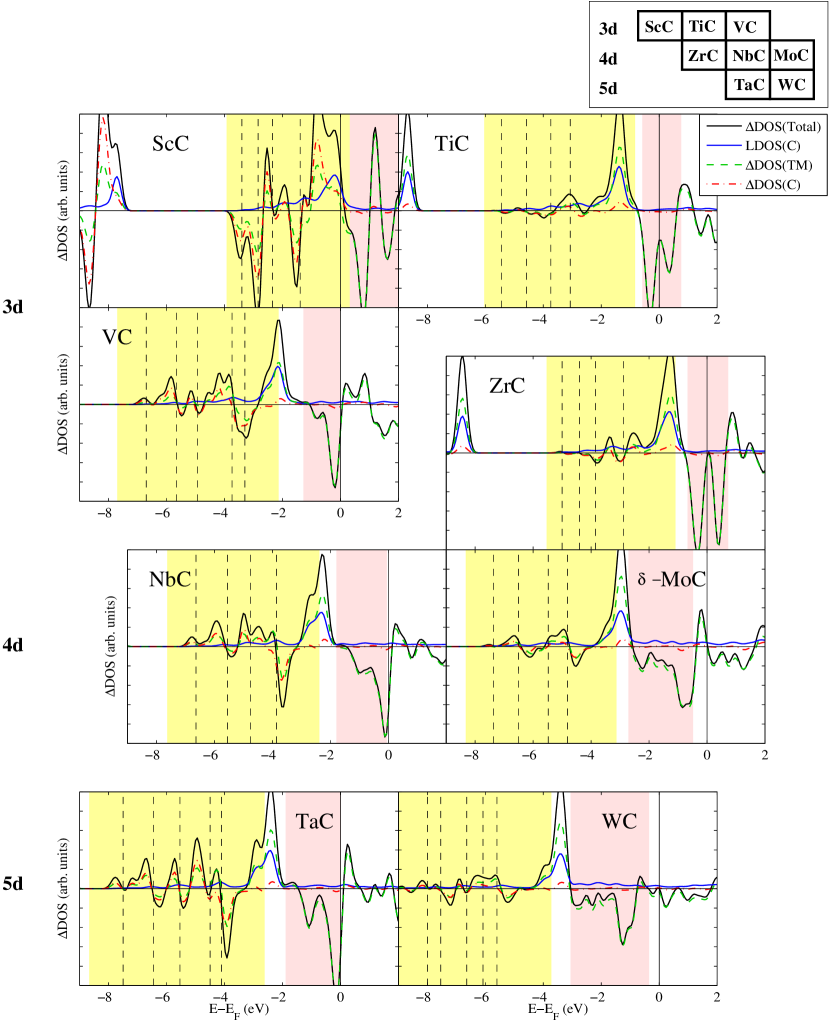
The total and atom projected DOS’s of the first TMC surface bilayer are presented in Fig. 2. A common feature of the bulk and surface DOS’s is that both have an LVB, a UVB, and a CB. The bulk DOS is recovered in the third surface bilayer. Despite these similarities, all surface DOS’s differ sharply from their respective bulk DOS’s. To easier identify the surface properties we study the difference between the surface DOS (Fig. 2) and the bulk DOS (adapted from our bulk study VoRu09 ), as illustrated for VC in Fig. 3.
For all considered TMC () surfaces, surface specific features similar to those found on TiX()RuLu07 ; RuVoLu06 ; RuVoLu07 can be identified, in particular: (i) a TM-localized surface resonance (TMSR), positioned in the bulk pseudogap at or in the vicinity of (shaded red area in Figs. 2 and 3) and (ii) a more strongly C-localized UVB than in the bulk, with several C-localized surface resonances (CSR’s) in the lower part of the UVB (shaded yellow area in Figs. 2 and 3). The energetical extent of the surface UVB is, however, largely similar to that of the bulk UVB.
Both kinds of surface resonances consist of states localized at the surface that overlap energetically with bulk states, hence the term surface resonance. They can be identified as positive peaks in the DOS-difference plots and from real-space analyses of the Kohn-Sham wave functions (Fig. 3). These show that the TMSR’s correspond to unsaturated TM bonds that extend into the vacuum [see Fig. 3(c)] and point towards the fcc sites [see Fig. 3(d)] where the C atoms would be present if the bulk stacking in the () direction had been continued. Hence the TMSR are dangling bonds with a three-fold symmetry. The C-localized states in the surface bilayer rearrange to form new bonds; however, they do not become fully saturated, which results in C dangling bonds striving in between the first-layer TM atoms towards the vacuum [see Fig. 3(a-b)]. Coupling of these states to the second bilayer bulk states gives them the status of surface resonances.
In addition, several negative peaks can be identified in the DOS-difference plots (Fig. 3): (i) one region of mixed TM and C character, positioned in the upper part of the UVB and just below the TMSR (between the shaded yellow and red regions in Fig. 3); (ii) several peaks of mixed TM and C character, positioned in between the CSR peaks in the lower part of the UVB; and (iii) one region of mainly TM character, positioned in the lower part of the CB. These regions of negative peaks correspond to strong quenchings of the bulk UVB and CB peaks, respectively.
II.5.3 Trends in surface characteristics
The analysis of the difference between surface and bulk DOS’s shows that as the group number of the surface TM constituent increases along each period, the position of the TMSR is shifted to lower energies relative to , as expected from the filling of the TM states. The TMSR filling increases, varying from a non-filled TMSR above for group III, to a partly filled TMSR at for group IV, to a filled TMSR just below for group V, and a filled low lying TMSR for group VI. At the same time, the TMSR amplitude decreases, while the width is constant or increases slightly.
A shift to lower energies and a decreasing amplitude are observed also for the CSR’s, starting from ScC(), whose CSR’s lie just below . In addition, the amplitudes of the negative DOS-difference peaks in the upper part of the UVB and in the lower part of the CB decrease. For ScC, both the DOS-difference plots and the Kohn-Sham wave functions show more pronounced CSR’s than on the other TMC’s.
The DOS-difference plots show that as the period number of the surface TM constituent increases down each group, the positions of the TMSR and of the CSR’s are more or less unaffected, while the TMSR amplitude decreases and the width increases slightly.
II.5.4 Connection with experiments
Several of the TMC() surfaces have been studied by means of angle resolved photoemission spectroscopy (ARPES), revealing surface-localized states, there denoted “surface states”.WeaverTiC ; BrandshawTiC ; ZaimaTiC ; EdamotoTiC We associate these with our TMSR’s, termed “resonances” because of their location in the pseudogap where the bulk DOS is non vanishing. The ARPES study, with an experimental resolution of eV, places the position of these TMSR’s in the -point at eV for TiC, WeaverTiC ; BrandshawTiC ; ZaimaTiC ; EdamotoTiC at eV for ZrC, EdamotoZrC at eV for NbC,EdamotoNbC and at eV for TaC,AnazawaTaC in perfect agreement with our results.
II.6 Origin of the SR’s
The appearance of the TMSR’s is a result of the breakage of the iono-covalent TM–C bonds that cross the () cleavage plane, which causes (i) anti-bonding TM states in the empty bulk CB to collapse into more TM atomic-like states, which lie at a lower energy than the CB and are positioned at or in the vicinity of , and (ii) bonding C states in the upper part of the UVB to vanish as C atoms are removed from the surface. This is seen in our DOS-difference plots (illustrated by Fig. 3) as negative peaks in the upper part of the bulk UVB region and in the lower part of the bulk CB region. A similar finding was reported for TiC().RuLu07 ; RuVoLu07 The existence of TMSR’s supports the charge accumulation picture obtained from the Bader analysis.
In an analogous way, the changes in the lower part of the UVB DOS can be interpreted to be due to the breakage of the bulk C–C bonds upon formation of the surface, which results in the formation of CSR’s. The increase of Bader charge on the C atoms in the surface bilayer supports the existence of CSR’s and arises partly due to the influence of the extra charge on the TM surface bilayer on the C atoms.
The increase in amount of extra charge on the TM surface layer, compared to the bulk, that takes place when moving to the right along a period (see Section II.4) is due to the filling of the TM states and therefore of the TMSR. At the same time the amount of extra charge on the C layer, compared to the bulk, decreases.
For the ScC surface the whole DOS is positioned at higher energies compared to the other TMC’s. We recall that in bulk ScC, the C–C bonds are more pronounced than in the other TMC’s.VoRu09 In addition, the energy separation between UVB and CB is largest for this TMC and the Sc-localized CB is very high up in energy relative to . Therefore the ScSR states are not populated. However, the surface still strives to reduce its polarity, which is done by a charge accumulation on the C atoms, resulting in very pronounced CSR’s.
III Trends in atomic adsorption
So far we have discussed the properties associated with clean TMC surfaces. In this Section the focus is on the atomic adsorption on the TM-terminated TMC() surfaces. Atomic adsorption is one of the first necessary processes in reactions at surfaces. We perform two series of trend studies: one with respect to the adsorbate and one with respect to the substrate. As adsorbates we consider period 1 and period 2 atoms H, B, C, N, O, and F. The substrate trend involves the change of the TM atom in the TMC. In our case we use the carbides ScC, TiC, VC, ZrC, NbC, -MoC, TaC and WC, thus spanning four groups and three periods in the periodic table (see Fig. 1). The consequences of changing the non-metal atom have been investigated in previous studies, where adsorption on TiC() and TiN() was conducted.VoRuLu06 ; RuVoLu06 ; RuVoLu07 ; RuLu07
III.1 Computational details
The systems are modeled by four bilayers of TMC with a by atom geometry in the surface plane. We use a cutoff energy of eV and a Monkhorst-Pack sampling of points. The high symmetry adsorption sites fcc, hcp, top, and bridge are considered. Both the adatom and the three top-most surface bilayers are allowed to relax in all directions.
The adsorption energies are defined as
| (3) |
where is the energy of an isolated spin-polarized atom. It is known that the values are sensitive to the choice of GGA flavor. To get an understanding of the flavor dependence we have performed calculations on TMC() systems with adsorbed H, N, and O atoms using the RPBE GGA functional.RPBEHammer The RPBE functional has been shown to give better results than the PW91 GGA functional for adsorption energies on TM surfaces, RPBEHammer whereas for bulk structure determination in some cases it gives worse results than the PW91 functional.KuPeBla99 According to our calculations on H, N, and O adsorbed on TMC() surfaces, the RPBE functional gives consistently lower values than the PW91 functional. A similar type of variation was found for adsorption on pure TM surfaces.RPBEHammer As the decrease in values for each adsorbate is the same on all the considered TMC() surfaces ( eV, eV, and eV for the H, N, and O adsorbates, respectively), the trends with respect to the substrate are not affected by the choice of GGA functional. Also, as these changes are smaller than eV, the changes in trends with respect to the adsorbate are not significant enough to affect the key features of these trends.
III.2 Atomic adsorption energies
| Period | Group | Surface (site) | H | B | C | N | O | F |
| III | ScC (fcc) | |||||||
| IV | TiC (fcc) | |||||||
| V | VC (fcc) | |||||||
| IV | ZrC (fcc) | |||||||
| V | NbC (fcc) | |||||||
| VI | -MoC (fcc) | |||||||
| -MoC (hcp) | ||||||||
| V | TaC (fcc) | |||||||
| VI | WC (fcc) | |||||||
| WC (hcp) |
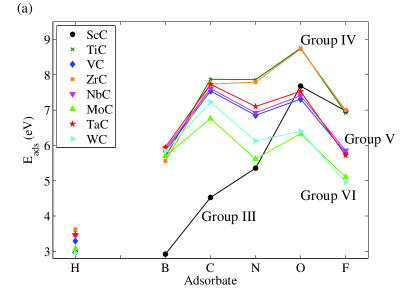
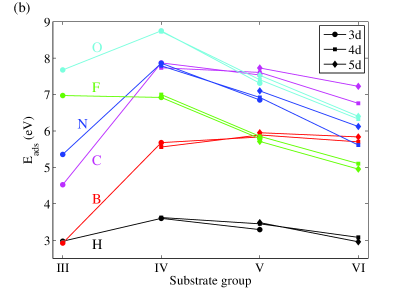
To elucidate our results in a clear way we gather the calculated values in Table 3 and Fig. 4. The most favorable adsorption site is fcc, except for some adsorbates on -MoC and WC, which favor the hcp site, closely followed by the fcc site. The relaxed perpendicular distances between each adatom and the TMC(111) substrates are given in Table 4. In the following, the discussion will focus on the fcc site. There are three arguments for this choice. First of all the shape of the trends does not change if the hcp preference is considered. Secondly, as we are interested in focusing on the changes in surface electronic structure due to electronic factors we want to reduce the effects arising from geometric factors. Thirdly, in Ref. RuLu07, it has been shown for TiC() that a similar adsorption mechanism applies for adsorption in both fcc and hcp sites.
When moving from left to right along the adatom period 2 [BF, see Fig. 4(a)] we find (i) “M”-shaped trends for all TMC’s; (ii) grouping, that is, similar values within each substrate group; and (iii) strongest adsorption either for O or for C, depending on the substrate. The smallest variations in values are found on -MoC.
For each adsorbate, the trends in along the substrate periods [Fig. 4(b)] show that as group IV VI, (i) the adsorption strength decreases for the adsorbates N, O, and F; (ii) the variations are small for H and C; and (iii) the adsorption strength increases slightly for B. The strongest adsorption is found on group IV TMC’s (except for B).
On ScC, the adsorption trends show somewhat different behaviors than on the other substrates. Also, the variations in within each substrate group are much smaller than the ones within each substrate period.
| Period | Group | Surface (site) | H | B | C | N | O | F |
| III | ScC (fcc) | |||||||
| IV | TiC (fcc) | |||||||
| V | VC (fcc) | |||||||
| IV | ZrC (fcc) | |||||||
| V | NbC (fcc) | |||||||
| VI | -MoC (fcc) | |||||||
| -MoC (hcp) | ||||||||
| V | TaC (fcc) | |||||||
| VI | WC (fcc) | |||||||
| WC (hcp) |
III.3 Bader analysis
The Bader analysis gives a fractional electronic charge transfer from the substrate to the adsorbate (see Table 5). This indicates that the adsorbate–TMC bond is partially ionic. Most of the charge that the adsorbate gains is from the nearest three surface TM atoms, except on ScC where the C atoms are the main electron donors.
The variations in the charge transfer down the TMC groups are much smaller than those along the TMC periods. This indicates a more similar adsorbate–substrate interaction within substrate groups than within substrate periods. The largest amounts of charge transfer are found for the adsorbates N and C. However, the most filled outer electron shell is found for F, which is the most electronegative of the adsorbates. In our previous work on TiX() we found, based on Bader analysis and the adsorbate-induced changes in electron density, that F has the strongest ionic adsorbate–substrate bond.RuLu07 ; VoRuLu06 ; RuVoLu07
Overall, there is no clear correlation between the calculated and charge transfer values, implying that the charge transfer alone cannot explain the trends. In the same way as in our previous studies on TiX(),RuLu07 ; VoRuLu06 ; RuVoLu07 we show in the following that there is a significant covalent contribution to the adsorbate–TMC() bond.
| Period | Group | Surface (site) | H | B | C | N | O | F |
| III | ScC (fcc) | |||||||
| IV | TiC (fcc) | |||||||
| V | VC (fcc) | |||||||
| IV | ZrC (fcc) | |||||||
| V | NbC (fcc) | |||||||
| VI | -MoC (fcc) | |||||||
| -MoC (hcp) | ||||||||
| V | TaC (fcc) | |||||||
| VI | WC (fcc) | |||||||
| WC (hcp) |
III.4 Density of states
To learn about, in particular, the covalent parts of the adsorption bond, this Section is devoted to the trends in the adsorption-induced electronic structure. More precisely, the difference in the surface DOS before and after adsorption (DOS), that is, the adsorbate-induced changes in DOS are investigated. With this very useful tool we monitor trends with respect to both substrate and adsorbate.
III.4.1 Common characteristics in DOS for atomic adsorbates
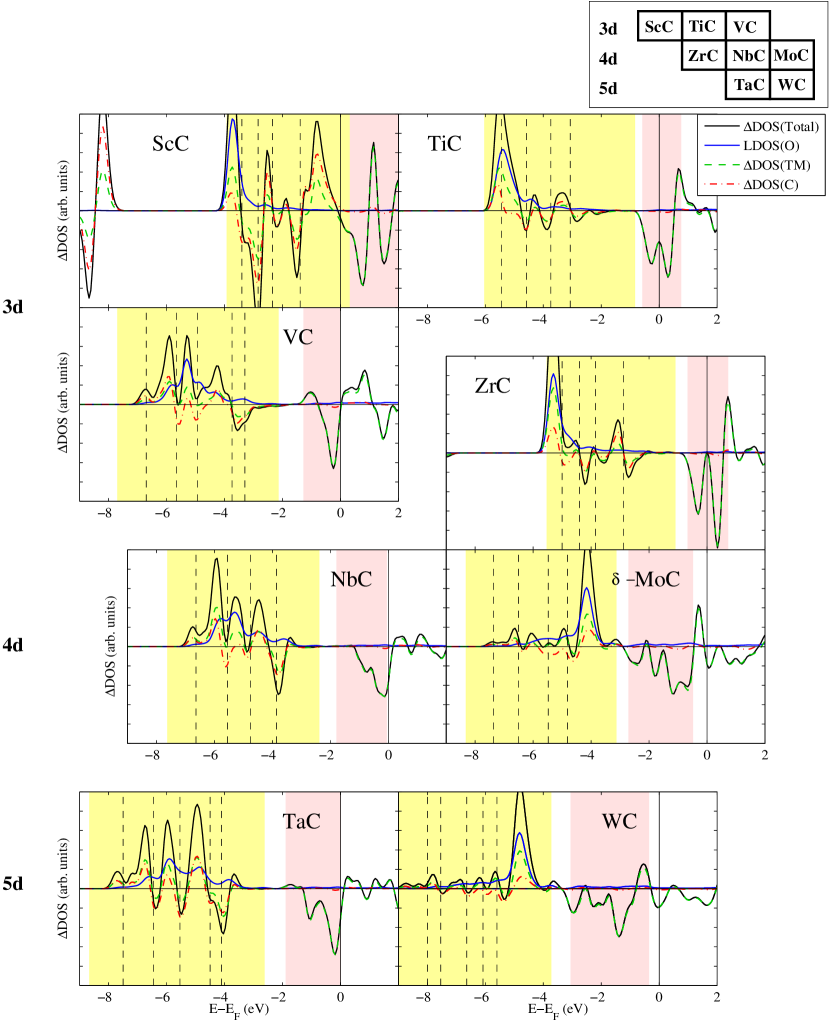
Figures 5 and 6 show the DOS’s for C and O, respectively, adsorbed on the considered TMC() surfaces. Figure 7 shows the DOS’s for the different adsorbates on the VC() surface. The general form of all the DOS’s consists of negative peaks of exclusively TM character at the location of the clean-surface TMSR’s (the shaded red regions) and negative peaks (or minima) of C character at the location of the clean-surface CSR’s (vertical lines in the shaded yellow regions). Positive DOS peaks are observed below, in between, and above the various negative peaks. A more detailed analysis of the atom-projected DOS’s shows that all the TMSR states associated with the three TM atoms close to the fcc site, where the adatom is adsorbed, are depleted.
III.4.2 Trends in DOS with respect to the substrate
The variations in DOS between the different substrates are illustrated by addressing the differences between two representative example: C and O atoms, respectively.
The DOS for adsorbed C, Fig. 5, shows the presence on all substrates of a pronounced positive adsorbate-projected DOS (represented by the blue line) peak that is pinned just below the depleted TMSR region and that extends with a low-amplitude tail throughout the upper part of the UVB. This peak overlaps with substrate-TM states and can therefore be identified as a bonding adsorbate–TMSR level. The corresponding antibonding level, of mainly TM character, is found above the depleted TMSR region. The DOS in the UVB consists of a number of subpeaks, of mixed adatom-C, substrate-TM, and substrate-C character, that are located in between the depleted CSR levels. Such a structure indicates that the bonding adsorbate–TMSR level has interacted with the CSR’s in the UVB.
The ScC substrate forms an exception to the above pattern. Here, the interaction with the CSR’s in the UVB appears to be much stronger. Also, the overlap of the adsorbate-projected DOS peak with the substrate-TM states is not as pronounced as on the other TMC substrates.
The DOS for adsorbed O, Fig. 6, shows a much more varied structure. On several substrates, the adsorbate-projected DOS is now located inside the UVB region and shows a stronger substrate-C character than in the case of adsorbed C. When moving from left to right along each TMC period, this peak shifts to higher energies relative to the substrate UVB region: for group IV TMC’s (TiC and ZrC) it lies at the lower edge of the UVB, whereas for group VI TMC’s (-MoC and WC) it lies at the upper edge of the UVB. At the same time, its form changes: quite localized with a tail towards higher energies for TiC and ZrC; broad for VC, NbC, and TaC; and localized with a tail towards lower energies for -MoC and WC. These observations indicate a stronger and much more varied interaction between the bonding adsorbate–TMSR level and the substrate CSR’s than in the case of adsorbed C.
Again, ScC stands out from the above pattern, being characterized by a much stronger participation of the substrate CSR’s in the bonding.
It can also be noted that for both adsorbed C and adsorbed O, the key features of the DOS’s are the same within each substrate TM group.
These results show the presence of significant covalent bondings between the adsorbate and the substrate SR’s. In particular, both types of SR’s (TMSR’s and CSR’s) appear to participate in the chemisorption. This indicates that the previously reported picture for adsorption on TiC() and TiN(), that is, a concerted-coupling model (CCM) should be valid on these TMC() surfaces as well. Such a picture is further pursued in Section V, where the differences and variations in electronic structure are related to the trends in calculated values described in Section III.2.
III.4.3 Trends in DOS with respect to the adsorbate
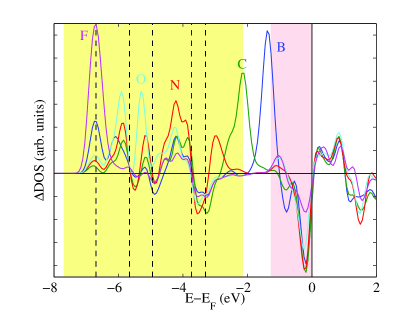
To illustrate the variations in DOS upon change of adsorbate, Fig. 7 shows the calculated DOS’s for the period 2 adatoms on the VC() surface. This trend has previously been studied on the TiC and TiN () surfaces and described with the CCM.VoRuLu06 ; RuVoLu06 ; RuVoLu07 ; RuLu07
For all the adsorbates there are quenchings of both the TMSR and the CSR’s, but to different degrees for different adsorbates. As we go from left to right along the adatom period (BF), the energy of the adatom-projected DOS decreases. At the same time, its width changes: localized for B and C, delocalized for N and O, and again localized for F. Also, the depletion of the TMSR decreases gradually. The degree of depletion of the substrate CSR’s varies also between the different adsorbates. An analysis of the Kohn-Sham wave functions shows that adatom-projected DOS peaks that lie in the lower part of the UVB consist of strong adatom–C bonding states, while peaks in the upper part of the UVB contain strong adatom–TM bonding states.
Again, these variations indicate strongly varying degrees of interaction between adsorbate, TMSR, and CSR levels. They resemble the trends previously found on the TiC and TiN () surfaces and should therefore be possible to explain in a similar way within the CCM. This is done in Section V, where the DOS variations are related to the calculated trends.
IV Molecular adsorption
| (eV) | (Å) | Bader (units of ) | |
|---|---|---|---|
| NH | |||
| NH2 | |||
| NH3 |
In this Section we present results for molecular adsorption on the VC() surface, which is here chosen as a prototype for molecular adsorption on the TMC() surface. The molecular adsorbates are the NHx molecules (), which are a part of our study in Ref. VoHeRuLu09, . The same supercell size and computational parameters as those used for the atomic adsorption are employed for these calculations (see Section II.1). The molecules are adsorbed with the N atom closest to the surface in the fcc site (the stable site for N atomic adsorption). The adsorption energy is calculated relative to the energy of an isolated NHx molecule as
| (4) |
The charge transfer between substrate and absorbed molecule is calculated as the sum of the Bader charges on each of the constituent atoms in the molecule.
A summary of the results is given in Table 6. As the molecule size increases, the perpendicular distance to the surface increases, while both the adsorption energy and the charge transfer from surface to molecule decrease.
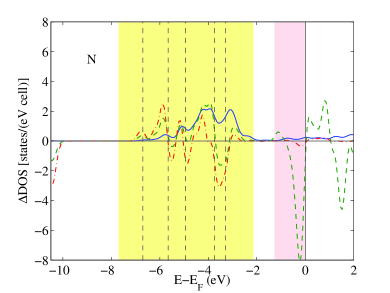
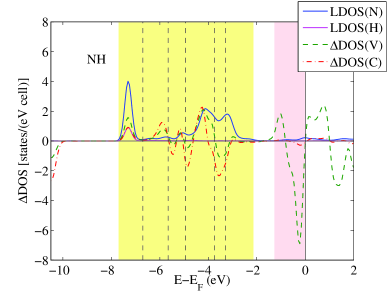
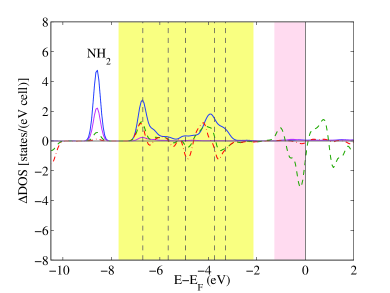
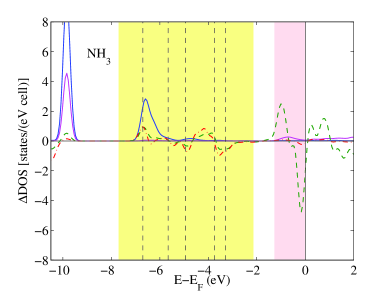
Figure 8 shows calculated LDOS’s (projected on the molecule atoms) and DOS’s (projected on the substrate atoms) for N and NHx () on VC(). The energy and structure of the LDOS’s vary between the different adsorbates. For atomic N, it consists of one delocalized region in the middle of the UVB. For NH, there is a slightly weaker delocalized region of N character in the middle of the UVB, together with a sharp peak of mixed N and H character in the lower part of the UVB. For NH2, the delocalized region of N character in the middle of the UVB is further weakened and a new sharp peak of mixed N and H character appears below the UVB. For NH3, the delocalized region in the middle of the UVB disappears, while the sharp peak below the UVB is stronger and lies at lower energy. For all adsorbates, there is a quenching of both the TMSR and the CSR’s. These SR depletions are largest for N and decrease every time a H atom is added to the molecule. Hence, each addition of a H atom weakens the interaction between the adsorbed molecule and the SR’s.
V Discussion
As described above, we find several trends in the calculated adsorption energies: “M”-shaped variations with respect to atomic adsorbate, linear variations with respect to substrate, qualitatively different types of adsorption on ScC and for F adatom, and trends in molecular adsorption strength.
In this Section, we describe how these trends can be described within our previously proposed concerted-coupling model (CCM) for atomic adsorption on TiX() surfaces.RuLu07 ; RuVoLu06 ; RuVoLu07 First, the CCM is described by giving an account of the main results of Refs. RuLu07, ; RuVoLu06, ; RuVoLu07, and shown to apply also on the here considered TMC’s by pointing out the similarities in electronic structure results. Then, the different adsorption-energy trends are explained in terms of the CCM. Finally, the results lay the ground for the single descriptor for the adsorption strength, recently introduced in Ref. VoHeRuLu09, .
V.1 Concerted-coupling model
For TM surfaces, the -band model yields a successful description of electronic structure and adsorption.HammerNorskov00 ; Bligaard08 For instance, its key parameter , the mean energy of the substrate band, is a good descriptor for, e.g., adsorption.Hammer95 ; HammerNorskov95 ; BlNoLu08 Such a fact facilitates the design of new TM catalysts by computational screening.Abild-Pedersen07 ; Sehested2007 ; Studt ; Norskov2009
For adsorption on TMC’s, however, there are deviations from the d-band model.Kitchin ; Fernandez Indeed, we find that different TMC surfaces can have the same value of but different values. For example, the values for TiC() and TiC() surfaces are as close as eV and eV, whereas the values for oxygen differ considerably, being eV and eV, respectively.RuLu07
In the d-band model, adsorption trends are explained by the interaction between the adatom frontier orbital and the narrow TM band. Using the terminology of the Newns-Anderson (NA) model for chemisorption, Anderson ; Newns ; Grimley ; SpDe93 this bond is typically “strong” and results in the formation of separated bonding and antibonding adatom–substrate states (see case d in Fig. 9).Newns
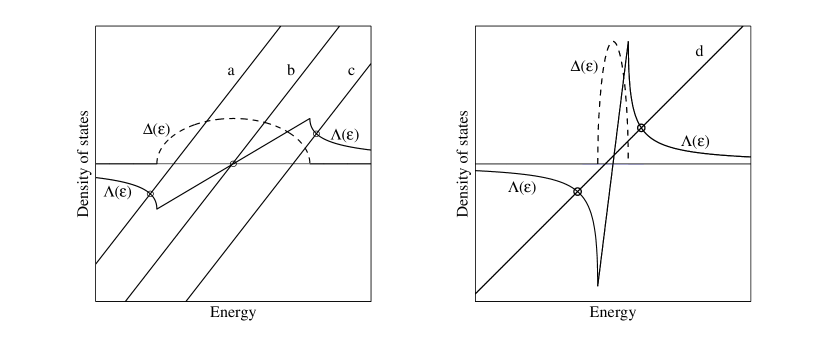
In Refs. RuLu07, ; RuVoLu06, , and RuVoLu07, , atomic adsorption on the TiC and TiN () surfaces is described as a result of two types of interactions between adsorbate and substrate. In the terminology of the NA model, the coupling of the adatom frontier orbital is typically “strong” with the substrate TiSR and “weak” with the substrate XSR’s (X = C or N) (as in case d and in cases a–c in Fig. 9, respectively). A concerted action of these couplings gives a qualitative explanation for the calculated adsorption energy trends on the TiC()RuLu07 ; RuVoLu06 ; RuVoLu07 and TiN()VoRuLu06 ; RuVoLu06 ; RuVoLu07 surfaces. The TiSR is present on the TiX() surfaces but not on the () ones. The XSR’s are found in the TiX() UVB’s.
In the first mentioned coupling above, the large overlap of the localized TiSR with the adatom orbital causes a strong adatom–TiSR interaction (in the NA sense). Well-separated bonding and antibonding states of mixed adsorbate and Ti character are then formed (case d in Fig. 9). The bonding-state energy lies below the free-adatom and TiSR levels, while the antibonding state resides above the TiSR level.
In the other coupling, the bonding adatom–TiSR level interacts with the XSR’s present in the substrate UVB. Due to the short range of the XSR’s (compared to the TiSR), this interaction is weak (in the NA sense) and causes a mixture of broadening and shifting of the bonding adlevel–TiSR state. A state located in the middle of the UVB is mainly broadened (case b in Fig. 9), while a state at the edge of the UVB is mainly shifted away from the UVB center of mass (cases a and c in Fig. 9).
Evidence for this concerted coupling is given by detailed analyses of the calculated adsorbate-induced DOS’s (DOS’s) and of real-space visualizations of the Kohn-Sham wave functions. These show that upon adsorption, there are (i) a sharp decrease in DOS at the TiSR energy; (ii) a sharp increase of DOS just above the TiSR energy; (iii) depending on the adatom species, narrow or broad bands of mainly adatom character at the edge of or within the substrate UVB energy range, respectively; (iv) a depletion of X-localized UVB states at the XSR energies; and (v) a formation of adatom-localized sub-peaks in between the energies of the substrate XSR’s. Points (i)–(iii) show that bonding and antibonding adlevel–TiSR states are formed, while points (iii)–(v) prove a coupling between the bonding adlevel–TiSR state and the XSR’s in the substrate UVB.
More detailed analyses of the trends in calculated DOS’s and Kohn-Sham wave functions for second- and third-period adatoms on TiX(111) surfaces show that (i) the magnitude of the DOS reduction at the TiSR energy decreases successively as the adatom number increases along a period and (ii) the adatom–X bonding character of the adatom-localized peaks increases as the adatom number increases along a period. These trends, which arise from the successive lowering of the adlevel energy as increases, indicate that the adatom–TiSR coupling decreases in strength along each adatom period, towards the right in the periodic table, while the contribution of the XSR’s to the bonding increases.
Such trends provide a basis for understanding the calculated trends in atomic adsorption energies. For instance, the maximum for the group-VI adatoms (O and S) is explained in terms of a stronger coupling to the substrate CSR’s. On the other hand, the weaker bonding of group-VII adatoms (F and Cl) is explained by a weakened coupling to the CSR’s, due to the adatom state being almost fully ionized by its interaction with the TiSR. Thus, the F and Cl adsorbates lack almost any covalent interaction with the substrate UVB and their adsorption is practically ionic in nature, as confirmed by Bader and charge-density analyses. Also, the almost equal adsorption strengths of C and N can be explained in terms of the opposite trends in adatom–TiSR and adatom–CSR coupling strengths found for varying values.
On the same basis, the CCM is also able to describe changes in adsorption energies arising from changes in adsorption site, i.e., between fcc, hcp, and top O adatoms on TiC().RuLu07
V.2 Generalization of the CCM to other TMC’s
The calculated energetics and electronic structures of atomic adsorption on the TMC() surfaces described in Section III can be analyzed in the same way as described above for TiX().
The fact that upon adsorption the TMSR’s and CSR’s are quenched on all considered surfaces shows that both types of resonance participate in the substrate–adatom bond. The strong character of the adatom–TMSR bonds is evidenced by the formation of well-separated bonding and antibonding states of mixed adatom and TM character, at energies below and above the TMSR’s, respectively. The weak character of the adatom–CSR bonds is confirmed by the broadening and/or shift of the bonding adatom–TMSR level.
The exception is ScC(), on which the adatom–CSR coupling approaches a strong NA character, with a strong depletion of CSR states in the middle of the UVB and the formation of separated bonding and antibonding states below and above the UVB, respectively. This is due to the stronger CSR’s on this surface, which in turn arises from the stronger C–C bonds in bulk ScC than in the other TMC’s.VoRu09 Also, the adatom–TMSR coupling is qualitatively different on ScC(111), compared to the other TMC’s, as the TMSR of clean ScC(111) lies above and is thus empty before adsorption.
Thus, the basic adsorption mechanism is the same on all the considered TMC() surfaces, implying that the general applicability of the CCM includes TMC() surfaces. In addition, ScC(111) provides a playground for testing the contribution of the adlevel–CSR coupling to the total adsorption strength.
In the following, we give more explicit support to the applicability of the CCM to the TMC() surfaces by showing that the CCM can be used to understand the major features of the calculated atomic and molecular adsorption-energy trends on the considered TMC() surfaces.
V.3 Adsorption trends with respect to substrate and CCM
Figure 4(b) shows the calculated energy values for atomic adsorption on TMC() surfaces as functions of the substrate TM group number. In this subsection we show that the CCM can capture its main trends.
In a simple molecular two-level picture, the strength of a bond is related to the energy shift between the levels of the isolated constituents and of the hybridized states resulting from the coupling. In a simplified version of the Newns model, an adsorbate and the active part of the substrate can be viewed as such a “molecule”.Newns Accordingly, from the calculated DOS’s the bond strength can be extracted as the energy difference between the final bonding adatom level (i.e., after coupling to both TMSR and CSR’s) and the TMSR peak in the surface DOS. The CCM is then able to explain the trends in bond strength by relating this energy difference to concerted adatom–TMSR and adatom–CSR interactions.
In the following, we employ such an approach to understand the qualitatively different trends in values for C and O adatoms, as the substrate TM group number increases from IV to VI [Fig. 4(b)].
For C, the values are approximately constant between groups IV and VI. The calculated DOS’s (see Fig. 5) show that the final bonding adatom level lies at the upper edge of the UVB on all considered substrates. Thus on all these substrates, the energy difference between the final adatom level and the original substrate TMSR is approximately constant. This implies that the result of the concerted action of the adatom–TMSR and adatom–CSR’s interactions is approximately constant. In particular, Fig. 5 shows that the DOS’s of all substrates resemble the same NA type of adlevel–CSR’s interaction, that is, type c in Fig. 9.
For O, with its lower level, the values decrease strongly as the substrate TM group number increases from IV to VI. This is reflected in the calculated DOS’s (Fig. 6) by a strongly decreasing energy difference between the final adatom level and the original substrate TMSR peak. Thus, in contrast to C, for O the concerted action of the two types of coupling yields qualitatively different results. In particular, Fig. 5 shows DOS’s that correspond to adlevel–CSR’s interactions that vary in a qualitative way from (cf. Fig. 9) NA case a (on group IV), to NA case b (on group V), and to NA case c (on group VI). As a consequence, the adlevel–CSR’s interactions cause a downward energy shift (on group IV), a broadening (on group V), and an upward energy shift (on group VI) of the bonding adlevel.
We also notice that for both adsorbates the antibonding adatom–TMSR level lies above (and is thus empty) for all substrates except the group-VI TMC’s -MoC and WC. This filling of antibonding states implies an extra decrease in adatom–TMC bond strength, as group V VI. Indeed, this can be seen in the calculated trend for C [Fig. 4(b)].
For all adsorbates except F, the calculated values increase from ScC() to TiC(). As described above, the adlevel–CSR’s interaction is more pronounced on ScC() than on the other TMC’s, thus approaching the strong NA limit. Also, the adatom–TMSR coupling is qualitatively different on ScC(), due to the TMSR of clean ScC() lying above and being thus empty before adsorption. The weaker adsorption on ScC() can thus be understood to be due to the qualitatively different interaction with the two types of SR’s.
V.4 Adsorption trends with respect to adsorbate and CCM
The adsorption-energy trends with respect to adsorbate [Fig. 4(a)] show ”M“-shaped trends for most of the considered TMC’s. The trend on TiC() was analyzed in Ref. RuLu07, and explained within the CCM to arise from competing opposite trends in adsorbate–TMSR and adsorbate–CSR’s interactions.
The calculated DOS’s for the here considered TMC’s (illustrated for VC in Fig. 7) show trends that are similar to those found for TiC. At the same time, the trends for all considered TMC’s resemble the one on TiC(), with a local maximum for the O adatom. However, on group-V TMC’s the calculated values for O are approximately equal to the ones for C, and on group-VI TMC’s the O values are smaller than the ones for C. Thus, the chemisorption strength of O appears to weaken relative to C as the substrate TM group number increases. This can be understood to be a consequence of the different trends for C and O that were described in Sec. V.3 above, with the adsorption strength decreasing much faster for O than for C as the TM group number increases from IV to VI.
On the other hand, the values for ScC() show a monotonic increase between B and O adatoms. As described above, the adlevel–CSR’s interaction is stronger on ScC() than on the other considered TMC() surfaces. Therefore, the monotonically increasing trend (as B O) of the adlevel–CSR’s coupling contribution to the adatom–TMC bond is stronger on ScC().
Finally, on all substrates there is a sharp decrease in adsorption energy, as O F. This arises from the weakened adlevel–CSR’s interaction, which is due to the fact that the adatom is almost fully ionic from its interaction with the TMSR, as described previously on TiC().RuLu07
V.5 Molecular adsorption and CCM
The adsorption energies of the considered molecular adsorbates NHx () on VC() show a decreasing trend as increases (Table 6). This trend can be understood in terms of the CCM as arising from the concerted coupling between each molecular orbital and the two types of SR’s.
The quenchings of both TMSR and CSR’s in the calculated DOS’s for NHx on VC() (Fig. 8) indicate the presence of couplings to both types of SR’s. In addition, the adsorbate-projected LDOS’s show strongly bound sharp peaks of mixed N and H character as well as more delocalized regions of only N character within the UVB. A comparison with calculated DOS’s for the free NHx molecules shows that the sharp peaks correspond to low-energy molecular levels that interact weakly with the substrate SR’s. On the other hand, the delocalized regions arise from the coupling of higher-energy molecular levels with the SR’s, in a way that is similar to the adsorption of atomic N. Figure 8 shows that as the number of H atoms in the molecule increases, the interaction of the higher-energy molecular levels with the SR’s weakens, thus lowering the adsorption strength.
V.6 Applicability of the CCM
The above discussion shows that for the atomic and molecular adsorption on the TMC() surfaces a picture based on the concerted action of two types of adatom–substrate interactions applies. It can be used to describe key features of the calculated adsorption-strength and electronic-structure trends. In this concerted-coupling model (CCM), two types of SR’s participate in the bond, TM-localized SR’s (TMSR) and C-localized SR’s (CSR). Therefore we conclude that the CCM is valid for atomic adsorption on all the considered TMC(111) surfaces.
V.7 Descriptor for adsorption on TMC():
To be able to describe the variations in adsorption strength in a simple yet efficient way, a descriptor , defined as the mean energy of the TMSR, can be introduced.VoHeRuLu09 Due to the approximately constant energy difference between TMSR and CSR’s in the considered compounds, such a descriptor is able to capture the important variations of both TMSR and CSR energy trends while being at the same time both conceptually simple and measurable or calculable.
This is confirmed by Fig. 10, which shows a linear correlation between our calculated values and for each of the considered atomic adsorbates, also when the results of Ref. VoHeRuLu09, are significantly extended. The exception is ScC(), which is a consequence of the mentioned qualitative difference in electronic structure of this surface, that is, an empty TMSR and a strong adlevel–CSR coupling. As discussed above, the variations in the gradients of the lines for the different adsorbates can be understood within the CCM from the details in the interactions between the adlevel and the different SR’s.
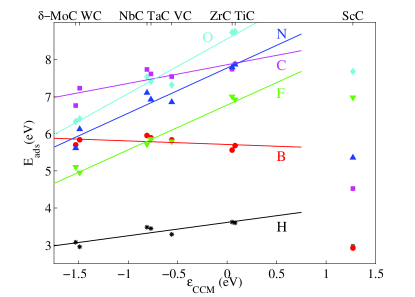
In Ref. VoHeRuLu09, , linear correlations are also found between and the molecular adsorption energies of NH, NH2, and NH3, as well as the activation-energy barriers for N2. This is a consequence of the fact that both atomic and molecular adsorptions appear to follow the same basic mechanisms of the CCM, as argued above. As a consequence, we show in Ref. VoHeRuLu09, that scaling and Brønsted-Evans-Polanyi (BEP) relations apply for adsorption on TMC(111) surfaces. Such findings are of importance for the design of new catalysts.
VI Conclusions
The possibility to understand materials has today increased considerably, as DFT has developed into a predictive theory. One obvious application of DFT is to calculate numbers for bonding strengths, structure parameters and coordinates, etc. Another, slightly more demanding, application is to look for more detailed information and develop conceptual frameworks and models in which we can formulate our understanding and on which we can base our further thinking, including ideas about new materials. We have found that various densities of states (DOS’s) are excellent tools for such understanding and vehicles for thought. In our approach, extensive use of total, local, projected, and difference DOS’s are cornerstones in the building-up of a conceptual framework and model.
This study deals with understanding the atomic and molecular adsorption on the TMC() surfaces using such a detailed electronic structure analysis approach. By extensive DFT calculations on ScC, TiC, VC, ZrC, NbC, -MoC, TaC, and WC, we study trends in clean surface properties, adsorption energies, and various DOS’s. In brief, we find that only a certain part of the surface-localized electronic structure, corresponding to the TM-localized (TMSR) and the C-localized (CSR) surface resonances (SR’s) are of importance to understand the trends in adsorption energies from one TMC surface to another and from one adsorbate to another. Despite the TM termination of the investigated TMC surfaces, the second-layer C atoms are found to play a crucial role in the chemisorption. This is particularly evident on the ScC() surface, where the TMSR is empty and where the CSR’s are particularly strong.
Having thus identified the key parameters, we possess the foundations for a concerted-coupling model (CCM) in which trends in adsorption strength are the result of a concerted action of both adsorbate–TMSR and adsorbate–CSR’s couplings. This has earlier been shown for the TiC and TiN () surfacesRuLu07 ; RuVoLu06 ; RuVoLu07 but the breadth and versatility are here shown by applications to other TMC’s and trends, including: adsorption trends with respect to substrate, adsorption trends with respect to atomic adsorbate, adsorption trends on ScC(), adsorption trend for group-VII adatoms, and molecular-adsorption trends. This deepens the interpretation of the model and broadens its usefulness.
The applicability of the CCM to both atomic and molecular adsorption opens up the possibility to study reactions for, e.g., catalytic applications on this class of materials. For example, it allows the formulation of a single descriptor for the adsorption strength.VoHeRuLu09 Also, it implies the existence of scaling relations between molecular and atomic adsorption strengths as well as Brønsted-Evans-Polanyi relations.VoHeRuLu09
Since the CCM framework is based on rudimentary bonding principles with general applicability, we believe that it is possible to generalize it to other materials that possess surface-localized states. We have already shown its applicability to atomic adsorption on TiN()RuVoLu06 ; RuVoLu07 and believe that the same chemisorption mechanism should be valid for other nitrides. Ligand and vacancy systems have been shown to belong to the group of materials where the CCM applies,VoHeRuLu09 as do certain TM surfaces,VoHeRuLu09 where, however, it does not need to replace the sufficient and natural d-band model. Natural extensions should include TM oxides, sulfides, and borides. Design of materials, including atomic-scale engineering, is also an enticing prospect for further applications.
Acknowledgments
Valuable discussions with Anders Hellman are acknowledged. The calculations were performed at HPC2N and NSC via the Swedish National Infrastructure for Computing. B. I. Lundqvist gratefully acknowledges support from the Lundbeck foundation (Denmark) via the Center for Atomic-scale Materials Design.
References
- (1) R. B. Levy and M. Boudart, Science 181 547 (1973).
- (2) J. G. Chen, Chem. Rev. 96, 1477 (1996); H. H. Hwu and J. G. Chen, Chem. Rev. 105, 185 (2005) and references therein.
- (3) M. Halvarsson and S. Vuorinen, Int. J. Refract. Met. Hard Mater. 15 169 (1997).
- (4) H. G. Prengel, W. R. Pfouts, and A. T. Santhanam, Surf. Coat. Technol 102 183 (1998).
- (5) H. Itoh, T. Ichinose, C. Oshima, T. Ichinokawa, and T. Aizawa, Surf. Sci. 254 L437 (1991).
- (6) J. Günster, M. Baxendale, S. Otani, and R. Souda, Surf. Sci. 494 L781 (2001).
- (7) C. Ruberto, and B. I. Lundqvist, Phys. Rev. B 75, 235438 (2007).
- (8) A. Vojvodic, C. Ruberto and B. I. Lundqvist, Surf. Sci. 600, 3619 (2006).
- (9) C. Ruberto, A. Vojvodic and B. I. Lundqvist, Surf. Sci. 600, 1612 (2006).
- (10) C. Ruberto, A. Vojvodic and B. I. Lundqvist, Solid State Commun. 141, 48 (2007).
- (11) A. Vojvodic, A. Hellman, C. Ruberto, and B. I. Lundqvist, Phys. Rev. Lett. 103, 146103 (2009).
- (12) J. Sehested, K. E. Larsen, A. L. Kustov, A. M. Frey, T. Johannessen, T. Bligaard, M. P. Andersson, J. K. Nørskov, and C. H. Christensen, Top. Catal. 45, 9 (2007).
- (13) F. Abild-Pedersen, J. Greeley, F. Studt, J. Rossmeisl, T. R. Munter, P. G. Moses, E. Skulason, T. Bligaard, J. K. Nørskov, Phys. Rev. Lett. 99, 016105 (2007).
- (14) F. Studt, F. Abild-Pedersen, T. Bligaard, R. Z. Sørensen, C. H. Christensen, and J. K. Nørskov, Science 320, 1320 (2008).
- (15) J. K. Nørskov, T. Bligaards, J. Rossmeisl, and C. H. Christensen, Nature Chemistry 1, 37 (2009).
- (16) M. Aono, C. Oshima, S. Zaima, S. Otani, and Y. Ishizawa, Jpn. J. Appl. Phys. 20, L829 (1981).
- (17) J. Rundgren, Y. Gauthier, R. Baudoing-Savois, Y. Joly, and L. I. Johansson, Phys. Rev. B. 45, 4445 (1992).
- (18) Y. Hwang, T. Aizawa, W. Hayami, S. Otani, Y. Y. Ishizawa, and S.-J. Park, Surf. Sci. 271, 299 (1990).
- (19) K. Edamoto, E. Miyazaki, and H. Kato, Vacuum 41, 547 (1990).
- (20) W. Hayami, R. Souda, T. Aizawa, S. Otani, and Y. Ishizawa, Phys. Rev. B. 47, 13752 (1993).
- (21) T. Aizawa, R. Souda, S. Otani, Y. Ishizawa, and C. Oshima, Phys. Rev. B 42, 11469 (1990).
- (22) S. L. Hulbert, C. C. Kao, R. F. Garrett, R. A. Yang, J. Vac. Sci. Technol. A 9, 1919 (1989).
- (23) J. H Weaver, A. M. Bradshaw, J. F. van der Veen, F. J. Himpsel, D. E. Eastman, and C. Politis, Phys. Rev. B 22, 4921 (1980).
- (24) S. Zaima, Y. Shibata, H. Adachi, C. Oshima, S. Otani, M. Aono, and Y. Ishizawa, Surf. Sci. 157, 380 (1985).
- (25) K. Edamoto, T. Anazawa, A. Mochida, T. Itakura, E. Miyazaki, H. Kato, and S. Otani, Phys. Rev. B 46, 4192 (1992).
- (26) K. Edamoto, T. Anazawa, S. Tokumitsu, A. Tanabe, R. Sekine, E. Miyazaki, H. Kato, and S. Otani, Solid State Commun. 5, 435 (1996).
- (27) K. Edamoto, Y. Abe, T. Ikeda, N. Ito, E. Miyazaki, H. Kato, and S. Otani, Surf. Sci. 237, 241 (1990).
- (28) T. Anazawa, S. Tokumitsu, R. Sekine, E. Miyazaki, K. Edamoto, H. Kato, and S. Otani, Surf. Sci. 328, 263 (1995).
- (29) A. M. Bradshaw, J. F. van der Veen, F. J. Himpsel, and D. E. Eastman, Solid State Commun 37, 37 (1980).
- (30) R. Souda, C. Ohima, S. Otani, Y. Ishizawa, and M. Aono, Surf. Sci. 199, 154 (1988).
- (31) K. Edamoto, E. Miyazaki, T. Anazawa, A. Mochida, and H. Kato, Surf. Sci. 269, 389 (1992).
- (32) K. Edamoto, A. Mochida, T. Anazawa, T. Itakura, and E. Miyazaki, Phys. Rev. B 46, 7127 (1992).
- (33) S. Tokumitsu, T. Anazawa, A. Tanabe, R. Sekine, E. Miyazaki, K. Edamoto, H. Kato, and S. Otani, Surf. Sci. 351, 165 (1996).
- (34) T. Nakane, T. Noda, K. Ozakawa, and K. Edamoto, Surf. Sci. 433-435, 180 (1999).
- (35) T. Noda, M. Yamazaki, K. Ozawa, K. Edamoto, and S. Otani, Surf. Sci. 450, 27 (2000).
- (36) I. Kojima, M. Orita, E. Miyazaki, S. Otani, and Y. Ishizawa, Surf. Sci. 160, 153 (1985).
- (37) K. Edamoto, T. Anazawa, E. Shiobara, M. Hatta, and E. Miyazaki, Phys. Rev. B 43, 3871 (1991).
- (38) W. Hayami, R. Souda, T. Aizawa, S. Otani, and Y. Ishizawa, Surf. Sci. 346, 158 (1996).
- (39) T. Aizawa, W. Hayami, R. Souda, S. Otani, T. Tanaka, and Y. Ishizawa, Surf. Sci., 357, 645 (1996).
- (40) K. E. Tan, M. W. Finnis, A. P. Horseld, and A. P. Sutton, Surf. Sci. 348, 49 (1996).
- (41) Y. F. Zhang, J. Q. Li, and L. X. Zhou, Surf. Sci.488, 256 (2001).
- (42) J. R. Kitchin, J. K. Nørskov, M. A. Barteau, and J. G. Chen, Catal. Today 105, 66 (2005).
- (43) Y.-F. Zhang, J.-Q. Li, K.-N. Ding, W.-K. Chen and L.-X. Zhou, Acta Phys.-Chim. Sin. 19, 40 (2003).
- (44) S. R. Bahn and K. W. Jacobsen, Comput. Sci. Eng. 4, 56 (2002); http://wiki.fysik.dtu.dk/dacapo.
- (45) D. Vanderbilt, Phys. Rev. B 41, R7892 (1990).
- (46) K. Burke, J. P. Perdew, and Y. Wang, in Electronic Density Functional Theory, Recent Progress and New Directions, edited by J. F. Dobson, G. Vignale and M. P. Das (Plenum Press, New York and London 1998); pp. 81–111.
- (47) H. J. Monkhorst and J. D. Pack, Phys. Rev. B 13, 5188 (1976).
- (48) L. Bengtsson, Phys. Rev. B 59, 12301 (1999).
- (49) R. F. W. Bader, Chem. Rev. 91, 893 (1991).
- (50) G. Henkelman, A. Arnaldsson, and H. Jonsson, Com. Mat. Sci. 36, 354 (2006).
- (51) A. Vojvodic and C. Ruberto, Submitted.
- (52) S. V. Dudiy and B. I. Lundqvist, Phys. Rev. B 69, 125421 (2004).
- (53) F. Viñes, C. Sousa, F. Illas, P. Liu, and J. A. Rodriguez, J. Phys. Chem. C, 111, 1307 (2007).
- (54) P. W. Tasker, J. Phys. C: Sol. Stat. Phys. 12, 4977 (1979).
- (55) F. Jona and P. M. Marcus, in The Structure of Surfaces II, edited by J. F. van der Veen and M. A. Van Hove (Springer, Berlin, 1988) p. 90; K. Heinz, Surf. Sci. 299/300, 433 (1994); and references therein.
- (56) P. J. Feibelman, Surf. Sci. 360, 297 (1996).
- (57) C. Ruberto, Y. Yourdshahyan, and B. I. Lundqvist, Phys. Rev. Lett. 88, 226101 (2002).
- (58) M. Tsukada and T. Hoshino, J. Phys. Soc. Jpn. 51, 2562 (1982).
- (59) B. Hammer, L. B. Hansen, and J. K. Nørskov, Phys. Rev. B, 59, 7413 (1999).
- (60) S. Kurth, J. P. Perdew, and P. Blaha, Int. J. Quantum Chem. 75, 889 (1999).
- (61) B. Hammer and J. K. Nørskov, Adv. Catal. 45, 71 (2000).
- (62) T. Bligaard, and J. K. Nørskov, in Chemical Bonding at Surfaces and Interfaces, edited by A. Nilsson, L. G. M. Pettersson, and J. K. Nørskov (Elsevier, Amsterdam, 2008).
- (63) B. Hammer and J. K. Nørskov, Surf. Sci. 343, 211 (1995).
- (64) B. Hammer and J. K. Nørskov, Nature 376, 238 (1995).
- (65) T. Bligaard, J. K. Nørskov, and B. I. Lundqvist, in Handbook of Surface Science Vol. 3, edited by E. Hasselbrink and B. I. Lundqvist (Elsevier, Amsterdam, 2008).
- (66) E. M. Fernández, P. G. Moses, A. Toftelund, H. A. Hansen, J. I. Martinez, F. Abild-Pedersen, J. Kleis, B. Hinnemann, J. Rossmeisl, T. Bligaard, and J. K. Nørskov, Angew. Chem. Int. Ed. 47, 4683 (2008).
- (67) P. W. Anderson, Phys. Rev. 124, 41, (1961).
- (68) D. M. Newns, Phys. Rev. 178, 1123 (1969).
- (69) T. B. Grimley, J. Vac. Sci. Technol. 8, 31, (1971).
- (70) M. C. Desjonquères and D. Spanjaard, Concepts in Surface Physics, Springer-Verlag, Berlin Heidelberg, (1993).