Phase Behavior of Colloidal Superballs: Shape Interpolation from Spheres to Cubes
Abstract
The phase behavior of hard superballs is examined using molecular dynamics within a deformable periodic simulation box. A superball’s interior is defined by the inequality , which provides a versatile family of convex particles () with cube-like and octahedron-like shapes as well as concave particles () with octahedron-like shapes. Here, we consider the convex case with a deformation parameter between the sphere point () and the cube (). We find that the asphericity plays a significant role in the extent of cubatic ordering of both the liquid and crystal phases. Calculation of the first few virial coefficients shows that superballs that are visually similar to cubes can have low-density equations of state closer to spheres than to cubes. Dense liquids of superballs display cubatic orientational order that extends over several particle lengths only for large . Along the ordered, high-density equation of state, superballs with exhibit clear evidence of a phase transition from a crystal state to a state with reduced long-ranged orientational order upon the reduction of density. For , long-ranged orientational order persists until the melting transition. The width of coexistence region between the liquid and ordered, high-density phase decreases with up to . The structures of the high-density phases are examined using certain order parameters, distribution functions, and orientational correlation functions. We also find that a fixed simulation cell induces artificial phase transitions that are out of equilibrium. Current fabrication techniques allow for the synthesis of colloidal superballs, and thus the phase behavior of such systems can be investigated experimentally.
I Introduction
As the ability to control size, shape, and structure of nanoparticles Sun and Xia (2002); Grzelczak et al. (2008); Tao et al. (2008) and colloids Brown et al. (2000); Zhao et al. (2007); Snoeks et al. (2000) improves, computer simulation and theory of hard-particle systems becomes increasingly important to the identification of technologically useful properties. Hard convex particles have been used as models for simple atomic liquids and solids as a means to connect the particle shape and excluded volume to the entropy and to the equilibrium phase diagram of a system. The hard-sphere model has a rich history and continues to provide deep insights into fundamental physical phenomena Kirkwood et al. (1950); Metropolis et al. (1953); Alder and Wainwright (1957); Ree and Hoover (1964); Hoover and Ree (1968); Carnahan and Starling (1969); Speedy (1998); Torquato (2002); Skoge et al. (2006). However, nonspherical hard particles exhibit more complex phase behavior than hard spheres, since the possibility of anisotropic phases arises, including smectic, nematic, columnar, and cubatic liquid crystals Allen et al. (1993).
The cubatic phase has garnered recent attention because, unlike other liquid-crystalline phases, it is characterized by ordering in three mutually perpendicular directions while the particles retain translational mobility John et al. (2004). Such unusual ordering may lead to novel optical, rheological, or transport properties. The cubatic phase has been discovered in several hard-particle systems. Cut hard spheres of certain aspect ratios form small stacks that align perpendicularly to neighboring stacks Veerman and Frenkel (1992). The Onsager cross, a particle consisting of three thin rods aligned along orthogonal axes and intersecting at their midpoints Blaak and Mulder (1998) and tetrapods, hard bodies formed by four rods connected at tetrahedral angles Blaak et al. (2004), are examples of nonconvex particles that exhibit cubatic ordering. The cubatic phase also arises in systems of perfect tetragonal parallelepipeds John et al. (2008) as well systems of cuboids, nonconvex particles consisting of an array of tangent hard spheres that approximate tetragonal parallelepipeds John et al. (2004); John and Escobedo (2005). Perfect tetragonal parallelepipeds have sharp corners and flat faces while the cuboid is “bumpy” to approximate friction. Monte Carlo simulation studies of these particles revealed a cubatic phase, or parquet phase for aspects ratio other than 1:1:1, that arises between the liquid and crystal phases John et al. (2004); John and Escobedo (2005); John et al. (2008).
In this paper, we use molecular dynamics (MD) to investigate the equilibrium phase behavior and the onset of cubatic ordering in systems of cube-like superballs. A superball is a centrally symmetric particle defined by Jiao et al. (2009)
| (1) |
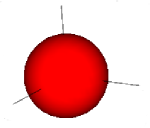
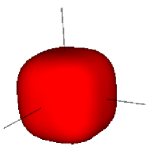
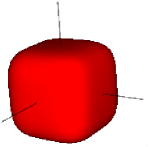
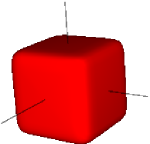
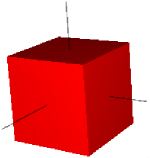
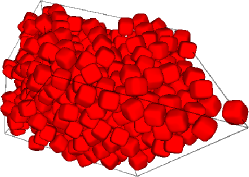
where and are Cartesian coordinates and is the deformation parameter foo (a). Superballs can take on concave shapes ranging from a cross () to the convex octahedron () to a sphere () and finally to a cube (). We focus on the “cube-like” range to examine the interpolation from spheres to cubes and reveal the role of particle shape and curvature on cubatic ordering. As is increased from unity, the particle takes on more cube-like characteristics as edges and corners sharpen while faces flatten. Figure 1 displays several superballs with their principal axes for the deformation from unity to infinity.
For a system of superballs, the packing fraction is the fraction of space occupied by the particles, , where is the number density, is the volume of a superball,
| (2) |
, and is the Euler gamma function Jiao et al. (2009). In this study, we do not consider the family of superballs for which . Superballs are well-suited to study the effect of the curvature of edges and corners. Although experimentalists have the ability to control shape and symmetry of colloidal particles, controlling the curvature may be a larger challenge. Scanning electron micrographs of nanoparticles reveal that edges and corners are not necessarily sharp like perfect hard polyhedra Tao et al. (2008). Therefore, understanding the effects of curvature of hard particles on the phase diagram is not only of fundamental interest, but also of practical importance.
In this study, we detail the phase diagram of hard superball systems as a function of and using molecular dynamics. To characterize the equilibrium phase behavior, it is useful to start a system in an equilibrium state and allow the particles to grow or contract (or equivalently, allow the simulation cell to shrink or expand). The ideal gas is a suitable initial condition to study low-density phases. Fast growth rates applied to liquids of hard superballs generate nonequilibirum, randomly jammed packings with novel characteristics Delaney and Cleary (2010); Jiao et al. (2010). However, slow growth rates can also result in nonequilibrium glasses and defective crystals and can limit access to complex, high-density equilibrium phases.
The densest-packing arrangement is a suitable initial condition for high-density phases since this arrangement minimizes free energy for a hard-particle system. This study was motivated by and made possible by the recent development of optimal packings for the entire family of superballs Elkies et al. (1991); Jiao et al. (2009). Jiao et al. determined the densest known, and likely optimal, packings of superballs Jiao et al. (2009) and superdisks, the two-dimensional analog Jiao et al. (2008). The optimal packings of spheres was proved rigorously only recently Hales (2005), and advances in the densest-known packings of aspherical particles, including ellipsoids Donev et al. (2004) and the Platonic and Archimedean solids Torquato and Jiao (2009a, b), will allow researchers to explore the entire phase diagram of these hard particles.
The low-density and liquid crystalline phases of many hard-particle systems have received significant research attention including those for cylinders Blaak et al. (1999), spherocylinders Veerman and Frenkel (1990), ellipsoids Straley (1974); Frenkel et al. (1984); Frenkel and Mulder (1985); Camp and Allen (1997), cut spheres Veerman and Frenkel (1992); Duncan et al. (2009), tetragonal parallelepipeds John et al. (2008), and parallel superellipsoids, a perturbation from ellipsoids to cylinders Martínez-Ratón and Velasco (2008). However, for many of these shapes, the optimal packings are yet to be identified (e.g. ellipsoids Donev et al. (2004)), and therefore, exploring the high-density equilibrium phases remains challenging.
In the following, we examine the liquid equation of state (EOS), structure of the liquid phase, and the virial expansion. For ordered, high-density phases of superballs, we examine the crystal branch EOS and use suitable order parameters and correlation functions to characterize the entropy-driven phase transitions and cubatic ordering. We find that
-
•
Excluded volume effects are dominated by edges and corners (Sec. IV.1),
-
•
There exists a phase transition along the ordered, high-density branch of the EOS that is associated with changes in long-ranged orientational order (Sec. IV.2),
-
•
The extent of orientational order increases with at all densities (Sec. V), and
-
•
Fixed system boundaries can produce apparent phase transitions in the ordered, high-density systems. (Appendix A)
The remainder of this paper is organized as follows. We introduce the deformable box molecular dynamics methodology, order parameters, and correlation function in Sec. II and review the equations of state for the hard-sphere and hard-cube systems in Sec. III. In Sec. IV.1, we compare the virial expansion and approximate equations of state to simulation data. In Sec. IV.2, we present the EOS for the ordered, high-density and crystal phases as generated with deforming box MD simulations and show the onset of cubatic ordering as a function of . The freezing transitions are examined in Sec. IV.3 while the phase diagram is illustrated in Sec. IV.4. The structural characteristics are investigated in Sec. V and discussions are provided in Sec. VI. In Appendix A, we discuss the role of system geometry on the isotropy of the internal stresses, particularly how fixed boundaries can induce apparent, misleading phase transitions.
II Methods
II.1 Molecular Dynamics
Simulation studies of the phase behavior of nonspherical particles typically use Monte Carlo simulation methods, primarily due to the simplicity of implementation. One drawback of Monte Carlo methods is the difficulty in achieving collective motion among the particles, which is often an important characteristic in systems of anisotropic phases. To generate the pressure equations of state for cube-like superballs, we use the Donev-Torquato-Stillinger (DTS) molecular dynamics algorithm Donev et al. (2005a, b); Donev (2006). The DTS algorithm generalizes the Lubachevsky-Stillinger sphere-packing algorithm Lubachevsky and Stillinger (1990) to nonspherical, convex particles including superballs and ellipsoids. In this algorithm, particles are allowed to grow at a specified nondimensional rate (or contract for ), or equivalently, the system is compressed (or expanded). Contact between particles is predicted using generalized overlap potentials.
The algorithm allows for shape deformation of the boundary using an approach similar to Parrinello-Rahman MD Parrinello and Rahman (1981). In Parrinello-Rahman MD, the “coordinates” of the simulation cell are continuously driven by the internal stresses of system which are directly related to particle interactions. However, in an event-driven simulation of hard particles, particles only interact upon contact and cannot directly interact with the cell. In this paper, a Parrinello-Rahman-like algorithm is employed where the “velocities” of the lattice vectors are updated after a certain number of collisions based upon the anisotropy of stress tensor Donev et al. (2005a); Donev (2006). The mass assigned to the cell is equal to that of the total mass of the particles.
In the work presented here, we have verified that the pressure tensor remains isotropic on average when employing the deforming box algorithm. Although this algorithm may not rigorously sample an isostress or constant-pressure ensemble, it is a reasonable approximation. We note that simulations using fixed boundaries exhibited pressure tensors that were anisotropic and gave rise to nonequilibrium phase behavior as detailed in the Appendix.
We limit our study to since the algorithm is numerically unstable for Donev (2006). Periodic boundary conditions were employed. The reduced pressure is defined as , where is the system’s pressure, is the number density, and is the usual energy scale for hard-particle systems. Particles are of unit “diameter,” the surface-to-surface distance of a chord along one principal axis (i.e. the shortest chord).
To obtain the liquid EOS, particles were placed randomly in a low-density configuration inside a cubic box. They were given random linear and angular velocities and allowed to grow at a specified rate until the system reached a defined pressure. For the crystal branch, particles were initialized in a slightly expanded form of the densest lattice configuration, with the number of particles chosen to be commensurate with the lattice, assigned random linear and angular velocities, and simulated using a contraction rate .
The densest-known packings of cube-like superballs occur in one of two families of Bravais lattices, denoted as and Jiao et al. (2009). For , the densest packings of superballs are achieved with the lattice, a perturbation of the FCC lattice. For superballs with , the lattice, a deformation of the simple cubic lattice, represents the densest arrangement. Since the MD algorithm is slow at high densities due to the high frequency of particle collisions, the initial crystal configurations were unsaturated, typically near 80% of the maximum possible packing fraction.
Growth rates in the range were utilized. The simulation data for spheres was compared to widely-accepted data and we find that equilibrium was well approximated with . Obtaining a full sweep of the density at required over two weeks of computation time with 1000 particles, and therefore significantly slower growth rates over the entire density range were not practical.
We more closely examined parts of the phase diagram in which phase transitions were evident by running the algorithm with slower rates using near-equilibrium configurations as the initial conditions. In some cases, we averaged over constant-density () MD trajectories consisting of nearly collisions per particle. We find that the phase transitions in the cases are slightly sharper than those in cases using slow growth or contraction rates but generally occur at the same densities. Growth rates of usually produced jammed, metastable structures. These are explored in separate studies Delaney and Cleary (2010); Jiao et al. (2010). For each , we obtained multiple, independent sweeps of the density for both the liquid and solid branches to examine the variability of the results. The results presented in this paper were obtained using 1000 particles. We have varied the system size between to 1728.
It is important to point out that no simulation method can effectively determine rare events. Even detailed free-energy calculations may encounter the inability to find states associated with rare events. Unfortunately, hard-particle MD requires serial calculations and advances in the parallelization of these algorithms are required to produce longer trajectories. Until then, these algorithms are the most efficient use of computer resources and can complement Monte Carlo methods that lack the ability to capture dynamics of collective motion.
II.2 Quantifying Order
Superballs have three equivalent principal, mutually orthogonal axes labeled and . For each axis , or of superball , there is an associated unit vector . For a nematic-forming system, there is at least one “director,” , which represents the most aligned direction in a system. For sufficiently anisotropic (large ) superballs, one might expect systems to have at least one nematic direction in a low-density phase and three orthogonal directions in a crystal phase.
Order parameters are useful to characterize the local and global order in a system of particles and several have been employed for particles with cubic symmetry John et al. (2008). We find that the nematic and cubatic order parameters, and respectively, are the most useful scalar metrics for quantifying orientational order. For cubatic ordering, a nematic order parameter can describe ordering in each direction and . The nematic order parameter for a particular set of axes , is defined as
| (3) |
where is the number of particles, is a set of particle axes, and is the director for direction . The solution to Equation (3) can be found by solving the eigenvalue problem where
| (4) |
where is the Kronecker delta function. is the maximum eigenvalue and the nematic director vector is the eigenvector associated with .
Since all principal axes of a superball are equivalent, we must “relabel” the particle axes prior to calculating in order to obtain meaningful data. A set of three mutually orthogonal unit vectors is chosen as a reference, typically the principal axes of one randomly chosen particle or the standard laboratory axes. For each particle, we relabel the particle axes based on the best alignment with the reference system. For example, we identify the axis of each superball that is best aligned with the vector, label these axes as axes, then continue with the vector and axes. The remaining axes are labeled as axes. A schematic of this procedure is shown in Ref. John et al. (2004). The relabeling scheme introduces artificial correlations so that in an isotropic system is approximately 0.55. For perfect cubatic ordering, in each of the three orthogonal directions. Here, we report as the maximum of the ’s since the ’s were nearly equal to each other in all of the cases considered. This suggests that we encountered isotropic and cubatic phases and not phases with strict uniaxial or biaxial order.
The cubatic order parameter is a more appropriate scalar metric for ordering in three orthogonal directions and is defined as
| (5) |
Here, is a unit director for which is maximized. The prefactor of arises from the accounting for the principal axes and normalizing to unity for perfect alignment. This can be formulated into a eigentensor problem as in Ref. Duncan et al. (2009). However, we use an approximate solution. We choose the maximum from a large set of trial directors . Here, we take the set of trial directors to be the set of all particle axes , providing trial directors. We report the maximum from this set of trial directors. For perfect cubatic ordering, , and for a system with no long-range cubatic order, .
We use an orientational correlation function to measure the mutual alignment of particles as a function of distance between particle centers. As a specific instance of a general class of orientational correlation functions Veerman and Frenkel (1992), is defined as
| (6) |
where the denotes the average over all axes and particle pairs and . The prefactor of accounts for all nine combinations of axes between particle pairs which is similar to the normalization of . In the limit that , approaches . This function allows us to determine local correlations whereas determines global order.
The local alignment between “neighbor” particles can be characterized by the angular distribution function defined for . The probability of finding two neighbor particles whose axes are aligned at an angle between and is given by . We consider two particles to be neighbors if they are separated by less than 1.35 diameters, since for most particles, this is between the first and second neighbor shells of the associated crystal. However, is relatively unaffected by small variations of the cutoff radius. For the perfect crystal of cube-like particles, , where is the Dirac delta function. At equilibrium, ) is symmetric about .
The order parameters derived from the spherical harmonics Steinhardt et al. (1983) were calculated but do not add significantly to our analysis. The use of a different reference crystal for each precludes our ability to compare superballs with different . Also, changes in these order parameters as a function of closely matched changes in and .
To examine translational order, we use the radial distribution function , which is the normalized pair density distribution function such that for a disordered system it tends to unity for large pair separation . In addition, one-dimensional particle distribution functions were calculated in each of the three associated one-dimensional directions of the crystal. When simulating the melting of the crystal, these particle distribution functions remained periodic until the crystal melted. This confirms that lower-dimensional translational order, such as that found in columnar or smectic phases, was never present.
II.3 Virial Coefficients
The virial expansion for hard particles in terms of reduced pressure is given by
| (7) |
where is the pressure, is the virial coefficient, and is the volume of a single particle. For hard, convex particles the second virial coefficient is known analytically as Isihara and Hayashida (1951), where and are the radius of mean curvature and surface area of a particle, respectively. Evaluating analytic expressions for these quantities is highly nontrivial, as was the case for ellipsoids Singh and Kumar (1996), but numerical calculation of the second and higher virial coefficients is straightforward given a suitable overlap function. We calculate the first few virial coefficients using Monte Carlo integration Metropolis et al. (1953). Trial configurations were generated using the method of Ree and Hoover Ree and Hoover (1964). For , random trial configurations were used. For , random configurations were generated until configurations satisfied the condition that particle 1 overlaps particle 2, 2 overlaps 3, and 3 overlaps 1. For , random configurations were produced until configurations satisfied the condition that particle 1 overlaps 2, 2 overlaps 3, 3 overlaps 4, and 4 overlaps 1. The standard deviations of ten subaverages were less than 0.5% of the virial coefficient. The algorithm was tested against known results for hard ellipsoids Vega (1997). We have calculated hard-cube virial coefficients to a higher accuracy than in Ref. Nezbeda and Boublík (1984) using the separating axis theorem to check for overlaps.
III Reference Systems: Hard Spheres and Hard Cubes
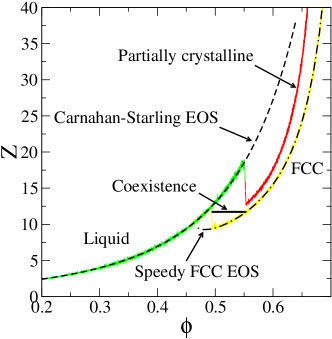
Since superballs interpolate between a sphere and cube for ranging from unity to infinity, we review the phase behavior of these reference systems. The hard-sphere liquid and crystal have been well-characterized by simulation and theoretical treatments. The hard-sphere EOS as generated by the DTS algorithm with and is shown in Fig. 2. Although the DTS algorithm does not achieve true equilibrium, which requires for long MD trajectories, the slow growth rate approximates equilibrium well. The DTS algorithm correctly produces the well-known and widely-accepted Carnahan-Starling EOS for liquids Carnahan and Starling (1969) and the empirically-derived Speedy EOS for the FCC crystal Speedy (1998).
The freezing and melting points of a hard-sphere system are and , respectively, with a coexistence pressure de Miguel (2008). In Fig. 2, one can see that the DTS algorithm produces a first-order phase transition at to a partially crystalline system when starting the system in a random initial configuration and allowing the particles to grow slowly at . This packing fraction is repeatable over independent runs and consistently occurred between and 0.553. Halving the growth rate to (not shown in figure) resulted in a freezing event at . Starting in the FCC crystal arrangement and using , the simulation data traces the Speedy EOS and the system shows a first-order transition at . The density at which the phase transitions occurred showed little variability, occurring between and 0.498 across multiple runs. Halving the rate to yielded a transition at . The algorithm evidently is appropriate for determining the densities at which phase transitions occur and identifying coexistence regions. The DTS algorithm, however, cannot explicitly identify the coexistence pressure, which requires extensive free-energy calculations. An equal-area construction of the pressure-volume equation of state may provide an approximation to the coexistence pressure.
There has been considerably less attention devoted the hard-cube system. However, several studies have elucidated the EOS, phase transitions, and orientational ordering. Parallel hard cubes undergo a continuous melting transition from a crystal to a liquid Jagla (1998); Groh and Mulder (2001). The EOS for parallel hard cubes has several gentle curvature changes but no evidence of a first-order phase transition Hoover et al. (2009).
However, we are interested in the EOS and phase transitions in systems of freely-rotating hard cubes. John et al. obtained the phase diagram for freely rotating hard cubes by Monte Carlo methods John et al. (2008) and their EOS is shown in Fig. 2. A first-order melting transition was first calculated to be between and 0.52 Jagla (1998). More recent studies reveal a narrower coexistence region between an isotropic and a cubatic phase to be in the region John et al. (2008). More interestingly, John and coworkers suggest that there is a cubatic-crystalline transition between and . However, the nature of the transition was not well-characterized and necessitated free-energy calculations for verification John et al. (2008). The DTS algorithm is numerically unstable for superballs with large and therefore, these Monte Carlo calculations are the best available reference data.
IV Equations of State
IV.1 Isotropic Liquid Phase
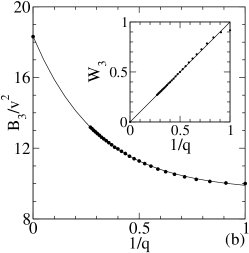
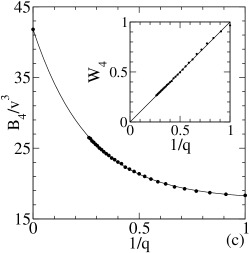
The low-order virial coefficients describe the low-density EOS of a system. The second, third, and fourth virial coefficients, shown in Fig. 3, monotonically increase with the deformation parameter . This is expected for and given that the cluster integrals involved in the calculations effectively measure excluded volume, and a larger particle generally yields a larger excluded volume. The effects on and higher-order coefficients are not intuitively obvious, since these coefficients are not necessarily strictly positive for hard particles. The virial coefficients are closely approximated by an exponential equation,
| (8) |
The values of the parameters obtained by nonlinear least-squares regression are given in Table 1. These parameters were the best obtained, though they are not guaranteed to be optimal due to the nonlinearity of the fit. The insets in Fig. 3 plot
| (9) |
versus to show that the scaling of is approximately linear with , except near the sphere point where the fit tends to degrade.
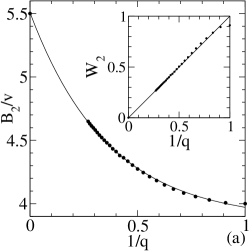
A significant portion of the excluded volume evidently arises from the particles’ edges and corners. Sharpening of edges and corners increases the excluded volume in an isotropic phase faster than it increases the actual volume of a particle. When visually comparing a superball with a moderately large value, say , to the perfect cube (see Fig. 1), one might surmise that because the two particles have such similar appearances, the two particles would have similar behavior in the liquid phase. However, when comparing , the relative excluded volume, for these two particle shapes, the superball with is closer to a sphere than to a cube. The edges and corners evidently are dominant features contributing to excluded volume effects.
| 1.638 | 8.759 | 24.077 | |
| 2.770 | 3.262 | 3.794 | |
| 3.869 | 9.564 | 17.715 |
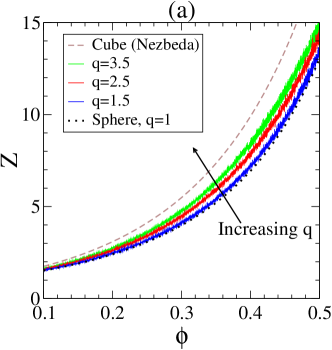
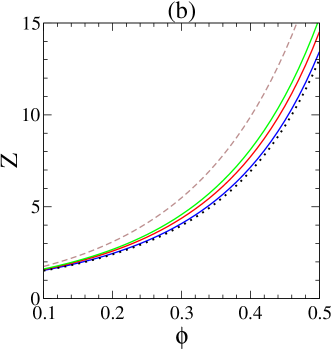
Fig. 4a shows the simulation data for several values for low densities. We compare our simulation results to the Nezbeda EOS Nezbeda et al. (1979); Boublik (1981), a modification of the Carnahan-Starling EOS Carnahan and Starling (1969) for convex hard particles. Using only the nonsphericity parameter , the Nezbeda EOS is given as
| (10) |
The Nezbeda curve, Fig. 4b, follows simulation data of superballs along the entire liquid branch for . For , the Nezbeda curve follows the simulation data at low densities, slightly underestimates pressures at moderate liquid densities, and slightly overestimates pressures at higher densities. For example, with , the Nezbeda curve is accurate for , underestimates the pressure for , and overestimates the pressure for . Using local polynomial fits to the simulation curves, we can compare the pressure values of the simulation curves to those of the Nezbeda equation of state. For , is less than 0.059 at , while for , is less than 0.138. At , is about -0.086. As shown by the simulation data, superballs that are visually similar to cubes have pressures midway between that of spheres and that of cubes, demonstrating the effects of sharp edges and corners on the low-density EOS.
IV.2 Ordered, High-Density Phases: Melting
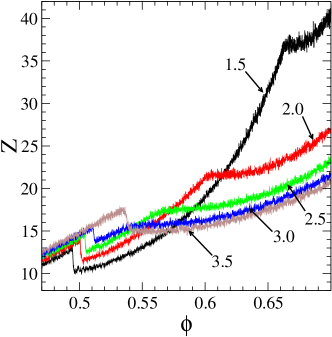
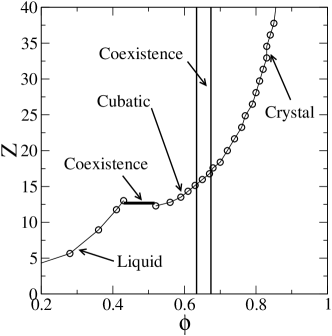
To obtain the ordered, high-density equations of state, systems were initialized in the optimal lattice configuration and a contraction rate of was applied until the system entered the fluid phase. Figure 5 illustrates the resulting equations of state for various values of . As seen in the figure for , there exist two apparent phase transitions, which result in three distinct phases. We define these phases, going from highest density to lowest, as the crystal (), cubatic (), and liquid () phases. For , only one phase transition is evident from the pressure EOS, separating the and phase.
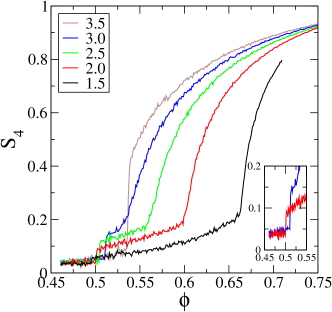
The phase is characterized by long-ranged translational and orientational order, quantifiable by the appropriate order metrics and distribution functions. We characterize the phase as having a moderate degree of long-ranged orientational order compared to the crystal phase. Particles are loosely braced and have an value above that of a dense liquid but less than that of a crystal, between values of 0.05 and 0.20. In this phase, crystalline translational order remains. While some have characterized the cubatic phase as having no long-ranged positional order Blaak et al. (1999), others also consider those phases with an “intermediate degree of translational order” as cubatic phases John et al. (2004); John and Escobedo (2005). We choose to use the latter definition of “cubatic,” since this was the definition employed for the use of hard cubes. The phase lacks long-ranged positional and orientational order.
The nematic and cubatic order parameters associated with the ordered, high-density phases are shown in Fig. 6. In all cases, the curve for exhibited more noise than the corresponding curve, possibly due to the “relabelling” scheme. Regardless, the behavior of both order metrics follows closely with the pressure equations of state. When the pressure-density curve is discontinuous or shows a change in curvature, the order parameters exhibited a corresponding change.
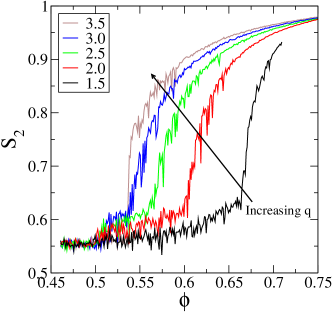
Beginning in the densest crystal and moving down along the EOS, the slope of the reduced pressure is discontinuous at the - transition. This transition point initially occurs at high densities for small . For increasing , this transition occurs at lower densities and by , the transition vanishes. As seen by the order parameters in Fig. 6, this transition results in a reduction in cubatic ordering. While the -density curve remains continuous at the transition, the slope does not, similar to the behavior of the pressure-density curve. Although the phase has less orientational order than the phase, there remains significant long-ranged cubatic order. At the melting transition from to or to , the nematic order parameters are discontinuous as shown in the inset of Fig. 6.
The - transition was observed in the EOS for , however, we strongly suspect that similar transitions occur for smaller and high pressure. Unfortunately, simulating the system for and proved challenging, both in the stability of the code and achieving near-equilibrium behavior. Because of the monotonic behavior of the location of the - transition with respect to , we suspect this to continue for near the sphere point. For , we do not observe a - transition, although it is possible that a - phase transition exists but is of a higher order. Higher-order phase transitions were suggested for hard cubes John et al. (2008), though in the case of nearly cubic superballs, there is no discontinuity in the cubatic order parameters aside from the first-order transition associated with melting. In addition, we have shown that edges and corners play an important role in the liquid EOS, and therefore, it is not unreasonable to expect that the high-density behavior of nearly cubic superballs () can deviate from that of hard cubes.
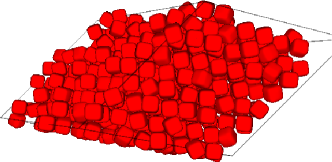
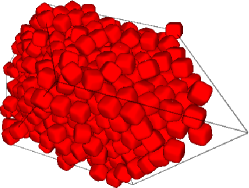
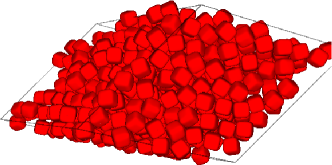
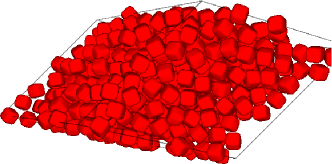
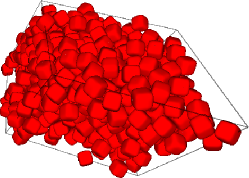
As the density is reduced in the phase, the cubatic order parameters smoothly decreases. At the - transition, the pressure jumps while and drop close to the values associated with random rotations. The - transition is clearly first order and is present for all tested. The density at which melting occurs increases monotonically from for hard spheres up to 0.536 for . While reducing the density along the high-density equation of state, the translational order appears to drop continuously. The peaks in maintain crystal-like characteristics. We discuss translational order in greater detail in the next section. Figure 7 shows a representative sample of the system at several densities in the and phases. The decreased orientational order associated with the phase is not easily distinguishable from the visual inspection but is clearly evident by the order parameters.
The decrease in the density associated with the - phase transition for increasing is attributed to the broadness of the edges and corners of particles as they relate to particle rotations. For each in the phase, particles are braced against rotations. Particle rotations require large local fluctuations in the density to allow for particle flips. As the relative lattice spacing is increased, the rotational mobility of the particles increases. With increasing , particles have sharper corners that are more effective in bracing against rotations for larger density ranges. The required local volume necessary for particle rotations increases with more cube-like shape, and therefore we observe a larger phase for increasing .
The increased rotational mobility of the phase also imparts larger internal stresses than in the phase, as observed by the greater slope of the pressure-density curve in the phase than the phase at the - transition. In Sec. VI, we detail some of the tests we performed to ensure that these results were not related to system-size, boundary, or kinetic effects.
IV.3 Ordered, High-Density Phases: Freezing
The freezing transitions for superballs were examined by applying a slow growth rate to particles initialized in a low-density liquid. Figure 8 shows the pressure as a function of packing fraction for two values of along with the crystal branch equation of state. In the figure, two growth rates are displayed, and . We find that upon freezing most systems order into a partially crystalline structure representative of a - transition. Across this transition, the pressure drops while the order parameters increase discontinuously. At high pressures, the particles increase the face-to-face contacts, but the nematic directors of the separate crystal regions destructively interfere. Therefore, the order parameters cannot achieve values as large as the equilibrium branch at the same density. The pressure of the partially crystalline phase is greater than that of the equilibrium structure, which is evident in Fig. 8. These systems have characteristics of translational order of a crystal but have a large grain boundary or vacancies. At very high pressures, the grains are eliminated by the shear deformation of the box. The structural characteristics of jammed superballs are detailed in Ref. Jiao et al. (2010).
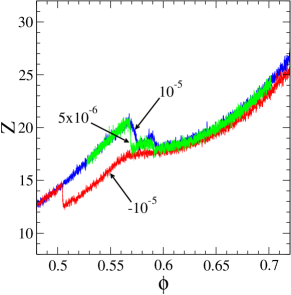
The - transition is sensitive to the extent of crystallization occurring at the - transition. In several cases, the system slightly overshoots the - transition while in other cases, the system never shows signs of a - transition. One might expect that using slower growth rates would alleviate this phenomenon. However, as seen in Fig. 8(a), slower growth rates are not necessarily better at achieving the - transition and tracing the crystal branch EOS. The density at which the crystallization from the phase to the phase occurs is relatively insensitive to the growth rate for the slow rates used in this study. It is of note that substantially faster growth rates produce amorphous, jammed structures Jiao et al. (2010).
For , we find that the initial freezing from a liquid phase occurs at a density higher than that of the - transition along the ordered, high-density branch which is shown in Fig. 8(b). In these cases, both growth rates, and , resulted in a second transition, presumably a - transition, and then approximated the curvature of the crystal branch. The pressure remained higher than that of the perfect crystal. The order parameters increase continuously after this freezing transition. For , we find that the - transitions along the growth and contraction branches approach one another. It is possible that relaxation times are faster for these values and that transition to a liquid state is more easily achieved.
IV.4 Phase diagram
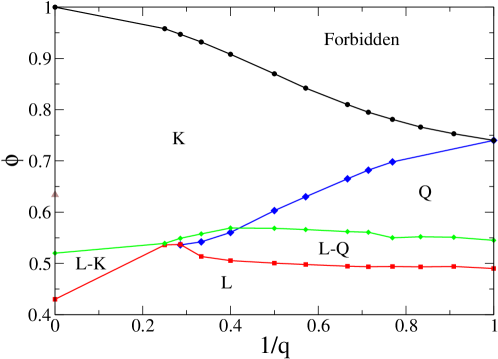
As with the case of spheres, we consider the density region between the - transition of the growth branch and the - transition of the contraction branch to be coexistence between these two phases. In Fig. 8, this coexistence region is presumed to be the region between sharp phase transitions along the growth and contraction branches. Using the results of the DTS algorithm and the quantification of orientational and translational order, the approximate phase diagram is shown in Fig. 9.
The black circles represent the densities of the and lattices at maximum packing. The blue diamonds represent the density of the - transition as found along the crystal branch. The precise boundary was determined using a linear regression of data points on either side of the transition and calculating their intersection. The red squares represent the first-order phase transition associated with the melting of the crystal. It is the last density at which the crystal was stable in our simulations. The green diamonds represent the freezing transition by allowing particles to grow slowly. The data points along the cube line () represents the transitions identified by the authors of Ref. John et al. (2008) with the brown triangle being the crystal-cubatic transition they identified.
While the - transition is monotonic in , the - transition is not. For , the - transition of the contraction branch lies at a density below the - transition on the growth branch as in Fig. 8(b). The apparent tie line grows slightly as increases from unity and begins to narrow significantly around . By , the - transition approaches the same density as the - transition. There are several possible explanations to the narrowing of the apparent coexistence region near . We may not observe the possible coexistence region due to the relaxation times in the system. The free-energy barrier associated with melting may be reduced for increasing and thus the crystal may be difficult to stabilize in a coexistence region. Alternatively, we may be observing microphase separation where the melting into a liquid phase is preferable to maintain the crystal phase. The system may also be large enough where certain domains of the system are liquid while others remain crystal, although we do not directly observe evidence for this phenomenon. Further refinement of the phase boundary would be necessary to answer these questions.
Detailed free-energy calculations are necessary to determine the precise phase boundaries, refine the approximation of the phase diagram shown in Fig. 9, and determine the coexistence pressures. One could approximate the coexistence pressure using an equal area construction of the two pressure branches. We expect that the coexistence pressures would be nonmonotonic in as well. The coexistence pressure for the sphere is , and for the cube, . Using Fig. 8(b) as an example after rescaling the axes appropriately, one can estimate the coexistence pressure to be much higher than 12.5. Ultimately, the free-energy calculations would definitively determine such a conjecture.
V Structural Characteristics
V.1 Liquid Phase
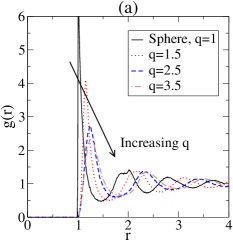
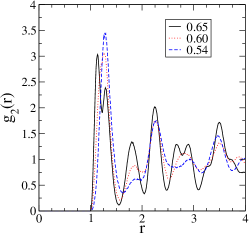
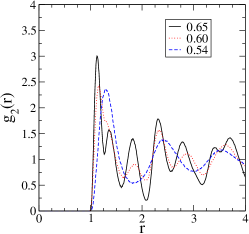
The liquid phase of superballs lacks long-range orientational and translational order but can show significant local order. Comparing systems at the same but for various values of , we find that increasing yields increased local orientational order but diminished local translational order. The radial distribution function for dense liquids at various for the common is shown in Fig. 10(a). The first peak in the is reduced with increasing , likely due to the interaction anisotropy building up in the liquid. Because of the anisotropy of the particle, contacting neighbors are not restricted to as they are for spheres, and thus the first peak in is lower than that for spheres.
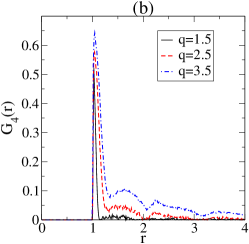
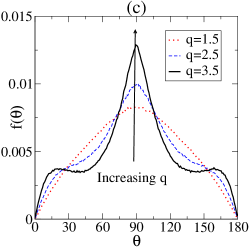
The strong peak in , defined by Eq. 6 at for all particle shapes, shown by in Fig. 10(b), shows that particles with cube-like shape have a strong preference to align orthogonally with contacting particles. Evidently, the existence of cube-like shape is sufficient to produce preferential cubatic alignment at contact, even for particles with just above unity and whose cube-like shape is difficult to see visually. The degree of curvature determines the range of order in the liquid phase. For larger , the orientational correlations persist for up to three diameters. Sharper corners effectively “brace” particles against rotations. The angular distribution function , Fig. 10(c), reinforces the notion of bracing. With sharper edges, nearest neighbors have a greater preference to align along mutually orthogonal directions in the liquid phase.
V.2 High-Density Phases
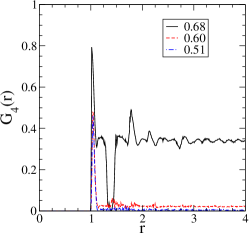
While measures the global orientational order in the system, the orientational correlation function provides insight in the locality of cubatic ordering. Figure 11 shows for several values. For in the phase, Fig. 11(a) and , the long-ranged orientational order is evident by the large value of for nearly all . Particles with “face-to-face” contacts at and those at pair distances associated with lattice sites are more strongly aligned than those that deviate from lattice sites. However, those pairs of particles that are separated by 1.35 diameters are misaligned, evidenced by which is nearly zero at this distance. Once the system enters the phase, orientational correlations remain local, although suggests there remains some global cubatic order. These local orientational correlations are slightly longer ranged than in the liquid phase, which results in a larger value of .
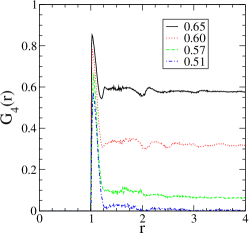
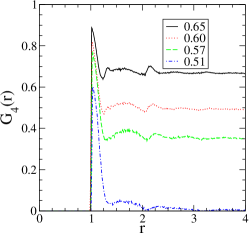
For larger , we observe similar trends, though particles are better stabilized at all pair distances. The bracing of particles with sharper edges prevent rotations at the pair distance of 1.35 diameters. For , Fig. 11(b) shows that has an initial maximum and minimum, followed by weak maxima and minima associated with neighbor distances. The general shape of the curve is maintained through all densities associated with the , aside from general loss of long-ranged order. In going from the to phase, the orientational correlations at long-ranged nearly vanish in the same manner as that of . Fig. 11(c) shows that the orientational correlations for are similar to those at . Surprisingly, the contact value of was relatively unaffected by the density in all cases. The degree of curvature and density have little influence on the ordering at contact, but rather it is the presence of cubic symmetry that produces alignment at .
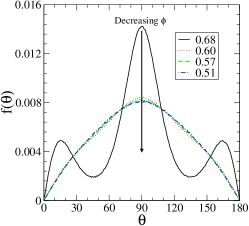
To further examine the local ordering environment, we used the angular distribution function , shown in Fig. 12 for several . This measures the correlations between the alignment of principal axes for neighboring particles. Local cubatic ordering is present when the function has three maxima but has minimal cubatic ordering when there is a single maximum. When initialized, the crystals are perfectly aligned and the angular distribution function is and . Since the axes are labelled (i.e. all of the axes are in the same direction), the crystal system will have an that is asymmetric in at high densities. At equilibrium, particles will have flipped sufficiently to mix the labels and will become symmetric about . The data shown in Fig. 12 illustrates that this symmetry is easily achieved at these densities even in the phase.
For , Fig. 12(a) shows that superballs in the phase maintain strong neighbor bracing. Orthogonal alignment among neighbors is the most probable alignment. Entering the phase reduces the peak at and eliminates the other local maxima. The shape of the curve is similar to that of the dense liquid phase.
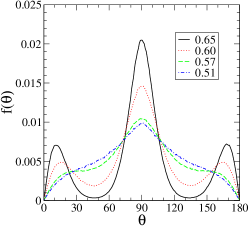
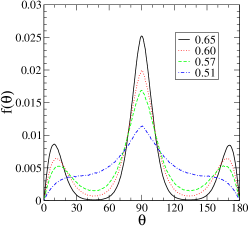
For , Fig. 12(b) demonstrates that the phase prevents nearly all neighboring particle axes from aligning at since the depth of the local minima approach zero. As the - transition is neared, , the shape of the curve changes distinctly as the local minima and maxima converge. For further increases in , Fig. 12(c) shows that the peaks become sharper and narrower, though the fundamental shape does not change.
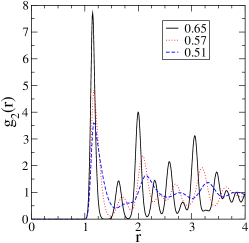
The radial distribution function generally shows that translational order is maintained thorough the and phases. The crystal-like characteristics, peaks in , are evident but smear out gradually as the density is reduced. Fig. 13 shows for various and several densities. While the peaks in the liquid phase, Fig. 13(c) shows that for , decay quickly to unity, the peaks in the and phases do not appear to decay rapidly. Evident in for and 3.5 is a split first peak that represents the subtle difference in pair distances of the first and second neighbors associated with the corresponding lattices. In addition, the particle distribution functions, in which the particle coordinates are projected onto a line perpendicular to the crystal planes, are completely periodic throughout the and phases. This suggest that lower-dimensional translational order, such as that in columnar phases, was not present in either the or phases.
VI Discussion
In this paper, we have determined the phase behavior of a general class of hard convex particles with shapes between a sphere and cube. We found that the degree of curvature plays a significant role in the cubatic ordering and phase transitions. Despite seemingly similar visual appearance among particle shapes, subtle differences in the curvature can yield large changes in the EOS. In the liquid phase, edges and corners are the dominant features that contribute to excluded volumes, while in the crystal phase, they can brace against rotations.
Although MD has some advantages over Monte Carlo techniques, including the ability to simulate cooperative behavior more efficiently, there are always questions concerning kinetic effects and boundary effects. We have performed comprehensive tests to address and minimize these issues. The use of a deformable box helped to alleviate the possibility of anisotropic stresses and to reduce boundary effects. In each case, we verified that the pressure tensor remained isotropic throughout the simulations. The pressure tensor showed slight anisotropy immediately before the melting transition, likely due to the large stresses that build up and induce the transition. In all other cases, including - transitions, the pressure tensor remained isotropic. We tested several system sizes within the limits of our computational capabilities and we found that the curvature of the EOS remains unchanged as the system size was increased. Smaller systems produced larger fluctuations and slight variations in the density of the melting transition compared with larger systems.
In addition, we tested systems in what we knew to be poor initial conditions. For example, for , we initialized the system in three distinct crystals - face-centered cubic (FCC), simple cubic (SC), and the crystal. The FCC and SC cases nearly converged to the pressure equation of state associated with the crystal. This supports the notion that we have used simulation conditions that can approximate the equilibrium phase behavior. The internal stresses of the FCC and SC simulations were relieved when the system shifted toward the crystal.
As with many simulation methodologies, kinetic effects are possible due the inability to simulate long-time behavior. We tested several growth rates and found little variation among the EOS’s generated for rates of . Long, constant-density trajectories revealed slight variation in the densities associated with freezing and melting transitions, though not substantial enough to warrant concern. The curvature of the EOS in the and phases were insensitive to the growth rates .
The primary extension of this work includes the refinement of the boundaries in the phase diagram. As we have shown in Fig. 9, the DTS algorithm has shown first-order phase transitions quite well. However, detailed free energy calculations are needed in order to provide precise phase boundaries and identify higher-order phase transitions, if they exist. In addition, we have yet to explore the dynamic behavior in hard superball systems. The diffusion coefficient may exhibit discontinuous jumps when crossing between and phases. Additionally, rotational degrees of freedom play an important role in the glassy phase. Understanding the extent of curvature of corners and edges on the jamming characteristics has undergone initial exploration Jiao et al. (2010). It may also be possible to manufacture colloidal particles with such controlled shape via photolithography or other synthetic techniques. Testing these systems for certain technologically relevant properties including wave scattering characteristics and rheology may reveal unusual behavior.
While we have used a particle-growth algorithm to understand the phase behavior of hard particles, particle-growth algorithms are often used to search for optimal particle packings. In our experience, allowing particles in a dense liquid to grow slowly generally produces a partially crystalline system. Our results identify one of the primary challenges associated with searching for optimal packing arrangements since these algorithms could hardly ever achieve the densest state. The relaxation times are far too long for computer simulations. This highlights the need for alternative methods to find dense packings of particles Jiao et al. (2008, 2009); Torquato and Jiao (2009a). Only after finding the densest packings can researchers attempt to determine the entire equilibrium phase behavior of hard particles by applying particle contraction.
The application of overlap potentials to generalized convex particles Donev (2006) and the development of efficient MD algorithms Donev et al. (2005a, b) has made available the opportunity to explore more deeply how shape influences phase behavior. Along these lines, planned future work includes determining the onset of nematic, smectic, and possibly parquet phases of elongated superballs. This particular perturbation would allow one to explore the continuous evolution from ellipsoids to tetragonal parallelepipeds, which exhibit various types of liquid crystals for certain aspect ratios. With the tools available, one can determine, for example, where the crossover point is for the appearance of a parquet phase in a system of elongated superballs. Additionally, a study of parallel hard superellipsoids, a perturbation from spheres or ellipsoids to cylinders, showed the onset of a smectic phase Martínez-Ratón and Velasco (2008). With the addition of rotational degrees of freedom, this system that would presumably exhibit a cubatic or parquet phase depending on the deformation parameter. There are seemingly endless possibilities for hard-particle shapes and perhaps a mathematical treatment of generalized particles with “superexponents” may be enlightening.
Acknowledgments
The authors are indebted to the reviewer of an earlier manuscript that recommended verifying the isotropy of the pressure tensor. The authors thank Aleksandar Donev for making his molecular dynamics codes publicly available and helpful discussions. The authors gratefully acknowledge Fernando Escobedo for providing the hard cube EOS data. R.D.B. thanks Yang Jiao for valuable discussions. S.T. thanks the Institute for Advanced Study for its hospitality during his stay there. This work was supported by the Office of Basic Energy Sciences, US Department of Energy, Grant No. DE-FG02-04-ER46108.
References
- Sun and Xia (2002) Y. Sun and Y. Xia, Science 298, 2176 (2002).
- Grzelczak et al. (2008) M. Grzelczak, J. Pérez-Juste, P. Mulvaney, and L. M. Liz-Marzán, Chem. Soc. Rev. 37, 1783 (2008).
- Tao et al. (2008) A. R. Tao, S. Habas, and P. Yang, Small 4, 310 (2008).
- Brown et al. (2000) A. B. D. Brown, C. G. Smith, and A. R. Rennie, Phys. Rev. E 62, 951 (2000).
- Zhao et al. (2007) K. Zhao, C. Harrison, D. Huse, W. B. Russel, and P. M. Chaikin, Phys. Rev. E 76, 040401 (2007).
- Snoeks et al. (2000) E. Snoeks, A. van Blaaderen, T. van Dillen, C. M. van Kats, M. L. Brongersma, and A. Polman, Adv. Materials 12, 1511 (2000).
- Kirkwood et al. (1950) J. G. Kirkwood, E. K. Maun, and B. J. Alder, J. Chem. Phys. 18, 1040 (1950).
- Metropolis et al. (1953) N. Metropolis, A. W. Rosenbluth, M. N. Rosenbluth, A. H. Teller, and E. Teller, J. Chem. Phys. 21, 1087 (1953).
- Alder and Wainwright (1957) B. J. Alder and T. E. Wainwright, J. Chem. Phys. 27, 1208 (1957).
- Ree and Hoover (1964) F. Ree and W. Hoover, J. Chem. Phys. 40, 939 (1964).
- Hoover and Ree (1968) W. G. Hoover and F. H. Ree, J. Chem. Phys. 49, 3609 (1968).
- Carnahan and Starling (1969) N. F. Carnahan and K. E. Starling, J. Chem. Phys. 51, 635 (1969).
- Speedy (1998) R. J. Speedy, J. Phys. Cond. Matt. 10, 4387 (1998).
- Torquato (2002) S. Torquato, Random Heterogeneous Materials: Microstucture and Macroscopic Properties (SpringerVerlag: New York, 2002).
- Skoge et al. (2006) M. Skoge, A. Donev, F. H. Stillinger, and S. Torquato, Phys. Rev. E 74, 041127 (2006).
- Allen et al. (1993) M. P. Allen, G. T. Evans, D. Frenkel, and B. M. Mulder, Adv. Chem. Phys. 86, 1 (1993).
- John et al. (2004) B. S. John, A. Stroock, and F. A. Escobedo, J. Chem. Phys. 120, 9383 (2004).
- Veerman and Frenkel (1992) J. A. C. Veerman and D. Frenkel, Phys. Rev. A 45, 5632 (1992).
- Blaak and Mulder (1998) R. Blaak and B. Mulder, Phys. Rev. E 58, 5873 (1998).
- Blaak et al. (2004) R. Blaak, B. M. Mulder, and D. Frenkel, J. Chem. Phys. 120, 5486 (2004).
- John et al. (2008) B. S. John, C. Juhlin, and F. A. Escobedo, J. Chem. Phys. 128, 044909 (2008).
- John and Escobedo (2005) B. S. John and F. A. Escobedo, J. Phys. Chem. B 109, 23008 (2005).
- Jiao et al. (2009) Y. Jiao, F. H. Stillinger, and S. Torquato, Phys. Rev. E 79, 041309 (2009).
- foo (a) We use q for the deformation parameter whereas previous literature has used p since we reserve that character to represent the pressure.
- Delaney and Cleary (2010) G. W. Delaney and P. W. Cleary, Europhysics Letters 89, 34002 (2010).
- Jiao et al. (2010) Y. Jiao, F. H. Stillinger, and S. Torquato, Phys. Rev. E 81, 041304 (2010).
- Elkies et al. (1991) N. D. Elkies, A. M. Odlyzko, and J. A. Rush, Inventiones mathematicae 105, 613 (1991).
- Jiao et al. (2008) Y. Jiao, F. H. Stillinger, and S. Torquato, Phys. Rev. Lett. 100, 245504 (2008).
- Hales (2005) T. C. Hales, Ann. Math 162, 1065 (2005).
- Donev et al. (2004) A. Donev, F. H. Stillinger, P. M. Chaikin, and S. Torquato, Phys. Rev. Lett. 92, 255506 (2004).
- Torquato and Jiao (2009a) S. Torquato and Y. Jiao, Nature 460, 876 (2009a).
- Torquato and Jiao (2009b) S. Torquato and Y. Jiao, Phys. Rev. E 80, 041104 (2009b).
- Blaak et al. (1999) R. Blaak, D. Frenkel, and B. M. Mulder, J. Chem. Phys. 110, 11652 (1999).
- Veerman and Frenkel (1990) J. A. C. Veerman and D. Frenkel, Phys. Rev. A 41, 3237 (1990).
- Straley (1974) J. P. Straley, Phys. Rev. A 10, 1881 (1974).
- Frenkel et al. (1984) D. Frenkel, B. M. Mulder, and J. P. McTague, Phys. Rev. Lett. 52, 287 (1984).
- Frenkel and Mulder (1985) D. Frenkel and B. Mulder, Mol. Phys. 55, 1171 (1985).
- Camp and Allen (1997) P. J. Camp and M. P. Allen, J. Chem. Phys. 106, 6681 (1997).
- Duncan et al. (2009) P. D. Duncan, M. Dennison, A. J. Masters, and M. R. Wilson, Phys. Rev. E 79, 031702 (2009).
- Martínez-Ratón and Velasco (2008) Y. Martínez-Ratón and E. Velasco, J. Chem. Phys. 129, 054907 (2008).
- Donev et al. (2005a) A. Donev, S. Torquato, and F. H. Stillinger, J. Comp. Phys. 202, 737 (2005a).
- Donev et al. (2005b) A. Donev, S. Torquato, and F. H. Stillinger, J. Comp. Phys. 202, 765 (2005b).
- Donev (2006) A. Donev, Ph.D. thesis, Princeton University (2006).
- Lubachevsky and Stillinger (1990) B. D. Lubachevsky and F. H. Stillinger, J. Stat. Phys. 60, 561 (1990).
- Parrinello and Rahman (1981) M. Parrinello and A. Rahman, J. Appl. Phys. 52, 7182 (1981).
- Steinhardt et al. (1983) P. J. Steinhardt, D. R. Nelson, and M. Ronchetti, Phys. Rev. B 28, 784 (1983).
- Isihara and Hayashida (1951) A. Isihara and T. Hayashida, J. Phys. Soc. Japan 6, 40 (1951).
- Singh and Kumar (1996) G. S. Singh and B. Kumar, J. Chem. Phys. 105, 2429 (1996).
- Vega (1997) C. Vega, Mol. Phys. 92, 651 (1997).
- Nezbeda and Boublík (1984) I. Nezbeda and T. Boublík, Mol. Phys. 51, 1443 (1984).
- de Miguel (2008) E. de Miguel, J. Chem. Phys. 129, 214112 (2008).
- foo (b) Equation of state data were provided by Fernando Escobedo and were generated by Monte Carlo simulation of 1728 cubes in the isobaric-isothermal ensemble.
- Jagla (1998) E. A. Jagla, Phys. Rev. E 58, 4701 (1998).
- Groh and Mulder (2001) B. Groh and B. Mulder, J. Chem. Phys. 114, 3653 (2001).
- Hoover et al. (2009) W. G. Hoover, C. G. Hoover, and M. N. Bannerman, J. Stat. Phys. (2009).
- Nezbeda et al. (1979) I. Nezbeda, J. Pavíc̆ek, and S. Lablík, Colln Czech. Chem. 44, 3555 (1979).
- Boublik (1981) T. Boublik, Mol. Phys. 42, 209 (1981).
Appendix A Phase Behavior Effects Induced by System Geometry
Here we report on the importance of utilizing a deformable boundary in simulations of anisotropic particles. Because superballs are centrally symmetric objects, we expected that the pressure tensor would remain isotropic throughout simulations. The EOS for the liquid does not depend on the geometry of simulation box. The pressure tensor for the liquid is isotropic since particles rotations are random.
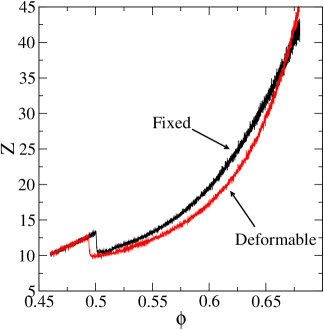
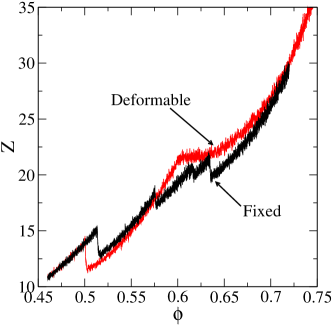
However, in high-density phases, we find that anisotropic stresses can build up when the boundaries are fixed, even in the case where is near unity. Fig. 14 compares the equations of state generated using a fixed box and a deforming box for and 2.0. For small , the equations of state differ significantly in their curvature.
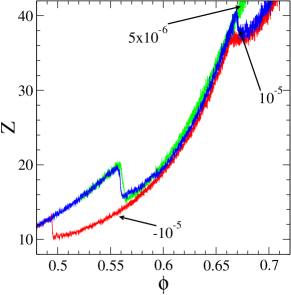
For , a fixed simulation box not only affects the curvature but also introduces a series of apparent first-order phase transitions. As seen in Fig. 14 for , the system with a fixed simulation box has three apparent first order phase transitions. These discontinuities along the branch are highly reproducible. Each apparent phase transition can be attributed to rotations of particles about certain axes. The highest-density transition corresponds to rotations about a single particle axis. At this density, there is enough average spacing between particles in the lattice to allow for rotations about a single axis. The middle transition corresponds to rotations about two particle axes while the lowest-density transition on the crystal branch corresponds to free rotations about three particle axes. In general, the melting densities in the deforming box and fixed box differed slightly, with the deforming box having a lower melting density. In all cases, melting appeared to be a first-order phase transition.
Observing the elements of the pressure tensor as a function of density shows that anisotropic stresses build up as the system approaches each apparent phase transtion. With deforming box simulations using the Parrinello-Rahman-like algorithm allows for these internal stress to be relaxed away quickly, as they would occur in thermodynamic systems. Although the Parrinello-Rahman-like algorithm does not rigorously sample an isostress ensemble because the lattice vectors are not directly coupled to the particle interactions, it is a reasonable approximation.