Ground state properties and high pressure behavior of plutonium dioxide: Systematic density functional calculations
Abstract
Plutonium dioxide is of high technological importance in nuclear fuel cycle and is particularly crucial in long-term storage of Pu-based radioactive waste. Using first-principles density-functional theory, in this paper we systematically study the structural, electronic, mechanical, thermodynamic properties, and pressure induced structural transition of PuO2. To properly describe the strong correlation in Pu electrons, the local density approximation and the generalized gradient approximation theoretical formalisms have been employed. We optimize parameter in calculating the total energy, lattice parameters, and bulk modulus at nonmagnetic, ferromagnetic, and antiferromagnetic configurations for both ground state fluorite structure and high pressure cotunnite structure. Best agreement with experiments is obtained by tuning the effective Hubbard parameter at around 4 eV within LDA approach. After carefully testing the validity of the ground-state calculation, we further investigate the bonding nature, elastic constants, various moduli, Debye temperature, hardness, ideal tensile strength, and phonon dispersion for fluorite PuO2. Some thermodynamic properties, e.g., Gibbs free energy, volume thermal expansion, and specific heat, are also calculated. As for cotunnite phase, besides elastic constants, various moduli, and Debye temperature at 0 GPa, we have further presented our calculated electronic, structural, and magnetic properties for PuO2 under pressure up to 280 GPa. A metallic transition at around 133 GPa and an isostructural transition in pressure range of 75-133 GPa are predicted. Additionally, as an illustration on the valency trend and subsequent effect on the mechanical properties, the calculated results for other actinide metal dioxides (ThO2, UO2, and NpO2) are also presented.
pacs:
71.27.+a, 61.50.Ks, 62.20.-x, 63.20.dkI INTRODUCTION
Actinide elements and compounds possess particular interesting physical behaviors due to the 5f states and have always attracted extensive attention because of their importance in nuclear fuel cycle Heathman ; Atta-Fynn ; Prodan2 ; Moore . Actinide dioxides, AO2 (A=Th, U, Np or Pu), are universally used as advanced fuel materials for nuclear reactors and PuO2 also plays an important role in the plutonium re-use, separation and/or long-term storage. Recently, there has occurred in the literature a series of experimental reports Haschke ; Butterfield ; Gouder on the strategies of storage of Pu-based waste. Exposure to air and moisture, metallic plutonium surface easily oxidizes to Pu2O3 and PuO2. Although the existence of PuO2+x (0.27) was reported by Haschke et al. Haschke , recent photoemission study found that PuO2 was only covered by a chemisorbed layer of oxygen and can be easily desorbed at elevated temperature Gouder , therefore, PuO2 is the stablest plutonium oxide. At ambient condition PuO2 crystallizes in a fluorite structure with space group Fmm (No. 225). Its cubic unit cell is composed of four PuO2 formula units with plutonium atoms and oxygen atoms in 4a and 8c sites, respectively. By using the energy dispersive x-ray diffraction method, Dancausse et al Dancausse reported that at 39 GPa, PuO2 undergoes a phase transition to an orthorhombic structure of cotunnite type with space group Pnma (No. 62).
As for the electronic-structure study of PuO2, conventional density functional theory (DFT) that applies the local density approximation (LDA) or generalized gradient approximation (GGA) underestimates the strong on-site Coulomb repulsion of the 5f electrons and, consequently, describes PuO2 as incorrect ferromagnetic (FM) conductor Boettger2 instead of antiferromagnetic (AFM) Mott insulator reported by experiment McNeilly . Same problems have been confirmed in studying other correlated materials within the pure LDA/GGA schemes. Fortunately, several approaches, the LDA/GGA+U Dudarev1 ; Dudarev2 ; Dudarev3 , the hybrid density functional of HSE ProdanJCP , and the self-interaction corrected local spin-density (SIC-LSD) Petit , have been developed to correct these failures in calculations of actinide compounds. The effective modification of pure DFT by LDA/GGA+U formalisms has been confirmed widely in study of UO2 Dudarev1 ; Dudarev3 and PuO2 SunJCP ; SunCP ; Andersson ; Jomard ; Shi . By tuning the effective Hubbard parameter in a reasonable range, the AFM Mott insulator feature was correctly calculated and the structural parameters as well as the electronic structure are well in accord with experiments. Lattice dynamical properties of UO2 and PuO2 and various contributions to their thermal conductivities were studied by using a combination of LDA and Dynamical Mean-Field Theory (DMFT) Yin . However, despite that abundant researches on the structural, electronic, optical, thermodynamic properties of plutonium dioxide have been performed, relatively little is known regarding its chemical bonding, mechanical properties, and phonon dispersion. In addition, the pressure induced structural transition has also not yet been studied by first-principles DFT+U calculations.
In this work, we have systematically calculated the ground-state structural parameters, electronic, mechanical, thermodynamic properties, and pressure induced structural transition of PuO2 by employing the LDA+U and GGA+U schemes due to Dudarev et al. Dudarev1 ; Dudarev2 ; Dudarev3 . The validity of the ground-state calculation is carefully tested. Our calculated lattice parameter and bulk modulus B are well consistent with previous LDA+U results Andersson . The total energy, structural parameters, bulk modulus B, and pressure derivative of the bulk modulus B′ for AFM and FM phases calculated in wide range of effective Hubbard U parameter are presented and our electronic spectrum reproduce briefly the main feature of our previous study SunJCP . In addition, the bonding nature of AO bond in PuO2, NpO2, UO2, and ThO2 involving its mixed ionic/covalent character is investigated by performing the Bader analysis Bader ; Tang . We find that about 2.40, 2.48, 2.56, and 2.66 electrons transfer from each Pu, Np, U or Th atom to O atom, respectively. In study of the mechanical properties, we first calculate the elastic constants of both Fmm and Pnma phases and then the elastic moduli, Poisson’s ratio, and Debye temperature are deduced from the calculated elastic constants. Hardness and ideal tensile strength of Fmm PuO2 are also obtained by LDA+U approach with one typical value of effective U parameter. The hardness of PuO2 is equal to 26.6 GPa and the ideal tensile strengthes are calculated to be 81.2, 28.3, and 16.8 GPa for pulling in the [001], [110], and [111] directions, respectively. As for the thermodynamic study, the phonon dispersion illustrates the stability of PuO2 and we further predict the lattice vibration energy, thermal expansion, and specific heat by utilizing the quasiharmonic approximation based on the first-principles phonon density of state (DOS). One more aim of the present work is to extend the description of PuO2 to high pressures. The electronic, structural, and magnetic behavior of PuO2 under pressure up to 280 GPa have been evaluated. Results show that there occurs a metallic transition at around 133 GPa for Pnma phase. The isostructural transition, similar to UO2 Geng and ThO2 WangThO2 , in pressure domain of 75-133 GPa is predicted. The rest of this paper is arranged as follows. In Sec. II the computational method is briefly described. In Sec. III we present and discuss our results. In Sec. IV we summarize the conclusions of this work.
II computational methods
The DFT calculations are performed on the basis of the frozen-core projected augmented wave (PAW) method of Blöchl PAW encoded in Vienna ab initio simulation package (VASP) Kresse3 using the LDA and GGA LDA ; GGA . For the plane-wave set, a cutoff energy of 500 eV is used. The k-point meshes in the full wedge of the Brillouin zone (BZ) are sampled by 999 and 9159 grids according to the Monkhorst-Pack Monk scheme for fluorite and cotunnite PuO2, respectively, and all atoms are fully relaxed until the Hellmann-Feynman forces become less than 0.02 eV/Å. The plutonium 6s27s26p66d25f4 and the oxygen 2s22p4 electrons are treated as valence electrons. The strong on-site Coulomb repulsion among the localized Pu 5f electrons is described by using the LDA/GGA+U formalisms formulated by Dudarev et al. Dudarev1 ; Dudarev2 ; Dudarev3 , where the double counting correction has already been included. As concluded in some previous studies of actinide dioxides (AO2), although the pure LDA and GGA fail to depict the electronic structure, especially the insulating nature and the occupied-state character of UO2 DudarevUO2 ; Geng , NpO2 Andersson ; WangNpO2 , and PuO2 SunJCP ; SunCP ; Jomard , the LDA/GGA+U approaches will capture the Mott insulating properties of the strongly correlated U 5f, Np 5f, and Pu 5f electrons in AO2 adequately. In this paper the Coulomb is treated as a variable, while the exchange energy is set to be a constant =0.75 eV. This value of is same with our previous study of plutonium oxides SunJCP ; SunCP . Since only the difference between and is significant Dudarev2 , thus we will henceforth label them as one single parameter, for simplicity labeled as , while keeping in mind that the non-zero has been used during calculations.
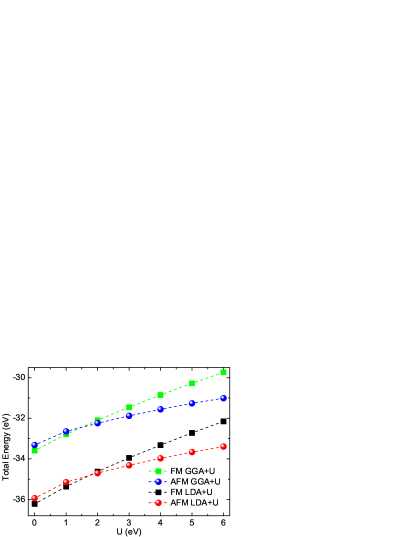
Both spin-unpolarized and spin-polarized calculations are performed in this study. Compared to FM and AFM phases, the nonmagnetic (NM) phase is not energetically favorable both in the LDA+U and GGA+U formalisms. Therefore, the results of NM are not presented in the following. The dependence of the total energy (per formula unit at respective optimum geometries) on U for both FM and AFM phases within the LDA+U and GGA+U formalisms is shown in Fig. 1. At U=0 and 1.0 eV, the total energy of the FM phase is lower than that of the AFM phase either in LDA+U scheme or GGA+U scheme. However, as shown in Fig. 1, it is clear that the total energy of the AFM phase decreases to become lower than that of the FM phase when increasing U. The total-energy differences () within the LDA+U and GGA+U at U=4 eV are 0.705 and 0.651 eV, respectively. Both FM and AFM results will be presented in the following analysis. Besides, while the spin-orbit coupling (SOC) is important for certain properties of heavy metal compounds, it has been numerically found Boettger1 ; Boettger2 and physically analyzed ProdanJCP ; Prodan1 that the inclusion of the SOC has little effect on the bulk and one-electron properties of UO2 and PuO2. Our test calculations also show that within LDA+U approach with U=4 eV, inclusion of SOC will increase the optimum lattice constant by only 0.7% and the bulk modulus by about 0.5 GPa. Therefore, in our following calculations of plutonium dioxide, the SOC is not included.
In present work, the theoretical equilibrium volume, bulk modulus B, and pressure derivative of the bulk modulus B′ are obtained by fitting the energy-volume data with the third-order Birch-Murnaghan equation of state (EOS) Birch . In order to calculate elastic constants, a small strain is applied onto the structure. For small strain , Hooke’s law is valid and the crystal energy can be expanded as a Taylor series Nye ,
| (1) |
where is the energy of the unstrained system with the equilibrium volume , is strain tensor which has matrix elements (=1, 2, and 3) defined by
| (5) |
and are the elastic constants. For cubic structures, there are three independent elastic constants (, , and ). So, the elastic constants for fluorite PuO2 can be calculated from three different strains listed as follows:
| (6) |
The strain amplitude is varied in steps of 0.006 from =0.036 to 0.036 and the total energies at these strain steps are calculated. After obtaining elastic constants, we can calculate bulk and shear moduli from the Voigt-Reuss-Hill (VRH) approximations Hill . The Voigt (Reuss) bounds on the bulk modulus BV (BR) and shear modulus GV (GR) for this cubic crystal system are deduced from the formulae of elastic moduli in Ref. Hanies . As for cotunnite PuO2, the nine independent elastic constants (, , , , , , , , and ) can be obtained from nine different strains listed in the following:
| (7) |
and the formulae of elastic moduli in VRH approximations Hill are from Ref. Watt . Based on the Hill approximation Hill , B= and G=. The Young’s modulus E and Poisson’s ratio are given by the following formulae:
| (8) |
In addition, the elastic properties of a solid can also be related to thermodynamical parameters especially specific heat, thermal expansion, Debye temperature, melting point, and Grüneisen parameter Ravindran . From this point of view, Debye temperature is one of fundamental parameters for solid materials. Due to the fact that at low temperatures the vibrational excitations arise solely from acoustic vibrations, therefore, the Debye temperature calculated from elastic constants is the same as that determined from specific heat measurements. The relation between the Debye temperature () and the average sound wave velocity () is
| (9) |
where h and are Planck and Boltzmann constants, respectively, n is the number of atoms in the molecule and is molecular volume. The average wave velocity in the polycrystalline materials is approximately given as
| (10) |
where = ( is the density) and = are the transverse and longitudinal elastic wave velocities of the polycrystalline materials, respectively.
III results
| Magnetism | Method | property | U=0 | U=1 | U=2 | U=3 | U=4 | U=5 | U=6 | Expt. |
|---|---|---|---|---|---|---|---|---|---|---|
| AFM | LDA+U | a0 (Å) | 5.275 | 5.313 | 5.338 | 5.351 | 5.362 | 5.371 | 5.378 | 5.398 |
| B (GPa) | 218 | 208 | 224 | 224 | 225 | 226 | 227 | 178 | ||
| B | 4.1 | 3.7 | 4.3 | 4.3 | 4.3 | 4.3 | 4.3 | |||
| GGA+U | a0 (Å) | 5.396 | 5.433 | 5.446 | 5.457 | 5.466 | 5.473 | 5.480 | ||
| B (GPa) | 185 | 188 | 191 | 192 | 193 | 194 | 195 | |||
| B | 4.3 | 3.8 | 4.4 | 4.5 | 4.5 | 4.5 | 4.4 | |||
| FM | LDA+U | a0 (Å) | 5.270 | 5.290 | 5.309 | 5.325 | 5.338 | 5.350 | 5.361 | |
| B (GPa) | 230 | 224 | 221 | 220 | 218 | 215 | 212 | |||
| B | 4.4 | 4.4 | 4.3 | 4.4 | 4.4 | 4.4 | 4.5 | |||
| GGA+U | a0 (Å) | 5.384 | 5.405 | 5.424 | 5.439 | 5.452 | 5.464 | 5.476 | ||
| B (GPa) | 193 | 188 | 186 | 184 | 182 | 179 | 174 | |||
| B | 4.5 | 4.4 | 4.5 | 4.5 | 4.7 | 4.7 | 4.8 |
III.1 Atomic and electronic structures of fluorite PuO2
We report in Table 1 the lattice parameter (a0), bulk modulus (B), and pressure derivative of the bulk modulus (B) for AFM and FM PuO2 obtained in LDA+U and GGA+U frameworks. All these values are determined by EOS fitting. For comparison, the experimental values of (Ref. Haschke ) and B (Ref. Idiri ) are also listed. In the overall view, the dependence of the lattice parameter of AFM PuO2 on U is well consistent with our previous study SunJCP either in LDA+U scheme or in GGA+U scheme. For the LDA/GGA+U approaches, the calculated improves upon the pure LDA/GGA by steadily increasing its amplitude with U. Actually, at a typical value U=4 eV, the LDA+U gives =5.362 Å, which is very close to the experimental value of 5.398 Å, and the GGA+U gives =5.466 Å. Note that recent PBE+U Jomard and LDA+U Andersson calculations with U=4.0 eV and J=0.7 eV predicted the lattice parameter of AFM PuO2 to be 5.444 and 5.354 Å, respectively, and the HSE ProdanJCP and SIC-LSD Petit calculations gave the values to be 5.385 and 5.44 Å, respectively. On the other hand, as shown in Table 1, the tendency of with U for FM PuO2 is similar to that of the AFM phase. At a typical value U=4 eV, the LDA/GGA+U give =5.338 and 5.452 Å. These values are slightly smaller than those of the AFM phase. Previous HSE ProdanJCP calculation of FM PuO2 gave the lattice parameter to be 5.387 Å. As for the dependence of bulk modulus B of AFM and FM PuO2 on U, it is clear that the LDA results are always higher than the GGA results, which is due to the overbinding effect of the LDA approach. While the bulk modulus B of AFM phase increases steadily with increasing the amplitude of U, the bulk modulus B of FM phase will decrease along with the increasing of Hubbard U. At a typical value U=4 eV, the LDA+U and GGA+U give B=225 and 193 GPa for AFM phase, respectively, and B=218 and 182 GPa for FM phase, respectively. Apparently, the GGA+U approach gives more close values to the experimental data of B=178 GPa Idiri . In our present study, as shown in Table 2, the bulk modulus B deduced from elastic constants turns out to be very close to that obtained by EOS fitting. This indicates that our calculations are consistent and reliable. In addition, as listed in Table 2, recent PBE+U Jomard and LDA+U Andersson calculations with U=4.0 eV and J=0.7 eV predicted the bulk modulus B of AFM PuO2 to be 199 and 226 GPa, respectively, and the HSE ProdanJCP and SIC-LSD Petit calculations gave the the bulk modulus to be 221 and 214 GPa, respectively. As for pressure derivative of the bulk modulus (B), all our calculated values are approximately equal to 4.5. Overall, comparing with the experimental data and recent theoretical results, the accuracy of our atomic-structure prediction for AFM PuO2 is quite satisfactory by tuning the effective Hubbard parameter U in a range of 3-4 eV within the LDA/GGA+U approaches, which supplies the safeguard for our following study of electronic structure and mechanical properties of PuO2.
| Method | C11 | C12 | C44 | B | G | E | Eg | ||
|---|---|---|---|---|---|---|---|---|---|
| (GPa) | (GPa) | (GPa) | (GPa) | (GPa) | (GPa) | () | (eV) | ||
| LDA+U (U=0) | 386.6 | 136.5 | 71.9 | 220 | 89.9 | 237.3 | 0.320 | 3.937 | 0.0 |
| LDA+U (U=4) | 319.6 | 177.8 | 74.5 | 225 | 73.0 | 197.7 | 0.354 | 4.126 | 1.5 |
| GGA+U (U=0) | 343.9 | 112.3 | 53.7 | 190 | 73.5 | 195.1 | 0.328 | 4.085 | 0.0 |
| GGA+U (U=4) | 256.5 | 167.9 | 59.2 | 197 | 52.7 | 145.2 | 0.377 | 4.165 | 1.5 |
| Expt. | 178 | 1.8 | |||||||
| PBE+U | 199 | 3.89 | 2.2 | ||||||
| LDA+U | 226 | 1.7 | |||||||
| HSE | 221 | 3.4 | |||||||
| SIC-LSD | 214 | 1.2 |
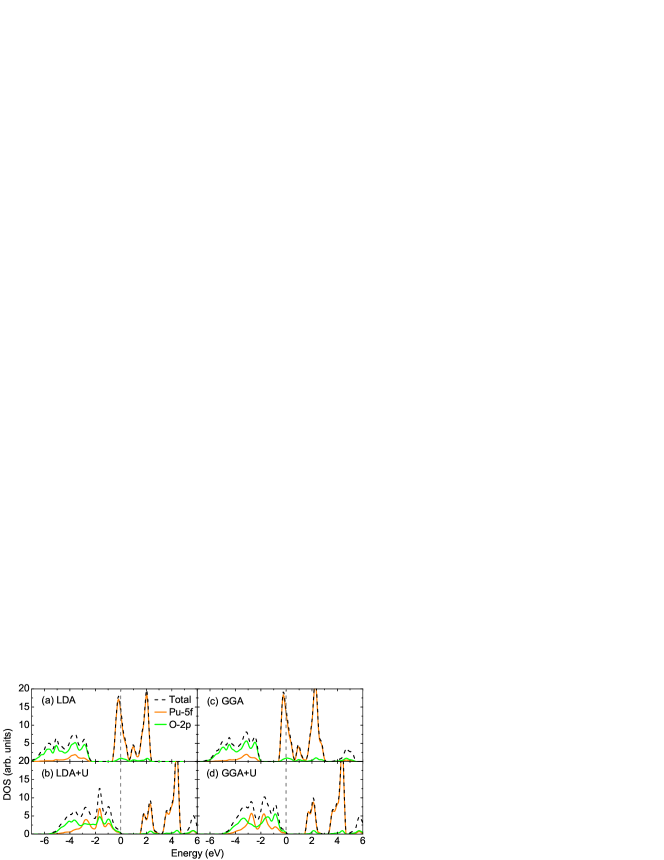
The total density of states (DOS) as well as the projected DOS for the Pu 5f and O 2p orbitals within LDA, GGA, LDA+U, and GGA+U formalisms are shown in Fig. 2. Clearly, our results reproduce all the features included in our previous work SunJCP . In particular, we recover the main conclusion that although the pure LDA and GGA fail to depict the electronic structure, especially the insulating nature and the occupied-state character of PuO2, by tuning the effective Hubbard parameter in a reasonable range, the LDA/GGA+U approaches can prominently improve upon the pure LDA/GGA calculations and, thus, can provide a satisfactory qualitative electronic structure description comparable with the photoemission experiments Butterfield ; Gouder . In this study, the insulating energy band gap (Eg) is of 1.5 eV at U=4 eV within LDA/GGA+U approaches (see Table 2). In Table 2, the experimental McNeilly value and previous theoretical calculations Jomard ; Andersson ; ProdanJCP ; Petit results are also listed for comparison. Obviously, the HSE calculations result in a larger Eg by 1.9 eV ProdanJCP and our calculated results are well consistent with the measured value and other theoretical results. The calculated amplitude of local spin moment is 4.1 (per Pu atom) for AFM PuO2 within the two DFT+U schemes and this value is comparable to previous LDA/PBE+U Jomard results of 3.9 .
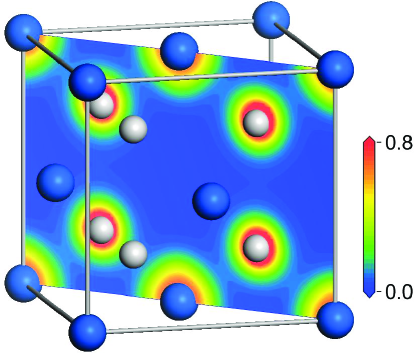
To understand the chemical bonding characters of fluorite PuO2, we present in Fig. 3 the crystal structure of its cubic unit cell and the charge density map of the (110) plane calculated in LDA+U formalism with U=4 eV for AFM phase. Evidently, the charge density around Pu and O ions are all near spherical distribution with slightly deformed toward the direction to their nearest neighboring atoms and there are clear covalent bridges between Pu and O ions. In order to describe the ionic/covalent character quantitatively and more clearly, we plot the line charge density distribution along the nearest PuO bonds (not shown). A minimum value of charge density (0.53 /Å3) along the PuO bonds is obtained and is listed in Table 3. For comparison, we have also calculated some corresponding properties of AFM UO2 within the LDA+U formalism. Parameters of the Hubbard term are taken as U=4.51 eV and J=0.51 eV, which had been checked carefully by Dudarev et al Dudarev1 ; Dudarev2 ; Dudarev3 . In following study, results of UO2 are all calculated using these Hubbard parameters either for ground-state Fmm phase or high pressure Pnma phase. The lattice parameter =5.449 Å and bulk modulus B=220.0 GPa for Fmm UO2 obtained by EOS fitting are in perfect agreement with results of recent LDA+U calculation Andersson (=5.448 Å and B=218 GPa) and experiments Yamashita ; Idiri (=5.47 Å and B=207 GPa). Charge analysis results of Fmm UO2 are listed in Table 3. Clearly, the minimum values of charge density for PuO2 and UO2, comparable to that along the NpO bonds included in our previous study of NpO2 WangNpO2 , are prominently larger than that along the ThO bonds (0.45 e/Å3) in ThO2 WangThO2 . This indicates that the PuO, UO, and NpO bonds have stronger covalency than the ThO bonds. And this conclusion is in good accordance with previous HSE study of the covalency in Ref. Prodan2 , in which significant orbital mixing and covalency in the intermediate region (PuO2-CmO2) of actinide dioxides was for the first time showed by the increasing 5-2 orbital energy degeneracy. Besides, the AO (A=Pu, Np, U or Th) bond distances calculated in present study and our previous works WangNpO2 ; WangThO2 are listed in Table 3. Obviously, the PuO, NpO, and UO bond distances are all smaller than the ThO bond distance. This fact illustrates that the covalency of AO2 has tight relation with their bond distances, thus influences their macroscopical properties, such as hardness and elasticity. To see the ionicity of AO2, results from the Bader analysis Bader ; Tang are presented in Table 3. The charge (QB) enclosed within the Bader volume (VB) is a good approximation to the total electronic charge of an atom. Note that although we have included the core charge in charge density calculations, since we do not expect variations as far as the trends are concerned, only the valence charge are listed. Here, same with our previous study, we apply U=4.6 eV and J=0.6 eV for the Np 5f orbitals in calculations of NpO2. Based on the data in Table 3 and considering the valence electron numbers of Pu, Np, U, Th, and O atoms (16, 15, 14, 12, and 6, respectively), in our study of AO2, we find that about 2.40, 2.48, 2.56, and 2.66 electrons transfer from each Pu, Np, U or Th atom to O atom, respectively. This indicates that the ionicity of AO2 shows decreasing trend with increasing Z.
III.2 Mechanical properties
III.2.1 Elastic properties
Our calculated elastic constants, various moduli, and Poisson’s ratio of the Fmm PuO2 at 0 GPa are collected in Table 2 and those of the Pnma phase are listed in Table 4. Obviously, the Fmm phase of PuO2 is mechanically stable due to the fact that its elastic constants satisfy the following mechanical stability criteria Nye of cubic structure:
| (11) |
As for the high-pressure Pnma crystalline phase, we have optimized the structural parameters of its AFM phase at different pressures within LDA+U formalism with the typical value of U=4 eV. To avoid the Pulay stress problem, we perform the structure relaxation calculations at fixed volumes rather than constant pressures. Note that different from the structure optimization of the ground-state Fmm phase, the coordinates of atoms and the cell shape of the Pnma phase are necessary to be optimized due to its internal degrees of freedom. After fitting the energy-volume data to the EOS, we obtain the optimized structural lattice parameters a, b, and c for the Pnma PuO2 AFM phase at 0 GPa to be 5.889, 3.562, and 6.821 Å, respectively, giving V=143.1 Å3. This volume is smaller than the equilibrium volume of 154.2 Å3 for the Fmm phase. This feature implies that the Pnma phase will become stable under compression. The elastic constants listed in Table 4 indicate that the Pnma PuO2 is also mechanically stable. Actually, they satisfy the following mechanical stability criteria Nye for the orthorhombic structure:
| (12) |
| Compound | C11 | C22 | C33 | C44 | C55 | C66 | C12 | C23 | C13 | B | B | Ba | Bb | Bc | G | E | |
|---|---|---|---|---|---|---|---|---|---|---|---|---|---|---|---|---|---|
| PuO2 | 355.6 | 327.4 | 336.3 | 36.0 | 81.5 | 96.7 | 140.5 | 199.0 | 141.2 | 219.9 | 5.7 | 598.5 | 669.5 | 720.3 | 73.0 | 197.2 | 0.351 |
| UO2 | 338.2 | 335.1 | 325.9 | 24.4 | 75.6 | 92.0 | 119.9 | 148.4 | 142.1 | 202.2 | 5.5 | 586.4 | 593.8 | 641.9 | 68.0 | 183.4 | 0.349 |
One can see from Table 4 that the calculated , , and are largely smaller than , , and . Therefore, the mechanical stability criteria is easily satisfied. For comparison, we have also calculated the elastic properties of UO2 in its ground-state fluorite phase and high-pressure cotunnite phase within LDA+U formalism. For Fmm phase, C11=389.3 GPa, C12=138.9 GPa, C44=71.3 GPa, B=222.4 GPa, G=89.5 GPa, E=236.8 GPa, and Poisson’s ratio =0.323. Results for Pnma UO2 are presented in Table 4. Clearly, both fluorite and cotunnite phases of UO2 are mechanically stable. Moreover, comparing results of bulk modulus B, shear modulus G, Young’s modulus E, and Poisson’s ratio for fluorite phase and cotunnite phase, they are almost equal to each other for PuO2. Particularly, the bulk modulus B is only smaller by about 5 GPa for Pnma phase compared to that of Fmm phase. As for UO2, bulk modulus of cotunnite phase is smaller by approximately 9%, shear modulus and Young’s modulus about 23%, compared to those of fluorite structure. Besides, in our previous study of ThO2 WangThO2 we find that the bulk modulus, shear modulus, and Young’s modulus of cotunnite ThO2 are all smaller by approximately 25% compared to those of fluorite ThO2. Therefore, after comparing the bulk modulus B for the two phases of ThO2, UO2, and PuO2, we find that the difference is decreasing along with increasing of 5 electrons. This trend is understandable. Although the softening in bulk modulus upon phase transition for these three systems is similar, the increase of 5 electrons of actinide metal atoms will lead to more covalency and thus reduce the bulk modulus difference between the two phases of the actinide dioxides across the series. To study the anisotropy of the linear bulk modulus for Pnma PuO2 and UO2, we calculate the directional bulk modulus along the a, b and c axis by the following equations Ravindran ,
| (13) |
where =+2+2+2+2+2. For orthorhombic crystals,
| (14) |
and
| (15) |
are defined as the relative change of the b and c axis as a function of the deformation of the a axis. After calculation, we obtain values of and to be 0.8939 (0.9875) and 0.8309 (0.9135) for PuO2 (UO2), respectively. Results of , , and are presented in Table 4. Clearly, results of the directional bulk moduli show that both Pnma PuO2 and UO2 are easily compressed along a axis at 0 GPa. The longest axis c is the hardest axis for these two actinide dioxides. Directional bulk moduli of PuO2 are all bigger than the corresponding values of UO2. Moreover, using results of elastic constants included in previous study WangThO2 , the directional bulk moduli , , and of Pnma ThO2 are calculated to be 528.3, 406.3, and 415.8 GPa, respectively. This illustrates that, in contrary to Pnma PuO2 and UO2, the Pnma ThO2 is relatively harder to be compressed along a axis compared to other two axes. And all three directional bulk moduli of Pnma ThO2 are apparently smaller than that of Pnma PuO2 and UO2, which indicates relative weaker covalency of ThO2 compared with PuO2 and UO2 in their high pressure phase.
III.2.2 Debye temperature
| Compound | Phase | |||||
|---|---|---|---|---|---|---|
| PuO2 | Fmm | 11.892 | 2477.6 | 5206.3 | 2787.0 | 354.5 |
| PuO2 | Pnma | 12.812 | 2387.0 | 4976.0 | 2683.9 | 350.0 |
| NpO2 | Fmm | 11.347 | 2835.0 | 5566.5 | 3176.8 | 401.2 |
| UO2 | Fmm | 11.084 | 2841.8 | 5552.7 | 3183.4 | 398.1 |
| UO2 | Pnma | 11.957 | 2384.2 | 4948.5 | 2680.2 | 343.7 |
| ThO2 | Fmm | 9.880 | 2969.1 | 5575.5 | 3317.3 | 402.6 |
| ThO2 | Pnma | 10.505 | 2504.6 | 4738.4 | 2799.8 | 346.8 |
In study of the sound velocities and Debye temperature, our calculated results of AFM PuO2 and AFM UO2 in their fluorite phase and high pressure cotunnite phase are presented in Table 5. For comparison, results of NpO2 and ThO2 calculated by using the elastic data included in our previous studies WangNpO2 ; WangThO2 are also listed. As seen from Table 5, in their Fmm structure, Debye temperature and sound velocity of UO2, NpO2, and ThO2 are higher than that of PuO2. This is interestingly associated with the fact that Debye temperature () and Vickers hardness (H) of materials follow an empirical relationship Abrahams :
| (16) |
where M is molar mass and is molecular volume. Although Fmm PuO2 has close value of hardness compared with UO2 and NpO2, it has relatively smaller molecular volume and larger molar mass, as a consequence, has a lower Debye temperature than that of UO2 and NpO2. As for the Pnma structure, Debye temperature and sound velocity of PuO2, UO2, and ThO2 are lower than those of their Fmm structure. This is since that the Pnma PuO2, UO2, and ThO2 have smaller values of volume, bulk and shear moduli compared to their ground-state Fmm structure.
III.2.3 Hardness
Hardness is also one fundamental physical quantity when considering the phase stability and mechanical properties. According to the hardness conditions Kaner , the hardness is closely related to interatomic distances, number of nearest neighbors, directional bonding, anisotropy, and the indenter orientation in the structures. To date there is still no available calculation method involving hardness anisotropy in different dimensions in the literature. In spite of that, however, recently a semiempirical approach of hardness was raised by Simunek and Vackar SimunekPRL ; SimunekPRB in terms of the atomistic bond strength properties. This approach has been successfully tested by the authors on the more than 30 binary structures with zinc blende, cubic fluorite, rock salt crystals, and also for highly covalent crystals SimunekPRL ; SimunekPRB . There is no need for all those high-symmetry structures to consider the anisotropy. Also, this method has been applied to the crystals involving covalent and ionic bonding characters, such as in the compounds of transition metal and light atoms, and generalized to the complex structure with more than two different bond strengths SimunekPRL ; SimunekPRB . Moreover, in study of covalent crystals, the results of the method raised by Simunek and Vackar SimunekPRL ; SimunekPRB agree well with those of another hardness method of Gao and co-workers GaoPRL . Therefore, the hardness of optimized cubic fluorite structures of actinide dioxides can be calculated by the method of Simunek and Vackar SimunekPRL ; SimunekPRB . In the case of two atoms 1 and 2 forming one bond of strength s12 in a unit cell of volume , the expression for hardness has the form SimunekPRL
| (17) |
where
| (18) |
and
| (19) |
are the strength and ionicity of the chemical bond, respectively, and d12 is the interatomic distance; C=1550 and =4 are constants. The radius ri is chosen to make sure that the sphere centered at atoms i in a crystal contains exactly the valence electronic charge Zi. For fluorite structure PuO2, b12=32 counts the interatomic bonds between atoms Pu (1) and O (2) in the unit cell, n1=8 and n2=4 are coordination numbers of atom Pu and O, respectively, r1=1.698 (Å) and r2=1.005 (Å) are the atomic radii for Pu and O atoms, respectively, Z1=16 and Z2=6 are valence charge for Pu and O atoms, respectively, d12=2.32 (Å) is the interatomic distance, and =154.16 (Å3) is the volume of unit cell. As for fluorite UO2, b12=32, n1=8, n2=4, r1=1.737 (Å), r2=1.003 (Å), Z1=14, Z2=6, d12=2.36 (Å), =161.82 (Å3). Using Eqs. (14)-(16), we obtain s12=0.1010 and f2=0.0503 for PuO2 and s12=0.0919 and f2=0.0219 for UO2. Therefore, the hardness of PuO2 at its ground-state fluorite structure can be described as H=26.6 (GPa) and for UO2 H=25.8 (GPa). Clearly, the hardness of PuO2, almost equal to the hardness of NpO2 (26.5 GPa) WangNpO2 , is slightly larger than that of UO2. Besides, these three values of hardness are all larger than that of ThO2 (22.4 GPa) WangThO2 .
III.2.4 Theoretical tensile strength
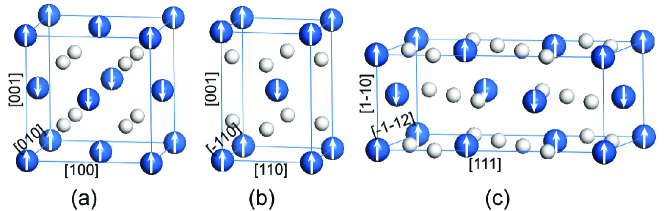
Although many efforts have been paid on PuO2, little is known on its theoretical tensile strength. The ideal strength of materials is the stress that is required to force deformation or fracture at the elastic instability. Although the strength of a real crystal can be changed by the existing cracks, dislocations, grain boundaries, and other microstructural features, its theoretical value can never be raised, i.e., the theoretical strength sets an upper bound on the attainable stress. Here, we employ a first-principles computational tensile test (FPCTT) Zhang to calculate the stress-strain relationship and obtain the ideal tensile strength by deforming the PuO2 crystals to failure. The anisotropy of the tensile strength is tested by pulling the initial fluorite structure along the [001], [110], and [111] directions. As shown in Fig. 4, three geometric structures are constructed to investigate the tensile strengthes in the three typical crystallographic directions: 4(a) shows a general fluorite structure of PuO2 with four Pu and eight O atoms; 4(b) a body-centered tetragonal (bct) unit cell with two Pu and four O; and 4(c) a orthorhombic unit cell with six Pu and twelve O. In FPCTT, the tensile stress is calculated according to the Nielsen-Martin scheme Nielsen = where is the strain tensor (=1,2,3) and is the volume at the given tensile strain. Tensile process along the [001], [110], and [111] directions is implemented by increasing the lattice constants along these three orientations step by step. At each step, the structure is fully relaxed until all other five stress components vanished except that in the tensile direction.

| Direction | Stress (GPa) | Strain |
|---|---|---|
| [001] | 81.2 | 0.36 |
| 28.3 | 0.22 | |
| 16.8 | 0.18 |
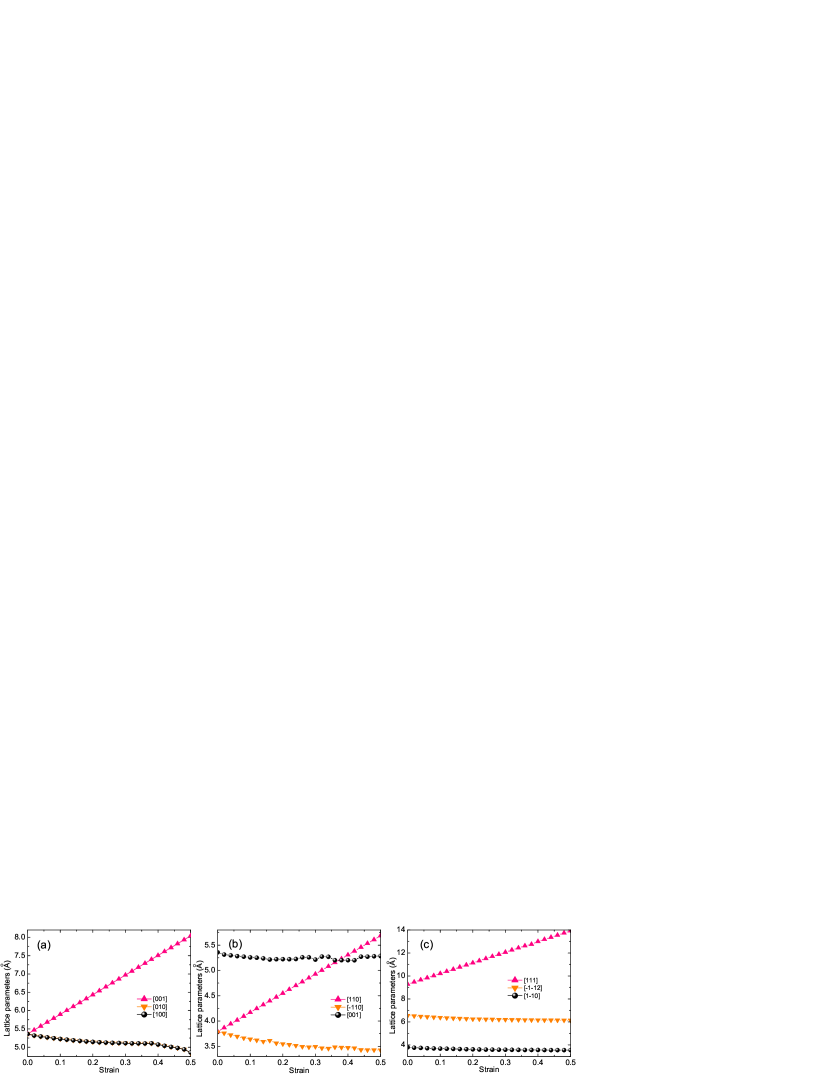
The calculated total energy, stress, and spin moments as functions of uniaxial tensile strain for AFM PuO2 in the [001], [110], and [111] directions are shown in Fig. 5. Clearly, all three energy-strain curves increase with increasing tensile strain, but one can easily find the inflexions by performing differentiations. Actually, at strains of 0.36, 0.22, and 0.18, the stresses reach maxima 81.2, 28.3, and 16.8 GPa for pulling in the [001], [110], and [111] directions, respectively. For clear comparison, all these maximum stresses (i.e., the theoretical tensile strengthes in the three typical crystalline orientations) and the corresponding strains are listed in Table 6. Our results indicate that the [001] direction is the strongest tensile direction and [111] the weakest. In fact, there are eight PuO bonds per formula unit for fluorite PuO2. The angle of all eight bonds with respect to the pulling direction is 45∘ in [001] direction. However, in [110] direction only four bonds make an angle of 45∘ with the pulling direction. Four other bonds are vertical to the pulling direction. In [111] direction, two bonds are parallel to the pulling direction and six others make an angle of about 19.5∘ with the pulling direction. The bonds vertical to the pulling direction have no contributions on the tensile strength and the bonds parallel to the pulling direction are easy to fracture under tensile deformation. Therefore, the fact that the tensile strength along the [001] direction is stronger than that along other two directions is understandable. Besides, we note that the stress in [110] direction experiences an abrupt decrease process after strain up to 0.24. This is due to the fact that the corresponding four PuO bonds (make an angle of 45∘ with the pulling direction) have been pulled to fracture. The fracture behaviors have been clarified by plotting valence electron charge density maps (not shown). Under the same strain, the abrupt increase of spin moment can be clearly seen [Fig. 5(c)]. While the spin moments in [110] and [111] directions only increase from 4.13 to 4.23 and 4.33 , respectively, the spin moments in [001] direction increase up to 5.27 at the end of tensile deformation. In addition, the evolutions of the lattice parameters with strain in all three tensile processes are presented in Fig. 6. One can see from Fig. 6 that along with the increase of the lattice parameter in the pulling direction, other two lattice parameters vertical to the pulling direction are decrease smoothly. In [001] direction, the evolutions of the lattice parameters along [100] and [010] directions are absolutely same due to the structural symmetry. For all three tensile deformations, no structural transition has been observed in our present FPCTT study.
III.3 Phonon dispersion and thermodynamic properties of fluorite PuO2
To our knowledge, no experimental phonon frequency results have been published for PuO2. In 2008, Yin and Savrasov Yin successfully obtained the phonon dispersions of both UO2 and PuO2 by employing the LDA+DMFT scheme. They found that the dispersive longitudinal optical (LO) modes do not participate much in the heat transfer due to their large anharmonicity and only longitudinal acoustic (LA) modes having large phonon group velocities are efficient heat carriers. In 2009, Minamoto et al. Minamoto investigated the thermodynamic properties of PuO2 based on their calculated phonon dispersion within the pure GGA scheme. In present work, we have calculated the Born effective charges and dielectric constants of PuO2 before phonon dispersion calculation due to their critical importance to correct the LO-TO splitting. For fluorite PuO2, the effective charge tensors for both Pu and O are isotropic because of their position symmetry. After calculation, the Born effective charges of Pu and O ions for AFM PuO2 are found to be =5.12 and =2.56, respectively, within LDA+U formalism with the choice of = eV. In addition, the macroscopic static dielectric tensor is also isotropic and our computed value of dielectric constant is 5.95 for the AFM phase. As for phonon dispersion, the Hellmann-Feynman theorem and the direct method Parlinski are employed to calculate the phonon curves along directions in the BZ, together with the phonon density of states. We use 222 fcc supercell containing 96 atoms and 333 Monkhorst-Pack k-point mesh for the BZ integration. In order to calculate the Hellmann-Feynman forces, we displace four atoms (two Pu and two O atoms) from their equilibrium positions and the amplitude of all the displacements is 0.02 Å.

The calculated phonon dispersion curves are displayed in Fig. 7 for the AFM phase of PuO2. In the fluorite primitive cell, there are only three atoms (one Pu and two O atoms). Therefore, nine phonon modes exist in the dispersion relations. One can see that the LO-TO splitting at point becomes evident by the inclusion of polarization effects. In addition, due to the fact that plutonium atom is heavier than oxygen atom, the vibration frequency of plutonium atom is lower than that of oxygen atom. As a consequence, the phonon density of states for PuO2 can be viewed as two parts. One is the part lower than 6.4 THz where the main contribution comes from the plutonium sublattice, while the other part higher than 6.4 THz are dominated by the dynamics of the light oxygen atoms.
Thermodynamic properties of AFM PuO2 calculated within LDA+U formalism with the choice of = eV are determined by phonon calculation using the quasiharmonic approximation Siegel , under which the Gibbs free energy G(T,P) is written as
| (20) |
Here, F(T,V) is the Helmholtz free energy at temperature T and volume V and can be expressed as
| (21) |
where E(V) is the ground-state total energy, Fph(T,V) is the phonon free energy and Fel(T,V) is the thermal electronic contribution. In present study, we focus only on the contribution of atom vibrations. The Fph(T,V) can be calculated by
| (22) |
where = represents the volume-dependent phonon frequencies and is the phonon DOS.

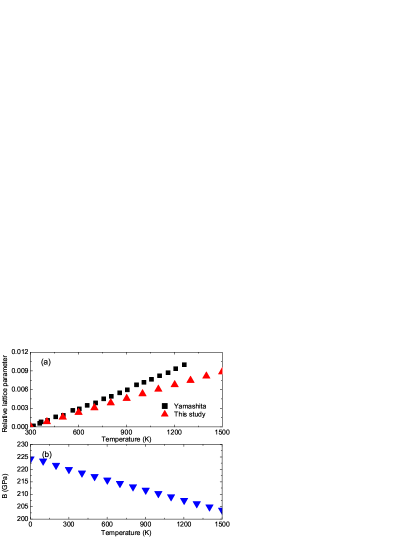
In calculation of , the ground-state total energy and phonon free energy should be calculated by constructing several 222 fcc supercells. The temperature T appears in via the phonon term only. Calculated free energy curves of PuO2 for temperature ranging from 0 up to 1500 K are shown in Fig. 8. The locus of the equilibrium lattice parameters at different temperature T are also presented. The equilibrium volume V(T) and the bulk modulus B(T) are obtained by EOS fitting. Figure 9 shows the temperature dependence of the relative lattice parameter and the bulk modulus. Experimental results Yamashita are also plotted. Clearly, the lattice parameter increases approximately in the same ratio as that in experiment Yamashita . The bulk modulus B(T) is predicted to decrease along with the increase of temperature. This kind of temperature effect is very common for compounds and metals. Besides, the specific heat at constant volume can be directly calculated through
| (23) |
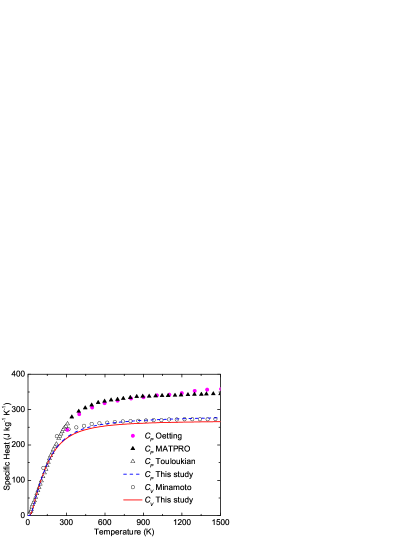
while the specific heat at constant pressure can be evaluated by the thermodynamic relationship , where the isobaric thermal expansion coefficient can be calculated according to the formula . Calculated and are presented in Fig. 10. Clearly, the calculated is in good agreement with experiment Minamoto in all investigating temperature domain, while the predicted only accords well with the corresponding experimental data Touloukian below 300 K due to the intrinsic fact that near zero temperature and approach to the same value. The disagreement of between theory and experiments Oetting ; MATPRO in high temperature domain is believed to mainly originate from the quasiharmonic approximation we use.
III.4 High pressure behavior of PuO2
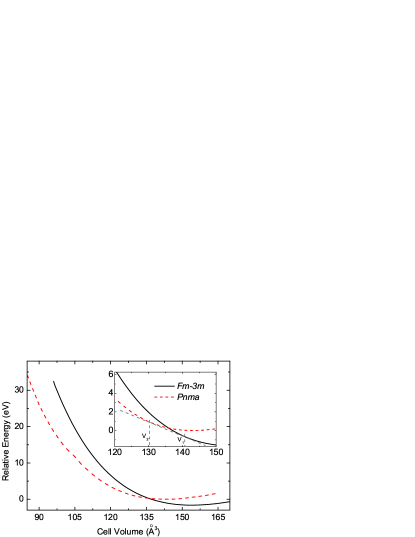
In the following, we will focus our attention on the behavior of plutonium dioxide under hydrostatic compression. Two experimentally established structures, Fmm and Pnma phases, are investigated in detail. The relative energies (per unit cell) of the two phases at different volumes are calculated and shown in Fig. 11. Obviously, the Fmm phase is stable under ambient pressure while under high pressure the Pnma phase becomes stable. According to the rule of common tangent of two energy curves, a phase transition at 24.3 GPa is predicted by the slope shown in the inset of Fig. 11. Besides, we also determine the phase transition pressure by comparing the Gibbs free energy as a function of pressure. At 0 K, the Gibbs free energy is equal to enthalpy H, expressed as H=E+PV. The crossing between the two enthalpy curves (not shown) also gives phase transition pressure of 24.3 GPa, which is fully consistent with above result in terms of the common tangent rule. This value is smaller by 15 GPa when compared to the experiment measurement by Dancausse et al Dancausse . We notice that Li et al Li predicted a transition pressure of about 45 GPa employing the full-potential linear-muffin-tin-orbital (FPLMTO) method. However, they only considered the NM and FM phases in their calculations of the Fmm and Pnma PuO2. No results were calculated for the AFM phase. In our present study, we first optimize the Pnma PuO2 at constant volume (about 125.2 Å3) of the experimental value at 39 GPa Dancausse . Our calculated structural parameters of the NM, FM, and AFM phases are tabulated in Table 7. Obviously, the AFM phase is the most stable phase and its structural parameters are well consistent with experiment. As seen in Table 7, results of AFM phase at 49 GPa is also consistent with experiment. Therefore, we will only consider the results of AFM phase in the following discussion. In addition, obvious discrepancy between two works Idiri ; Dancausse from the same experimental group involving the transition pressure of ThO2 was noticed in our previous study WangThO2 . While the transition was reported firstly to start at 40 GPa Dancausse , later, through improving experimental measurement technique, which can capture the two phases cohabitation zone during transition process, Idiri et al Idiri observed that the transition really begins around 33 GPa. Our previous study WangThO2 predicted that the phase transition of ThO2 started at around 26.5 GPa. Idiri et al Idiri also stated that the bulk modulus of PuO2 were largely overestimated in their previous work Dancausse . Thus, we believe that their former report Dancausse also overestimated the transition pressure of PuO2 in some degree. So the predicted transition pressure of PuO2, which is very close to that of ThO2 WangThO2 , is understandable.
| Magnetism | a | b | c | Pressure | Relative Energy |
|---|---|---|---|---|---|
| NM | 6.502 | 3.165 | 6.087 | 82.9 | 32.87 |
| FM | 7.478 | 3.088 | 5.424 | 124.2 | 31.80 |
| AFM | 5.585 | 3.410 | 6.577 | 38.6 | 1.90 |
| Expt. | 5.64 | 3.38 | 6.57 | 39 | |
| Expt. | 5.62 | 3.44 | 6.49 | 49 | |
| AFM | 5.492 | 3.398 | 6.539 | 48.8 | 2.80 |
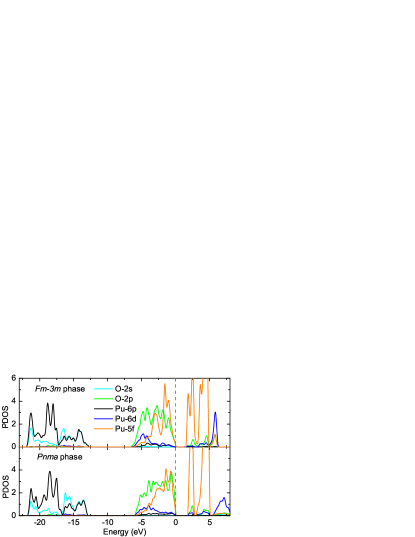
Figure 12 compares the PDOS of the Fmm and Pnma phases of PuO2 at a pressure of around 25 GPa, close to the transition pressure. One can see evident increase of the band gap from 1.51 eV in the fluorite phase to 1.65 eV in the cotunnite phase. In study of UO2, Geng et al Geng also predicted this similar behavior. However, our previous study of ThO2 WangThO2 found that the band gap is reduced from Fmm phase to Pnma phase. The reason is simply that ThO2 is a charge-transfer insulator, while PuO2 and UO2 are the Mott-type insulators. From Fig 12, one can see that while O 2 and Pu 6 states expand in the low bands, O 2 and Pu 5/6 states are mainly featured near the Fermi level and have prominent hybridization characters in a width of 6.3 (5.9) eV for Fmm (Pnma) phase. There is no evident difference between the two phases in their 5 electronic localization behavior. Therefore, our study of PuO2 supports our previous WangThO2 viewpoint: the phenomenon of volume collapse during high-pressure phase transition of the actinide dioxides is mainly attributed to the ionic (instead of electronic) response to the external compression.
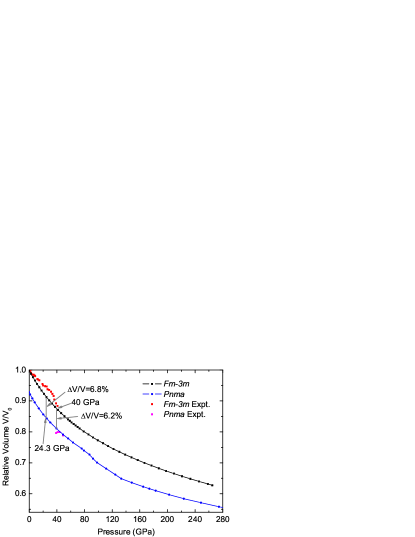
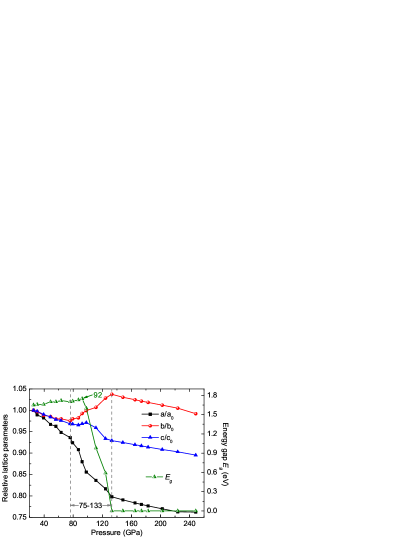
The relative volume V/V0 evolution with pressure for PuO2 in both Fmm and Pnma phases are shown in Fig 13. For comparison, the experimental Dancausse data are also shown in the figure. Clearly, our calculated P-V equation of state is well consistent with the experimental measurement for the two phases of PuO2. Specially, at the calculated transition pressure (24.3 GPa), our result in Fig. 13 gives that the volume collapse upon phase transition is 6.8%. This value is evidently underestimated compared with the experimental data of 12% Dancausse . The discrepancy between experiment and our calculation needs more experimental and theoretical works to examine. After phase transition, we also find an isostructural transition occurring between 75 and 133 GPa for the Pnma phase. This isostructural transition of actinide dioxides was first found in DFT calculations of UO2 by Geng et al Geng and then observed in study of ThO2 WangThO2 . The pressure dependence of the three lattice parameters (with respect to their values at calculated transition pressure 24.3 GPa) for the Pnma phase of PuO2 are plotted in Fig. 14. Similar to the studies of UO2 and ThO2 Geng ; WangThO2 , in pressure region before 75 GPa, the responses of the three relative lattice parameters to the compression are anisotropic in the sense that the compression of the middle axis is most rapid compared to those of the long axis and small axis , which vary upon compression almost in the same tendency. When the pressure becomes higher to be between 75 and 133 GPa, remarkably, it reveals in Fig. 14 that all the three relative lattice parameters undergo dramatic variations by the fact that the small axis has a strong rebound and the middle is collapsed. When the pressure is beyond 133 GPa, then the variations of the three relative lattice parameters become smooth and approach isotropic compression. This signifies a typical isostructural transition for the Pnma phase of PuO2.
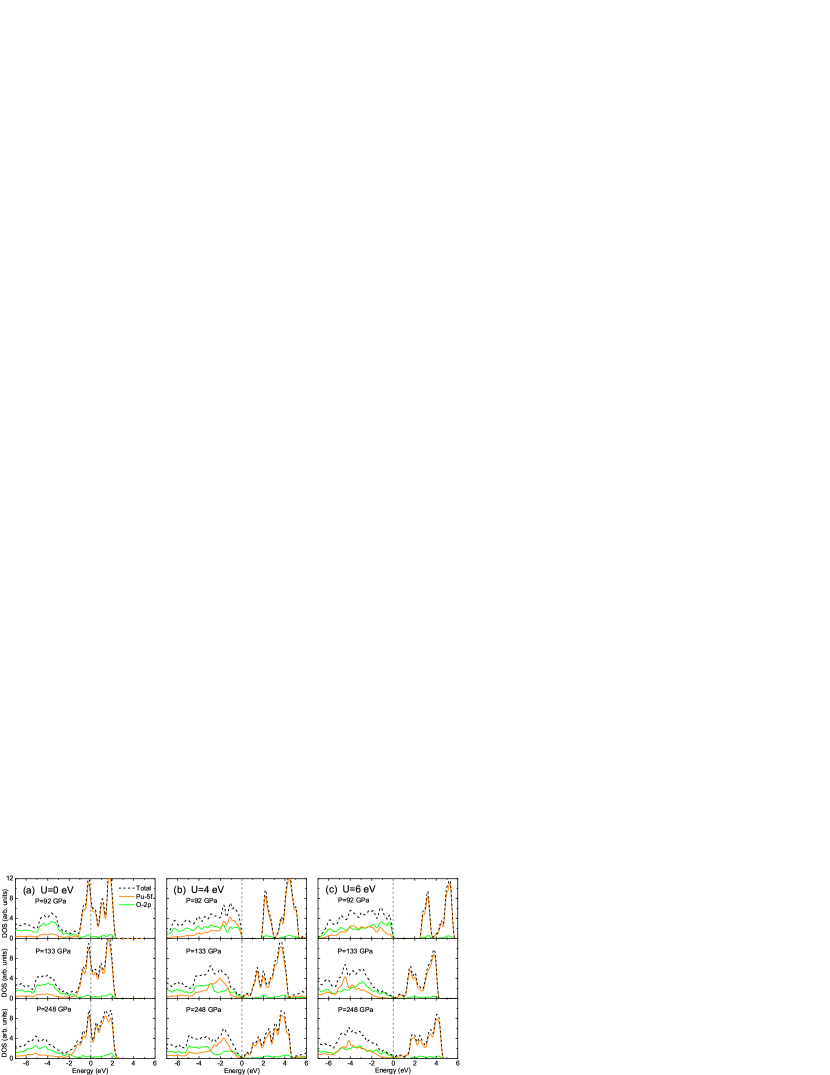
Moreover, we also present in Fig. 14 the evolution of the insulating band gap with pressure for Pnma phase of PuO2. Apparently, the band gap behaves smooth in pressure region of 25-92 GPa, then turns to decrease suddenly from about 1.75 eV to zero under compression from 92 to 133 GPa. This clearly indicates that the Pnma phase will occur a metallic transition after external pressure exceeds 133 GPa. As Fig. 15(b) shows, with increasing pressure in the crossover range between 92 and 133 GPa, the 5 electrons in the cotunnite phase of PuO2 are more delocalized and the 5 bands are largely broadened. As a result, the Mott-type band gap is narrowed and even blurred, which is characterized by finite occupancies of O 2 and Pu 5 orbitals at the Fermi level, by the increasing kinetic energy of 5 electrons. In order to see the pressure behavior of electronic structure with different values of Hubbard parameter U for cotunnite PuO2, we have plotted in Fig. 15 the total DOS and PDOS for the cotunnite PuO2 AFM phase calculated at 92, 133, and 248 GPa within LDA+U formalism with U=0, 4, and 6 eV. It clearly shows that (i) the pure LDA always produces incorrect electronic structure in the full pressure region we considered, and (ii) it is not imperative to adjust as varying pressure by the fact revealed in Figs. 15(b) and 15(c) that the electronic properties and insulator-metal transition behavior at high pressures show the similar character for the two choices of Hubbard parameter = eV and = eV. Based on this observation, in the above high-pressure calculations we have fixed the value of to be eV. It should be stressed that the metallic transition is not unique for PuO2. Similar phenomenon has also been observed in other actinide dioxides Geng . Besides, the variation of the local magnetic moment of plutonium atoms is almost same for Fmm and Pnma phases, implying that the magnetic property is insensitive to the structure transition in PuO2. Actually, the calculated amplitude of local spin moment varies from 4.1 to 3.8 (per Pu atom) for both fluorite and cotunnite phases in pressure range from 0 to 255 GPa. No paramagnetic transition for this material has been observed in present study.
IV CONCLUSIONS
In conclusion, the ground state properties as well as the high pressure behavior of PuO2 were studied by means of the first-principles DFT+U method. By choosing the Hubbard U parameter around 4 eV within the LDA+U approach, the electronic structure, lattice parameters, and bulk modulus were calculated for both the ambient Fmm and the high-pressure Pnma phases of PuO2 and were shown to accord well with experiments. Results for UO2 were also presented for comparison. Based on these results, the PuO and UO bonds were interpreted as displaying a mixed ionic/covalent character by electronic structure analysis. After comparing with our previous calculations of NpO2 and ThO2, we demonstrated that the PuO, UO, and NpO bonds have stronger covalency than the ThO bond. The ionicity of ThO bond was found to be the largest among these four kinds of actinide dioxides. In addition, the stability of the two phases at zero pressure was predicted through calculating elastic constants and phonon dispersion. The hardness, Debye temperature, ideal tensile strength, and thermodynamic properties were calculated and analyzed to support the practical application of PuO2. We showed that the hardness of Fmm phase is 27 GPa and the Debye temperatures of Fmm and Pnma phases are 354.5 and 350.0 K, respectively. For Fmm PuO2, the ideal tensile strengths are calculated within FPCTT to be 81.2, 28.3, and 16.8 GPa in tensile deformations along the [100], [110], and [111] directions, respectively. The volume thermal expansion and specific heat at constant volume curves are well consistent with available experiments. However, the discrepancy between measured and our calculated specific heat at constant pressure in high temperature domain is evident. This needs further theoretical work by including the anharmonic ionic contribution to decrease this kind of discrepancy.
In studying the pressure behavior of PuO2, we showed that the FmmPnma transition occurs at 24.3 GPa. Although this value is large smaller than the experimental report, we believe that our calculated result is reasonable. One reason is that the lattice parameters of Pnma PuO2 AFM phase calculated at around 39 and 49 GPa are precisely consistent with experiment. Another is the fact that the experiment needs improvement as having been indicated in study of UO2 and ThO2 Idiri . Furthermore, we extended the pressure up to 280 GPa for the two structures of PuO2. A metallic transition at around 133 GPa and an isostructural transition in pressure range of 75-133 GPa were predicted for the Pnma phase. Also, the calculated amplitude of local spin moment only varies from 4.1 to 3.8 (per Pu atom) for both fluorite and cotunnite phases in pressure range from 0 to 255 GPa. No paramagnetic transition for this material has been observed.
Acknowledgements.
We gratefully thank G. H. Lu, H. B. Zhou, and X. C. Li for illustrating discussion on FPCTT. This work was supported by the Foundations for Development of Science and Technology of China Academy of Engineering Physics under Grant No. 2009B0301037.References
- (1) S. Heathman et al., Science 309, 110 (2005).
- (2) I. D. Prodan, G. E. Scuseria, and R. L. Martin, Phys. Rev. B 76, 033101 (2007).
- (3) R. Atta-Fynn and A. K. Ray, Phys. Rev. B 76, 115101 (2007).
- (4) K. T. Moore and G. van der Laan, Rev. Mod. Phys. 81, 235 (2009).
- (5) J. M. Haschke, T. H. Allen, and L. A. Morales, Science 287, 285 (2000).
- (6) M. Butterfield, T. Durakiewicz, E. Guziewicz, J. Joyce, A. Arko, K. Graham, D. Moore, and L. Morales, Surf. Sci. 571, 74 (2004).
- (7) T. Gouder, A. Seibert, L. Havela, and J. Rebizant, Surf. Sci. 601, L77 (2007).
- (8) J. P. Dancausse, E. Gering, S. Heathman, and U. Benedict, High Press. Res. 2, 381 (1990).
- (9) C. E. Boettger and A. K. Ray, Int. J. Quantum Chem. 90, 1470 (2002).
- (10) C. McNeilly, J. Nucl. Mater. 11, 53 (1964).
- (11) S. L. Dudarev, D. N. Manh, and A. P. Sutton, Philos. Mag. B 75, 613 (1997).
- (12) S. L. Dudarev, G. A. Botton, S. Y. Savrasov, C. J. Humphreys, and A. P. Sutton, Phys. Rev. B 57, 1505 (1998).
- (13) S. L. Dudarev, M. R. Castell, G. A. Botton, S. Y. Savrasov, C. Muggelberg, G. A. D. Briggs, A. P. Sutton, and D. T. Goddard, Micron 31, 363 (2000).
- (14) I. D. Prodan, G. E. Scuseria, J. A. Sordo, K. N. Kudin, and R. L. Martin, J. Chem. Phys. 123, 014703 (2005).
- (15) L. Petit, A, Svane, Z. Szotek, W. M. Temmerman, and G. M. Stocks, Phys. Rev. B 81, 045108 (2010).
- (16) B. Sun, P. Zhang, and X.-G. Zhao, J. Chem. Phys. 128, 084705 (2008).
- (17) B. Sun and P. Zhang, Chin. Phys. B 17, 1364 (2008).
- (18) D. A. Andersson, J. Lezama, B. P. Uberuaga, C. Deo, and S. D. Conradson, Phys. Rev. B 79, 024110 (2009).
- (19) G. Jomard, B. Amadon, F. Bottin, and M. Torrent, Phys. Rev. B 78, 075125 (2008).
- (20) H. Shi, M. Chu, and P. Zhang, J. Nucl. Mater. 400, 151 (2010).
- (21) Q. Yin and S. Y. Savrasov, Phys. Rev. Lett. 100, 225504 (2008).
- (22) R. F. W. Bader, Atoms in Molecules: A Quantum Theory (Oxford University Press, New York, 1990).
- (23) W. Tang, E. Sanville, and G. Henkelman, J. Phys.: Condens. Matter 21, 084204 (2009).
- (24) H. Y. Geng, Y. Chen, Y.Kaneta, and M. Kinoshita, Phys. Rev. B 75, 054111 (2007).
- (25) B. T. Wang, H, Shi, W. D. Li, and P. Zhang, J. Nucl. Mater. 399, 181 (2010).
- (26) P. E. Blöchl, Phys. Rev. B 50, 17953 (1994).
- (27) G. Kresse and J. Furthmüller, Phys. Rev. B 54, 11169 (1996).
- (28) W Kohn, L J Sham, Phys. Rev. 140 (1965) A1133.
- (29) J. P. Perdew, K. Burke, and Y. Wang, Phys. Rev. B 54, 16533 (1996).
- (30) H. J. Monkhorst and J. D. Pack, Phys. Rev. B 13, 5188 (1972).
- (31) S. L. Dudarev, D. N. Manh, and A. P. Sutton, Philos. Mag. B 75, 613 (1997).
- (32) B. T. Wang, H. Shi, W. D. Li, and P. Zhang, Phys. Rev. B 81, 045119 (2010).
- (33) C. E. Boettger and A. K. Ray, Int. J. Quantum Chem. 80, 824 (2000).
- (34) I. D. Prodan, G. E. Scuseria, and R. L. Martin, Phys. Rev. B 73, 045104 (2006).
- (35) F. Birch, Phys. Rev. 71, 809 (1947).
- (36) J. F. Nye, Physical Properties of Crystals (Oxford University Press, Oxford, 1985).
- (37) R. Hill, Phys. Phys. Soc. London 65, 349 (1952).
- (38) J. Hanies, J. M. Leger, and G. Bocquillon, Annu. Rev. Mater. Res. 31, 1 (2001).
- (39) J. P. Watt, J. Appl. Phys. 50, 6290 (1979).
- (40) P. Ravindran, L. Fast, P.A. Korzhavyi, B. Johansson, J. Wills, O. Eriksson, J. Appl. Phys. 84, 4891 (1998)
- (41) M. Idiri, T. Le Bihan, S. Heathman, and J. Rebizant, Phys. Rev. B 70, 014113 (2004).
- (42) S. C. Abrahams and F. S. L. Hsu, J. Chem. Phys. 63, 1162 (1975).
- (43) R. B. Kaner, J. J. Gilman, and S. H. Tolbert, Science 308, 1268 (2005).
- (44) A. Simunek and J. Vackar, Phys. Rev. Lett. 96, 085501 (2006).
- (45) A. Simunek, Phys. Rev. B 75, 172108 (2007).
- (46) F. Gao, J. He. E. Wu, S. Liu, D. Yu, D. Li, S. Zhang, and Y. Tian, Phys. Rev. Lett. 91, 015502 (2003).
- (47) Y. Zhang, G. H. Lu, S. H. Deng, T. M. Wang, H. B. Xu, M. Kohyama, and R. Yamamoto, Phys. Rev. B 75, 174101 (2007).
- (48) O. H. Nielsen and R. M. Martin, Phys. Rev. B 32, 3780 (1987).
- (49) S. Minamoto, M. Kato, K. Konashi, and Y. Kawazoe, J. Nucl. Mater. 385, 18 (2009).
- (50) K. Parlinski, Z-.Q. Li, and Y. Kawazoe, Phys. Rev. Lett. 78, 4063 (1997).
- (51) A. Siegel, K. Parlinski, and U. D. Wdowik, Phys. Rev. B 74, 104116 (2006).
- (52) T. Yamashita, N. Nitani, T. Tsuji, and H. Inagaki, J. Nucl. Mater. 247, 90 (1997).
- (53) Y. S. Touloukian, R. K. Kirby, R. E. Taylor, T. Y. R. Lee, Thermal Expansion-nonmetallic Solids, The TRPC DATA Series, Vol. 13 (Plenum, New York, 1977).
- (54) F. L. Oetting, J. Nucl. Mater. 105, 257 (1982).
- (55) MATPRO-A Library of Materials Properties for Light-Water-Reactor Accident Analysis in: SCDAP/RELAP5/MOD3.1 Code Manual, Vol IV, NUREG/CR-6150 EGG-2720 (INEL, USA, 1993).
- (56) S. Li, R. Ahuja, and B. Johansson, High Press. Res. 22, 471 (2002).