GSC 2314-0530: the shortest-period eclipsing system with dMe components ††thanks: Based on the data obtained at Rozhen National Astronomical Observatory, and the Northern Sky Variability Survey
Abstract
CCD photometric observations in colors and spectroscopic observations of the newly discovered eclipsing binary GSC 2314-0530 (NSVS 6550671) with dMe components and very short period of days are presented. The simultaneous light-curve solution and radial velocity solution allows to determine the global parameters of GSC 2314-0530: K; K; M☉; M☉; R☉; R☉; L☉; L☉; ; R☉; pc. The chromospheric activity of its components is revealed by strong emission in the H line (with mean ) and observed several flares. Empirical relations mass–, mass–radius and mass–temperature are derived on the basis of the parameters of known binaries with low-mass dM components.
keywords:
binaries: eclipsing – binaries: spectroscopic – stars: activity – stars: fundamental parameters – stars: late-type – stars: low-mass1 Introduction
Although the M dwarfs are the most numerous stars in our Galaxy, the mass, metalicity and age dependencies of their stellar luminosities and radii are poorly calibrated. The reason is the selection effect that plays against the detection of fainter and smaller stars.
Less than 20 binaries with low-mass dM components have empirically-determined masses, radii, luminosities and temperatures (see Section 5, Table 6). As a result the mass-luminosity relation is determined by only a few low-mass stars. This deficiency hindered the development of the models for the cool dense atmospheres of the M dwarfs. It is established that all available models underestimate the radii (by around 10–15 per cent) and overestimate the temperatures (by 200–300 K) of short-period binaries with dM components (Ribas, 2003; Maceroni & Montalban, 2004).
The Northern Sky Variability Survey (NSVS) contains a great number of photometric data (Wozniak et al., 2004) that allows searching of variable stars and determination of their periods and types of variability. A multiparametric method for search for variable objects in large datasets was tested on the NSVS (Dimitrov, 2009) and as a result many eclipsing stars were discovered. One of them was GSC 2314-0530 NSVS 6550671 (=02, =+).
On the base of the NSVS photometry obtained in 1999–2000 we derived the ephemeris:
| (1) |
and built its light curve (Fig. 1).

We found that this star has been assigned also as SWASP J022050.85+332047.6 according to the SuperWASP photometric survey (Pollacco et al., 2006). Norton et al. (2007) reported its coincidence with the ROSAT X-ray source 1RXS J022050.7+332049.
Initially GSC 2314-0530 attracted our interest by its short orbital period because there were only several systems with non-degenerate components and periods below the short-period limit of 0.22 days (Rucinski, 2007): GSC 1387-0475 with d (Rucinski, 2007; Rucinski & Pribulla, 2008), ASAS J071829-0336.7 with d (Pribulla et al., 2009), the star V34 in the globular cluster 47 Tuc with d (Weldrake et al., 2004) and BW3 V38 with orbital period d (Maceroni & Rucinski, 1997; Maceroni & Montalban, 2004).
When we established that the components of GSC 2314-0530 were dM stars our interest increased and we undertook intensive photometric and spectral observations in order to determine its global parameters and to add a new information for the dM stars as well as for the short-period binaries.
2 Observations and data reduction
2.1 New photometry
The CCD photometry of GSC 2314-0530 in bands was carried out at Rozhen National Astronomical Observatory with the 2-m RCC telescope equipped with VersArray CCD camera (1300 1340 pixels, 20 m pixel, field of 5.25 5.35 arcmin) as well as with the 60-cm Cassegrain telescope using the FLI PL09000 CCD camera (3056 3056 pixels, 12 m pixel, field of 17.1 17.1 arcmin). The average photometric precision per data point was 0.005 – 0.008 mag for the 60-cm telescope and 0.002 – 0.003 mag for the 2-m telescope. Table 1 presents the journal of our photometric observations.
It should be noted that the observations on 2009 December 30 are synchronous in the colors.
| Date | HJD(start) | Phases | Filter | Exp. [s] | N | Telescope |
|---|---|---|---|---|---|---|
| 2009 July 25 | 2455038.482662 | 0.725 – 1.298 | 120 | 126 | 60-cm | |
| 2009 July 26 | 2455039.484907 | 0.927 – 0.491 | 120 | 54 | 60-cm | |
| 2009 July 27 | 2455040.468322 | 0.032 – 0.693 | 120 | 83 | 60-cm | |
| 2009 July 28 | 2455041.501250 | 0.395 – 0.881 | 120 | 62 | 60-cm | |
| 2009 Oct. 21 | 2455126.412740 | 0.210 – 1.294 | 15 | 737 | 2-m | |
| 2009 Nov. 13 | 2455149.178102 | 0.393 – 1.389 | 10 | 850 | 2-m | |
| 2009 Nov. 13 | 2455149.375822 | 0.419 – 1.391 | 10 | 835 | 2-m | |
| 2009 Nov. 20 | 2455156.324421 | 0.489 – 0.521 | 120 | 3 | 60-cm | |
| 2009 Nov. 20 | 2455156.325521 | 0.495 – 1.862 | 60 | 183 | 60-cm | |
| 2009 Nov. 20 | 2455156.326088 | 0.498 – 0.529 | 30 | 3 | 60-cm | |
| 2009 Nov. 20 | 2455156.326493 | 0.500 – 0.531 | 30 | 3 | 60-cm | |
| 2009 Dec. 30 | 2455196.225416 | 0.610 – 1.785 | 120 | 65 | 60-cm | |
| 2009 Dec. 30 | 2455196.226516 | 0.616 – 1.791 | 60 | 65 | 60-cm | |
| 2009 Dec. 30 | 2455196.227256 | 0.619 – 1.810 | 60 | 65 | 60-cm |
Standard stars of Landolt (1992) and standard fields of Stetson (2000) were used for transition from the instrumental system of each telescope to standard photometric system.
The standard IDL procedures (adapted from DAOPHOT) were used for reduction of the photometric data. The standard stars were chosen on the basis of the method of Everett & Howell (2001) and Table 2 presents their colors. The values of are from the catalogue NOMAD (Zacharias et al., 2005) while the values of other parameters are our estimations.
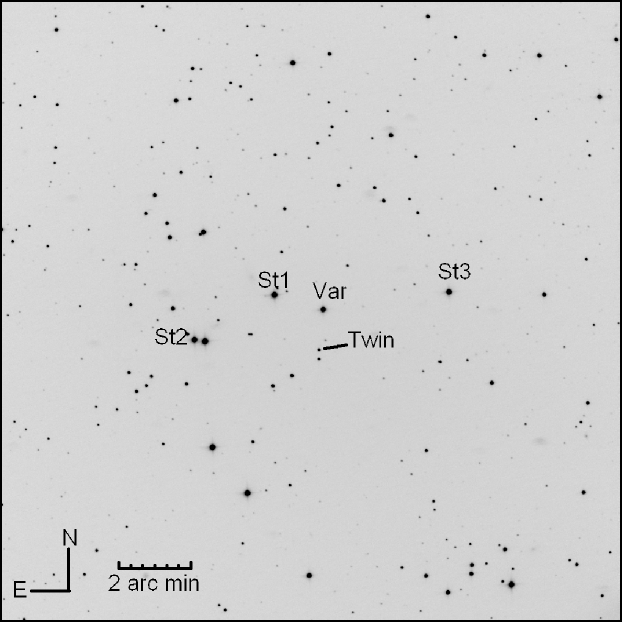
The field of the variable and standard stars is shown in Fig. 2.
| ID | pmRA | pmDE | ||||||
|---|---|---|---|---|---|---|---|---|
| GSC/USNO-B1 | [mag] | [mag] | [mag] | [mag] | [mag] | [mas yr-1] | [mas yr-1] | |
| Var | 2314-0530 | 13.36 | 1.18 | 0.88 | 2.38 | 0.87 | 144.0 | -112.0 |
| St1 | 2314-1784 | 12.12 | 0.30 | 0.25 | 0.57 | 0.29 | -000.8 | -008.3 |
| St2 | 2314-1378 | 12.24 | 0.29 | 0.24 | 0.58 | 0.34 | -000.1 | -001.6 |
| St3 | 2314-1655 | 12.40 | 0.22 | 0.20 | 0.46 | 0.27 | 005.5 | -004.0 |
| Twin | 1233-0046425 | 16.91 | 1.41 | 1.03 | 3.02 | 0.87 | 140.0 | -112.0 |
Table 3 presents a sample of our photometric data (the full table is available in the online version of the article, see Supporting Information).
| HJD | Magnitude | Filter |
|---|---|---|
| 2455156.329669 | 14.8530 | B |
| 2455156.332679 | 14.8490 | B |
| 2455156.335689 | 14.8300 | B |
| 2455126.417320 | 13.3610 | V |
| 2455126.418512 | 13.3618 | V |
| 2455126.419890 | 13.3619 | V |
| 2455126.420167 | 13.3624 | V |
| 2455126.420700 | 13.3547 | V |
| 2455126.420978 | 13.3583 | V |
| 2455126.421128 | 13.3609 | V |
Some of our photometric runs covering well the orbital cycle are presented in Fig. 3.

The Fourier analysis of all our photometric data performed by the software PERIOD-04 (Lenz & Breger, 2005) leads to the ephemeris:
| (2) |
The new-obtained period value is almost the same as that of the ephemeris (1) of the NSVS data that means that the orbital period of GSC 2314-0530 is stable.
The color indices of our target (Table 2) lead to M spectral type of the binary. Taking into account the almost equal eclipse depths of the light curve, i.e. the close temperatures of the components, as well as the short orbital period of the system, we may conclude that the two components of GSC 2314-0530 are dM stars.
The value of the obtained period is below the short-period limit and reveals that our target is the shortest-period binary with dM components.
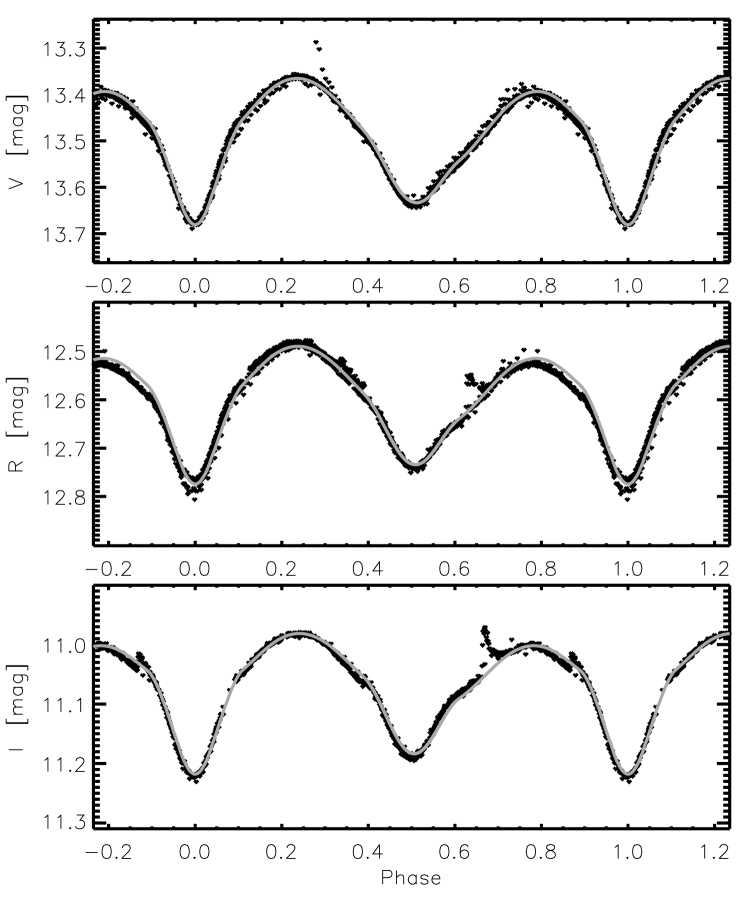
Figure 4 shows the folded light curves from all our photometric data phased according to the ephemeris (2).
2.2 Spectroscopy
We obtained 26 spectra of GSC 2314-0530 with resolution /pixel during November – December 2009 covering spectral range of around the H line. We used a CCD Photometrics AT200 camera with the SITe SI003AB 1024 1024 pixels chip mounted on the Coude spectrograph (grating BL632/14.7) on the 2-m RCC telescope at Rozhen.
The exposure time was 15 min during 2009 November 26 and 20 min during 2009 December 31 and 2010 January 01. All stellar integrations were alternated with Th-Ar comparison source exposures for wavelength calibration. The bias frames and flat-field integrations were obtained at the beginning and at the end of the night. The mean S/N ratio for our observations was around 24, i.e. acceptable for radial velocity determination. Table 4 presents the journal of our spectral observations.
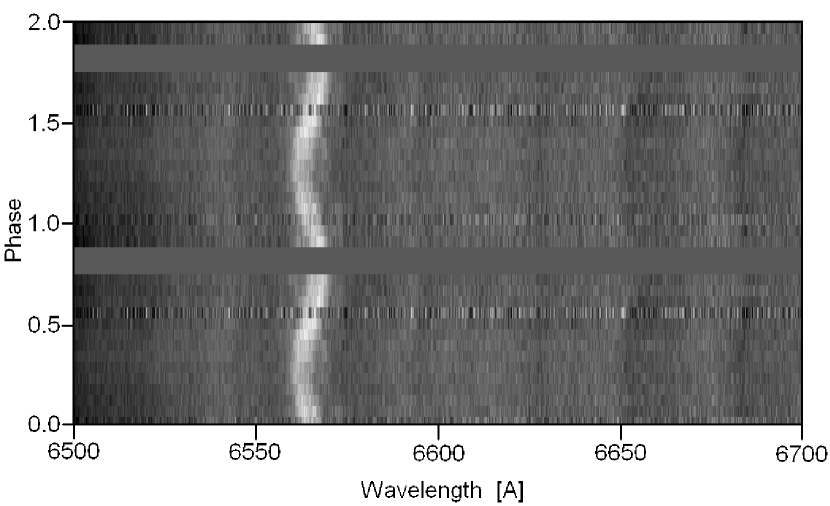
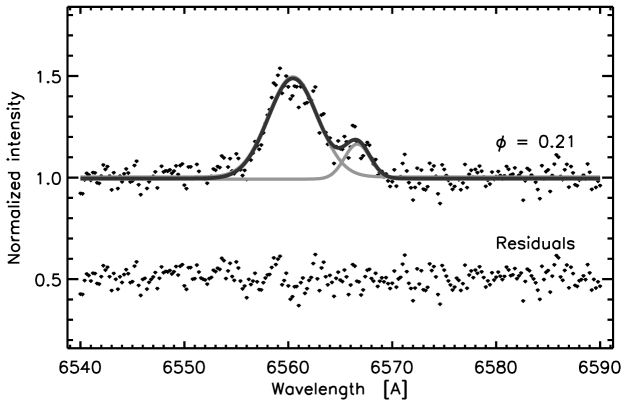
The reduction of the spectra was performed using IRAF packages by bias subtraction, flat fielding, cosmic ray removal, one-dimensional spectrum extraction and wavelength calibration. Figure 5 illustrates the orbital variability of the star spectra while Figure 6 presents the one-dimensional H profiles at some orbital phases.

3 Analysis of the spectral data
The obtained spectra of GSC 2314-0530 show wide emission H lines implying high rotational velocities as well as absorption TiO bands at and (Fig. 5). These spectral features suggest a dMe classification of GSC 2314-0530.
The spectral contribution of the secondary component is visible only in the H line (Fig. 5). That is why we determined the radial velocities of the two stellar components by fitting the H lines at each phase with Gaussians (Fig. 7).
Table 4 and Figure 8 present the radial velocities of the stellar components of GSC 2314-0530. Their fit corresponds to values km s-1, km s-1 and km s-1. They lead to mass ratio and binary separation R☉.

| No | HJD | S/N | phase | |||||
|---|---|---|---|---|---|---|---|---|
| [km s-1] | [km s-1] | [] | ||||||
| 01 | 2455162.375293 | 23 | 0.88 | 89.2 | -157.5 | 4.97 | ||
| 02 | 2455162.385975 | 19 | 0.93 | 42.8 | 4.56 | |||
| 03 | 2455162.396657 | 22 | 0.99 | -9.3 | 3.61 | |||
| 04 | 2455162.407335 | 21 | 0.04 | -57.9 | 63.0 | 6.64 | ||
| 05 | 2455162.418012 | 27 | 0.10 | -68.0 | 99.1 | 4.34 | ||
| 06 | 2455162.428689 | 28 | 0.15 | -92.8 | 210.3 | 4.04 | ||
| 07 | 2455162.439367 | 28 | 0.21 | -116.6 | 165.8 | 3.53 | ||
| 08 | 2455162.450048 | 29 | 0.27 | -120.7 | 174.0 | 3.62 | ||
| 09 | 2455162.460726 | 28 | 0.32 | -86.7 | 187.1 | 4.60 | ||
| 10 | 2455162.471405 | 30 | 0.38 | -81.6 | 176.4 | 4.49 | ||
| 11 | 2455162.482903 | 25 | 0.44 | -48.4 | 5.47 | |||
| 12 | 2455162.493582 | 26 | 0.49 | -0.6 | 5.55 | |||
| 13 | 2455162.514939 | 25 | 0.60 | 73.4 | -106.5 | 5.34 | ||
| 14 | 2455162.526143 | 24 | 0.66 | 93.8 | -170.6 | 4.94 | ||
| 15 | 2455162.537036 | 25 | 0.72 | 96.2 | -222.2 | 6.18 | ||
| 16 | 2455197.222839 | 18 | 0.78 | 120.7 | 5.92 | |||
| 17 | 2455197.236667 | 29 | 0.85 | 93.9 | -160.6 | 5.07 | ||
| 18 | 2455197.250817 | 27 | 0.92 | 48.6 | -123.3 | 5.34 | ||
| 19 | 2455197.264965 | 28 | 0.99 | -37.1 | 5.59 | |||
| 20 | 2455197.279111 | 27 | 0.07 | -60.1 | 5.67 | |||
| 21 | 2455197.293257 | 29 | 0.14 | -91.7 | 198.2 | 4.16 | ||
| 22 | 2455197.308131 | 29 | 0.22 | -119.1 | 212.2 | 4.44 | ||
| 23 | 2455197.322278 | 30 | 0.29 | -101.8 | 191.2 | 3.76 | ||
| 24 | 2455197.336431 | 28 | 0.37 | -75.4 | 168.5 | 3.65 | ||
| 25 | 2455198.274197 | 25 | 0.23 | -91.5 | 205.3 | 6.04 | ||
| 26 | 2455198.288351 | 25 | 0.31 | -72.2 | 199.8 | 6.29 | ||
4 Analysis of the photometric data
The qualitative analysis of the new photometric data (Fig. 4) leads to several conclusions.
- (1)
-
The Min I is deeper than Min II. This means that the secondary’s temperature is lower than the primary’s temperature.
- (2)
-
The light maxima are not equal. This O’Connell effect implies presence of surface temperature spot(s).
- (3)
-
The Max I appears at the expected phase 0.25 while the phase of Max II is around 0.78. As a result the second half of the light curves is quite distorted. Similar asymmetry is visible also on the NSVS light curve (Fig. 1) of the star almost 10 years earlier, i.e. this distortion is possibly permanent. We noted that the shape of the light curve of GSC 2314-0530 at phase range 0.5–0.8 resembles at some degree that of the cataclysmic stars with their peculiar standstills causing delay of the light increasing after the light minimum.
- (4)
-
The light curve of GSC 2314-0530 (Fig. 9) clearly reveals that the system becomes redder after the two eclipses and bluer after the two quadratures. The phases of the extrema of the light curve have around 0.05 phase delays in respect to those of the light curves except for the second maximum of which delay is more than 0.10.
- (5)

In order to determine the global parameters of GSC 2314-0530 we modeled our folded curves simultaneously using the software PHOEBE (Prśa & Zwitter, 2005) by the following procedure.
- (a)
-
We fixed the mass ratio from our radial velocity solution.
- (b)
-
The obtained components of the heliocentric space velocity km/s, km/s and km/s allow us to assume solar metalicity for the emission of GSC 2314-0530 (Leggett, 2000).
- (c)
-
We adopted coefficients of gravity brightening and reflection (appropriate for late stars) while the limb-darkening coefficients for each star and each color were taken from the tables of van Hamme (1993).
- (d)
It should be noted that the index mag of GSC 2314-0530 corresponds to mean temperature around 4400 K, i.e. 840 K higher than that obtained by the index. This is a new confirmation of the conclusion that the majority of the dMe stars have colors too blue for their colors (Stauffer & Hartmann, 1986). Our result also shows that the temperature difference obtained by the two color indices ( and ) is higher than 200–300 K (Ribas, 2003; Maceroni & Montalban, 2004) and can reach 800 K.
- (e)
-
At the first stage we fixed K (taking into account that the temperature of the primary component is higher than ) and varied the secondary’ temperature , the orbital inclination and the potentials . In order to reproduce the O’Connell effect and light curve distortions we had to add two cool spots on the primary’s surface and to vary their parameters: longitude , latitude , angular size and temperature .
Moreover, in order to get a good simultaneous fit for the three colors by the same stellar and spot parameters we added a third light which contributes differently to the different colors. We consider the last supposition as artificial step to compensate the peculiar energy distribution of the dM stars that appear especially faint in the band probably to the big TiO absorption as well as to the big contribution of the spots.
- (f)
-
After getting a good fit of our photometric data we began to vary also the primary’s temperature. As a result we obtained the best light curve solution which parameters are given in Table 5. The respective synthetic light curves are shown in Fig. 4 as gray lines. They coincide very well with the observational data at all phases except for the flares.
| Parameter | Value | ||
|---|---|---|---|
| [°] | 72.5 | ||
| [K] | 3735 | ||
| [K] | 3106 | ||
| 2.944 | |||
| 3.545 | |||
| [°] | 147 | ||
| [°] | 70 | ||
| [°] | 20 | ||
| [K] | 3175 | ||
| [°] | 195 | ||
| [°] | 75 | ||
| [°] | 8 | ||
| [K] | 3175 | ||
| (V) | 0.171 | ||
| (R) | 0.222 | ||
| (I) | 0.298 | ||
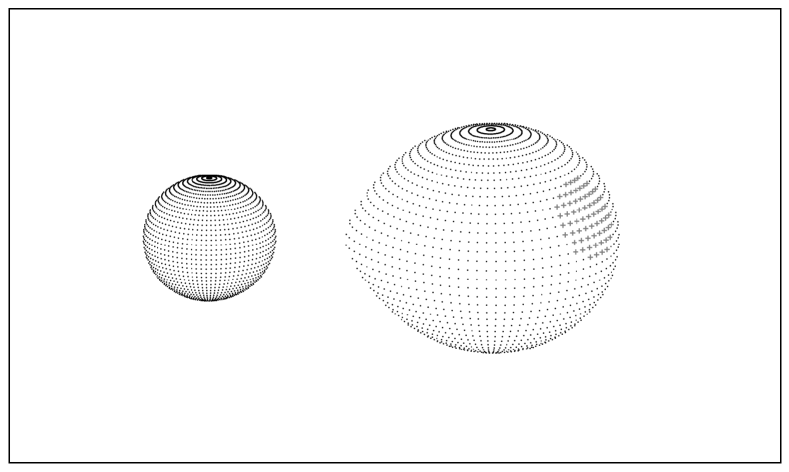
The obtained potentials correspond to relative mean stellar radii and revealing that the primary component almost fills-in its Roche lobe (Fig. 10).
5 Global parameters of GSC 2314-0530
Using the photometric value of the orbital inclination we determined consecutively the following global parameters of GSC 2314-0530:
- (a)
-
orbital velocities of the two components km s-1, km s-1;
- (b)
-
orbital separation R☉;
- (c)
-
masses of the components M☉ and M☉;
- (d)
-
absolute (mean) radii of the components R☉ and R☉;
- (e)
-
surface gravity and ;
- (f)
-
stellar luminosities L☉ and L☉;
- (g)
-
bolometric absolute magnitudes of the components (using ) mag and mag as well as bolometric absolute magnitude of the binary mag;
- (h)
-
absolute magnitude of the binary mag (using corresponding to from table 2 of VandenBerg & Clem 2003);
- (i)
-
distance to the binary pc.
It should be noted that while the masses and radii of the components were directly determined, their temperatures and absolute magnitudes required external calibrations which are poorly known for the late stars.
We calculated the equatorial velocities of the components by measuring the rotation broadening of their H lines (using ). The obtained values km s-1 and km s-1 reveal that the components of GSC 2314-0530 are quite fast rotators (see Table 7). Thus our target confirms the conclusion of Stauffer & Hartmann (1986) that the stars with larger velocities have centrally peaked H emission while the slower rotators have centrally reversed profiles as well as the conclusion of Worden et al. (1981) that stars with centrally peaked H emission profiles belong to short-period binaries.
| Name | Type | Ref. | |||||||||||
|---|---|---|---|---|---|---|---|---|---|---|---|---|---|
| [d] | [K] | [M☉] | [R☉] | [L☉] | [°] | [mag] | [mag] | [R☉] | [pc] | ||||
| CU Cnc=GJ 2069A | 2.77 | 3160 | 0.43 | 0.43 | 0.016 | 86 | 0.92 | 2.80 | 9.19 | 0.92 | 12.8 | D | (1) |
| 3125 | 0.40 | 0.39 | 0.013 | 9.45 | |||||||||
| 2MASS J01542930+0053266 | 2.64 | 3700 | 0.66 | 0.64 | 0.069 | 86 | 0.95 | 7.62 | 8.70 | 623 | D | (2) | |
| 3300 | 0.62 | 0.61 | 0.039 | 8.24 | |||||||||
| NSVS 06507557 | 0.51 | 3960 | 0.65 | 0.60 | 0.079 | 83 | 0.42 | 2.13 | 7.48 | 2.65 | 111 | D | (3) |
| 3360 | 0.28 | 0.44 | 0.022 | 8.86 | |||||||||
| NSVS 07394765 | 2.26 | 3170 | 0.56 | 0.58 | 0.030 | 84 | 1.16 | 8.52 | 2.60 | D | (4) | ||
| 3860 | 0.65 | 0.69 | 0.095 | 7.27 | |||||||||
| NSVS 07453183 | 0.37 | 3340 | 0.68 | 0.72 | 0.060 | 89 | 1.07 | 1.40 | 7.77 | 7.75 | D | (4) | |
| 3570 | 0.73 | 0.79 | 0.090 | 7.33 | |||||||||
| UNSW-TR-2 | 2.11 | 3870 | 0.53 | 0.64 | 0.082 | 83 | 0.95 | 7.43 | 7.05 | 169 | D | (5) | |
| 3845 | 0.51 | 0.61 | 0.073 | 7.56 | |||||||||
| CM Dra | 1.27 | 3150 | 0.23 | 0.25 | 0.005 | 90 | 0.93 | 10.47 | 3.75 | D | (6) | ||
| 3125 | 0.21 | 0.23 | 0.004 | 10.71 | |||||||||
| TrES HerO-07621 | 1.12 | 3500 | 0.49 | 0.45 | 0.027 | 83 | 0.95 | 8.64 | 2.25 | 118 | D | (7) | |
| 3400 | 0.49 | 0.45 | 0.024 | 8.77 | |||||||||
| YY Gem | 0.81 | 3820 | 0.60 | 0.62 | 0.070 | 86 | 1.00 | 1.92 | 7.57 | 3.87 | D | (8) | |
| 3820 | 0.60 | 0.62 | 0.070 | 7.57 | |||||||||
| GJ 3226 | 0.77 | 3313 | 0.38 | 0.37 | 0.016 | 83 | 0.75 | 2.73 | 9.20 | 3.08 | 42 | D | (9) |
| 3247 | 0.28 | 0.32 | 0.009 | 9.83 | |||||||||
| 2MASS 04463285+1901432 | 0.62 | 3320 | 0.47 | 0.56 | 0.034 | 81 | 0.41 | 2.59 | 8.39 | 2.66 | 540 | D | (10) |
| 2910 | 0.19 | 0.21 | 0.003 | 11.03 | |||||||||
| V405 And | 0.496 | 4050 | 0.49 | 0.78 | 0.147 | 66 | 0.98 | 6.80 | 2.25 | D | (11) | ||
| 3000 | 0.21 | 0.23 | 0.004 | 10.71 | |||||||||
| GU Boo | 0.49 | 3920 | 0.61 | 0.62 | 0.082 | 88 | 0.98 | 1.90 | 7.43 | 2.79 | 100 | D | (12) |
| 3810 | 0.60 | 0.62 | 0.073 | 7.60 | |||||||||
| SDSS MEB-1 | 0.41 | 3320 | 0.27 | 0.27 | 0.008 | 85 | 0.98 | 9.96 | 1.85 | D | (13) | ||
| 3300 | 0.24 | 0.25 | 0.007 | 10.11 | |||||||||
| NSVS 01031772 | 0.37 | 3615 | 0.54 | 0.53 | 0.043 | 86 | 0.92 | 8.08 | 2.20 | 40 | D | (14) | |
| 3513 | 0.50 | 0.51 | 0.036 | 8.27 | |||||||||
| OGLE BW3 V38 | 0.198 | 3500 | 0.44 | 0.51 | 0.035 | 86 | 0.95 | 2.45 | 8.39 | 1.35 | 400 | SD | (15) |
| 3450 | 0.41 | 0.44 | 0.025 | 8.78 | |||||||||
| GSC 2314-0530 | 0.192 | 3735 | 0.51 | 0.55 | 0.053 | 72 | 0.52 | 2.34 | 7.91 | 1.28 | 59 | SD | (16) |
| 3106 | 0.26 | 0.29 | 0.007 | 10.11 |
References: (1) Ribas 2003, Delfosse et al. 1999; (2) Becker et al. 2008; (3) Cakirli Ibanoglu 2009; (4) Coughlin Shaw 2007; (5) Young et al. 2006; (6) Metcalfe et al. 1996; (7) Creevey et al. 2005; (8) Bopp 1974, Torres Ribas 2002; (9) Irwin et al. 2009; (10) Hebb et al. 2006; (11) Vida et al. 2008; (12) Lopez-Morales Ribas 2005; (13) Blake et al. 2008; (14) Lopez-Morales et al. (2006); (15) Maceroni Montalban (2004); (16) this paper
Some of the determined global parameters of GSC 2314-0530 together with those of the other known binaries with low-mass dM components are given in Table 6 which columns are: star name; period in days; temperatures of the components; masses , radii and luminosities of the components in solar units; orbital inclination in degrees; mass ratio ; color index of the binary; bolometric absolute magnitudes of the components; orbital separation in solar radii; distance in pc; type of binary configuration (D – detached, SD – semidetached); references.
Figure 11 shows the empirical diagrams mass-, mass-radius and mass-temperature for the low-mass stars from Table 6 (total number 34). They occupy relative narrow bands on these diagrams. This means that the luminosities, radii and temperatures of these stars depend on their masses. These statistical relations can be described by the following formulas:

| (3) | |||||
We assume that the bigger scatter of the mass-temperature diagram is due mainly to the weakly established calibration / for the late low-mass stars. Moreover, some star temperatures probably have been determined without taking into account the reddening.
6 Activity of GSC 2314-0530
The manifestations of stellar activity as H emission, spots, flares, etc., are consequences of magnetic fields. It is assumed that the fully-convective late stars have strong, long-lasting, magnetic field.
According to Mullan & MacDonald (2001) the larger radii and lower temperatures of dM stars can be explained by the presence of strong magnetic fields and their activity is at the saturation limit. Perhaps the significant spot coverage decreases the photospheric temperature which the star compensates by increasing its radius to conserve the total radiative flux.
6.1 Surface spots
The photospheric activity of the late stars is demonstrated mainly by O’Connell effect and distorted light curves. They can be reproduced by surface temperature inhomogeneities (spots). It is reasonable to assume existence of cool spots by analogy with our Sun. Usually they are put on the primary star although the same effect can be reached by spots on the secondary but then the spots should be larger and/or cooler. There are also fits of the light curves of late binaries with bright spots (Torres & Ribas, 2002; Maceroni et al., 1994). These are interpreted by uniform distribution of dark spots covering however most of stellar surface except for a spot-free area, i.e. ”bright spots” represent the true photosphere.
The light curves of all binaries with low-mass dM components from Table 6 are distorted and they have been reproduced by large cool spots which angular radii reach up to 80.
The distorted light curves of GSC 2314-0530 were reproduced by two cool spots on the primary component (see their parameters in Table 5) covering 3.5 per cent of its surface. The fact that the shape of the light curve distortions of GSC 2314-0530 remains the same almost 10 years means that the main (larger) spot visible at phase 0.6 presents long-lived active region on the primary surface.
6.2 H emission
The of the H line is an useful indicator of chromospheric activity for M dwarfs because those stars are much brighter at 6500 than at 3900 . Stauffer & Hartmann (1986) divided dM into 4 subsets ordered by chromospheric activity. The least chromospheric active dM have weak H absorption line. As the chromosphere increases the of the H absorption first increases, then decreases and finally H goes into the emission.
Table 4 presents the orbital variations of the of the total H emission of GSC 2314-0530. Although it seemed to change irregularly in the range 3.6-6.6 during the cycle we noted a trend of the to be smaller around the first quadrature than around the second quadrature. The exceptions from this trend are the big values of the only two spectra from 2010 January 01 at phases 0.23 and 0.31. They may due to flare event. Such a supposition is reasonable because two of the observed flares are around the first quadrature (see Table 8).
The foregoing trend of the H emission is opposite to that of total light of GSC 2314-0530 that is bigger at the first quadrature than at the second one. Such an anti-correlation is typical for the chromospherically active stars of types RS CVn and BY Dra.
| Star | Flares | |||
|---|---|---|---|---|
| [km s-1] | [km s-1] | [] | ||
| CM Dra | em | Y | ||
| CU Cnc | 4 | |||
| V405 And | Y | |||
| GU Boo | 64 | 64 | 1.7 | |
| YY Gem | 37 | 37 | 2 | Y |
| NSVS 06507557 | 59 | 43 | [-3,+2] | |
| NSVS 01031772 | 72 | 70 | ||
| BW3 V38 | 131 | 113 | 5.4 | |
| GJ3236 | 25 | 19 | ||
| GSC 2314-0530 | 145 | 69 | 6.6 | Y |
Table 7 presents the of the H emission of some binaries with low-mass dM components from Table 6 at normal state (out of flare). The comparison reveals the strong H emission of GSC 2314-0530. This result is not surprising taking into account the low temperature and fast rotation of its components.
The mean value of the H emission of GSC 2314-0530 is considerably smaller than that of the accreting pre-main-sequence dMe stars which H emission has .
6.3 Flares
Flare activity is typical for the late stars. The last column of Table 7 shows those stars from our Table 6 in which some flares have been registered (signed by “Y”).
During our observational runs we were witnesses of six flares of GSC 2314-0530 that revealed its high flare activity. The amplitudes and durations of the observed flares are given in Table 8.
It should be noted that 3 of the observed 6 flares occurred around the phase of maximum visibility 0.6 of the large, stable spot (Sp1). This implies correlation between the two signs of stellar activity: spots and flares. Both of them are appearances of the long-lived active area on the primary star.
Besides the optical flares there is information about X-flares of GSC 2314-0530 (Fuhrmeister & Schmitt, 2003).
| Date | HJDmax | Phase | Filter | ||
|---|---|---|---|---|---|
| [mag] | [min] | ||||
| 2009 Oct. 26 | 126.49373 | 0.61 | 0.022 | 4 | |
| 2009 Nov. 13 | 149.23146 | 0.64 | 0.085 | 22 | |
| 2009 Nov. 13 | 149.26995 | 0.84 | 0.027 | 13 | |
| 2009 Nov. 13 | 149.41788 | 0.61 | 0.085 | 19 | |
| 2009 Nov. 13 | 149.55281 | 0.31 | 0.015 | 9 | |
| 2009 Nov. 20 | 156.48180 | 0.31 | 0.092 | 25 |
6.4 Angular momentum
The small orbital angular momentum is characteristic feature of all short-period systems ranging from CVs to CB that seem to be old, being at later stages of the angular momentum loss evolution as a result of the period decrease.
We calculated the orbital angular momentum of the target by the expression (Popper & Ulrich, 1977)
| (4) |
where is in days and are in solar units.
The obtained value of GSC 2314-0530 is considerably smaller than those of the RS CVn binaries and detached systems which have . The orbital angular momentum of GSC 2314-0530 is smaller even than those of the contact systems which have . It is bigger only than those of the short-period CVs of SU UMa type.
The small orbital angular momentum of GSC 2314-0530 implies existence of past episode of angular momentum loss during the binary evolution. It means also that GSC 2314-0530 is not pre-MS object. This conclusion is supported by the values of of its components.
6.5 X-ray emission
The X-ray emission of the stellar coronae are directly related to the presence of magnetic fields and consequently gives information about the efficiency of the stellar dynamo.
Rucinski (1984) established that the X-ray luminosity decreased for later M stars while the ratio did not change significantly from M0 to M6. As a result he proposed the ratio as most relevant measure of activity of M dwarfs. Vilhu & Walter (1987) found that the upper boundary of for late M stars is .
Besides all indicators of stellar activity in the optical (surface inhomogeneities, emission lines, flares) the star GSC 2314-0530 shows also X-ray emission (it is identified as ROSAT X-ray source 1RXS J022050.7+332049) and X-ray flares.
On the basis of the measured X-ray flux ergs cm-2 of GSC 2314-0530 at quiescence (Voges et al., 1999; Schmitt et al., 1995) and derived distance 59 pc we calculated its X-ray luminosity ergs s-1. This value is at the upper boundary 29 for dM stars (Rosner et al., 1981; Caillault et al., 1986). The value of GSC 2314-0530 is almost at the upper boundary of this ratio and considerably bigger than those of the M dwarfs studied by Rucinski (1984) and Caillault et al. (1986).
It is known that the activity and angular momentum loss tend to be saturated at high-rotation rates (Vilhu & Walter, 1987). Due to its short period and high activity GSC 2314-0530 is perhaps an example of such saturation.
7 Is GSC 2314-0530 alone?
Our observed field (Fig. 2) contains the weak star USNO-B1 1233-0046425. We called it Twin due to the same tangential shift as our target star GSC 2314-0530. Table 2 presents the proper motion and the colors of Twin according to the catalogue NOMAD. USNO-B1 1233-0046425 has corresponding to temperature less than 3200 K.
We suspect that our ”twins” may form visual binary. The angular distance between them of 61 arcsec corresponds to linear separation around 3500 au for distance of 59 pc. Such a supposition is reasonable because it is known that the short-period close binaries often are triple systems (Pribulla & Rucinski, 2006). Particularly, the object TrES Her0-07621 from our Table 6 has a red stellar neighbor at a distance 8 arcsec with close proper motion (Creevey, 2005).
The check of the supposition if Twin is physical companion of GSC 2314-0530 needs astrometric observations of the ”twins”.
8 Conclusions
The analysis of our photometric and spectral observations of the newly discovered eclipsing binary GSC 2314-0530 allows us to derive the following conclusions:
(1) This star is the shortest-period binary with dM components which period is below the short-period limit.
(2) By simultaneous radial velocity solution and light curve solution we determined the global parameters of GSC 2314-0530: inclination ; orbital separation R☉; masses M☉ and M☉; radii R☉ and R☉; temperatures K and K; luminosities L☉ and L☉; distance pc.
(3) We derived empirical relations mass–, mass–radius and mass–temperature on the basis of the parameters of known binaries with low-mass dM components.
(4) The distorted light curve of GSC 2314-0530 were reproduced by two cool spots on the primary component. The next sign of the activity of GSC 2314-0530 is the strong H emission of its components. Moreover we registered 6 flares of GSC 2314-0530. Half of them occurred at the phases of maximum visibility of the larger stable cool spot on the primary.
The analysis of all appearances of magnetic activity revealed existence of long-lived active area on the primary of GSC 2314-0530. The high activity of the target is natural consequence of the fast rotation and low temperatures of its components.
Our study of the newly discovered short-period eclipsing binary GSC 2314-0530 presents a next small step toward understanding dMe stars and adds a new information to the poor statistic of the low-mass dM stars. Recently they became especially interesting as appropriate targets for planet searches due to the relative larger transit depths.
Acknowledgments
The research was supported partly by funds of projects DO 02-362 of the Bulgarian Scientific Foundation. This research make use of the SIMBAD and Vizier databases, operated at CDS, Strasbourg, France, and NASA’s Astrophysics Data System Abstract Service. The authors are very grateful to the anonymous referee for the valuable notes and advices.
References
- Becker et al. (2008) Becker A. et al., 2008, MNRAS, 386, 416
- Blake et al. (2008) Blake C. et al., 2008, AJ, 684, 635
- Bopp (1974) Bopp B.W., 1974, ApJ, 193, 389
- Caillault et al. (1986) Caillault J. et al., 1986, ApJ, 304, 318
- Cakirly & Ibanoglu (2009) Cakirly O., Ibanoglu C., 2010, MNRAS, 401, 1141
- Coughlin & Shaw (2007) Coughlin J., Shaw J., 2007, J. of Southeastern Assoc. for Res. in Astr., 1, 7
- Creevey (2005) Creevey O., Benedict G., Brown T. et al., 2005, ApJL, 625, 127
- Delfosse et al. (1999) Delfosse X. et al., 1999, A&A, 341, L63
- Dimitrov (2009) Dimitrov D.P., 2009, BulgAJ, 12, 49
- Everett & Howell (2001) Everett M., Howell S., 2001, PASP, 113, 1428
- Fuhrmeister & Schmitt (2003) Fuhrmeister B., Schmitt J., 2003, A&A, 403, 247
- Hebb et al. (2006) Hebb L. et al., 2006, AJ, 131, 555
- Irwin et al. (2009) Irwin J. et al., 2009, ApJ, 701, 1436
- Landolt (1992) Landolt A., 1992, AJ, 104, 340
- Leggett (2000) Leggett S., 2000, ApJS, 82, 351
- Lenz & Breger (2005) Lenz P., Breger M., 2005, CoAst, 146, 53
- Leung & Schneider (1978) Leung K., Schneider D., 1978, AJ, 83,618
- Lopez-Morales & Ribas (2005) Lopez-Morales M., Ribas I., 2005, ApJ, 131, 555
- Lopez-Morales et al. (2006) Lopez-Morales M. et al., 2006, ArXiv:astro-ph/0610225v1
- Maceroni & Montalban (2004) Maceroni C., Montalban J., 2004, A&A, 426, 577
- Maceroni & Rucinski (1997) Maceroni C., Rucinski S.M., 1997, PASP, 109, 782
- Maceroni et al. (1994) Maceroni C. et al., 1994, A&A, 288, 529
- Metcalfe et al. (1996) Metcalfe T. et al., 1996, ApJ, 456, 356
- Mullan & MacDonald (2001) Mullan D., MacDonald J., 2001, ApJ, 559, 353
- Norton et al. (2007) Norton A.J., et al., 2007, A&A, 467, 785
- Pollacco et al. (2006) Pollacco D., et al. 2006, PASP, 118, 1407
- Popper & Ulrich (1977) Popper D., Ulrich R., 1977, ApJ, 212, L131
- Pribulla & Rucinski (2006) Pribulla T., Rucinski S., 2006, AJ 131, 2986
- Pribulla et al. (2009) Pribulla T., Vanko M., Hambalek L., 2009, IBVS, No.5886
- Prśa & Zwitter (2005) Prśa A., Zwitter T., 2005, ApJ, 628, 426
- Ribas (2003) Ribas I., 2003, A&A, 398, 239
- Rosner et al. (1981) Rosner R. et al., 1981, ApJ, 249, L5
- Rucinski (1992) Rucinski S.M., 1992, AJ, 103, 960
- Rucinski (1984) Rucinski S.M., 1984, A&A, 132, L9
- Rucinski (2007) Rucinski S.M., 2007, MNRAS, 382, 393
- Rucinski & Pribulla (2008) Rucinski S.M., Pribulla T., 2008, MNRAS, 388, 1831
- Schlegel et al. (1998) Schlegel D., Finkbeiner D., Davis M., 1998, ApJ, 500, 525
- Schmitt et al. (1995) Schmitt J., Fleming T., Giampapa M., 1995, ApJ, 450, 392
- Stauffer & Hartmann (1986) Stauffer J.R., Hartmann L.W., 1986, ApJS, 61, 531
- Stepien (2006) Stepien K., 2006, Acta Astr., 56, 347
- Stetson (2000) Stetson P., 2000, PASP, 112, 925
- Torres & Ribas (2002) Torres G., Ribas I., 2002, ApJ, 567, 1140
- VandenBerg & Clem (2003) VandenBerg D., Clem J, 2003, AJ, 126, 778
- van Hamme (1993) van Hamme W., 1993, AJ, 106, 2096
- Vida et al. (2008) Vida K., Olah K., Kovari Zs., Bartus J., 2009, AIPS, 1094, 812
- Vilhu & Walter (1987) Vilhu O., Walter F., 1987, ApJ 321, 958
- Voges et al. (1999) Voges W., Aschenbach B., Boller T., et al., 1999, A&A 349, 389
- Weldrake et al. (2004) Weldrake D.T.F., Sackett P.D., Bridges T.J., Freeman K.C., 2004, AJ, 128, 736
- Worden et al. (1981) Worden S.P., Schneeberg T.J., Giampapa M.S., 1981, ApJS, 46, 159
- Wozniak et al. (2004) Wozniak P.R., Vestrand C.W., Akerlof R., et al., 2004, AJ, 127, 2436
- Young et al. (2006) Young T. et al., 2006, MNRAS, 370, 1529
- Zacharias et al. (2005) Zacharias N., Monet D., Levine S., et al., 2005, AAS, 205, 4815