A scanning microcavity for in-situ control of single-molecule emission
Abstract
We report on the fabrication and characterization of a scannable
Fabry-Perot microcavity, consisting of a curved micromirror at the
end of an optical fiber and a planar distributed Bragg reflector.
Furthermore, we demonstrate the coupling of single organic molecules
embedded in a thin film to well-defined resonator modes. We discuss
the choice of cavity parameters that will allow sufficiently high
Purcell factors for enhancing the zero-phonon transition between the
vibrational ground levels of the electronic excited and ground
states.
Single optical emitters such as atoms, ions, quantum dots, and color centers have been heavily pursued for their potential in engineering and control of the quantum state of matter. Among these, solid-state emitters are particularly interesting because they are robust and compatible with dense circuits. However, fabrication of high-quality samples faces issues such as material processing when they are to be integrated into more sophisticated structures. Recent efforts Kiraz et al. (2005); Gerhardt et al. (2009); Hwang et al. (2009) have shown that organic dye molecules might offer a superior alternative if one could suppress the incoherent decay of the excited state. In this work, we present a versatile microcavity architecture that can enhance the Fourier-limited transition between the v=0 vibrational levels of the electronic excited and ground states (labeled in Fig. 1(a)), thus reducing the influence of the broad Stokes-shifted transitions (labeled ).
Over the past three decades, microresonators have been increasingly employed for tailoring the interaction of light and matter Vahala (2004). In the case of emitters embedded in solid-state microcavities one has been usually confronted by two main problems. First, it is not possible to combine arbitrary choices of emitters and cavity material. Second, it is not easy to optimize the strength of the coupling between the emitter and the cavity mode because of the challenge in placing the former in the mode maximum with subwavelength accuracy Guthohrlein et al. (2001); Hennessy et al. (2007); Muller et al. (2009). One way to address these issues is to exploit evanescent coupling of an emitter that has been placed at the extremity of a nano-probe Götzinger et al. (2006); Koenderink et al. (2005). Here we explore another flexible approach, where the emitters are embedded in a thin film on a flat distributed Bragg reflector (DBR). By approaching a microscopic mirror at the end of an optical fiber Trupke et al. (2005); Colombe et al. (2007), we form a resonant microcavity that can be laterally scanned to couple to individual emitters in a controlled fashion Muller et al. (2009). This scheme is particularly attractive for work with organic dye molecules, which have been so far only studied in the near field of surfaces Steiner et al. (2005); Buchler et al. (2005) or in parallel-plate cavities De Martini et al. (1987); Steiner et al. (2005); Chizhik et al. (2009).
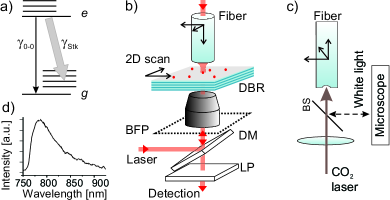
The schematics of the microcavity assembly is depicted in Fig. 1(b). One cavity mirror consists of a planar DBR with alternating and bilayers of optical thickness. The lowest refractive index material has been configured at the top interface to place the field antinode at the emitter position. In our current experiments, the photonic bandgap has been centered either on the emitter fluorescence or on the excitation wavelength.
The curved microscopic mirror is formed at the end of a single-mode optical fiber by laser machining, as shown in Fig. 1(c). By focussing a laser beam onto the cleaved fiber and regulating its intensity in short pulses, we induce local evaporation of silica and produce concave surfaces with variable radii of curvature down to several tens of microns Colombe et al. (2007). We investigated the laser processed surfaces with atomic force microscopy (AFM) and found a rms roughness below , limited by our instrument resolution. We typically obtained a depression of over a diameter of when the fiber was treated by ms bursts of pulses at a repetition rate of , corresponding to an average laser output power of about . Longer pulses yield higher radii of curvature and deeper concavities. Fiber tips were then coated with of gold. While this metallic coating reduces the finesse, it offers a broadband response that was desirable in our current studies. Extension to highly reflective dielectric coatings has been already reported Colombe et al. (2007); Muller et al. (2009).
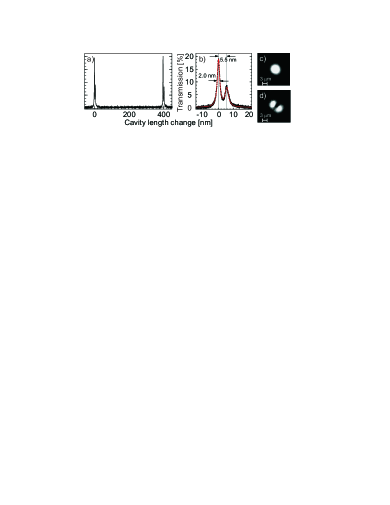
To characterize the resulting microcavity, we coupled light from a single-mode diode laser at to the cavity through its optical fiber port. Light was then collected through a 60X microscope objective and directed to a photodiode or a CCD camera. Stable cavity modes could be found for several values of the cavity length . Figure 2(a) displays the cavity transmission over more than one free spectral range (FSR) as was scanned. These data yield typical cavity finesse of according to , where denotes the resonance frequency, stands for the cavity linewidth, and signifies the corresponding length change. In a separate measurement we determined the reflectivity of the DBR (13 multilayers) to be at normal incidence. By using this information, we deduced the reflectivity of the gold micromirror to be from the expression . We also note that the measured cavity transmittance of is in agreement with the predictions of simple plane-wave calculations, confirming a good fiber-cavity mode matching.
The FSR of our short cavity amounts to about 100 nm, which is more than the band gap of the DBR. Thus, to determine , we varied the cavity length under illumination at three different wavelengths of and . In this way, we obtained an accurate calibration of the piezo displacement and determined , corresponding to an effective longitudinal cavity order of . Accounting for the group delay within the DBR of about , we estimate the physical separation of the cavity mirrors to be .
Figure 2(b) shows the zoom of one longitudinal mode, revealing two transversal resonances. Figures 2(c) and (d) present CCD camera images of the cavity transmission at these resonances, which we attribute to Hermite modes () with indices and , respectively. The difference between two cavity lengths () can be used to determine the radius of curvature () according to the relation Yariv (1989). Assuming , one obtains for this realization.
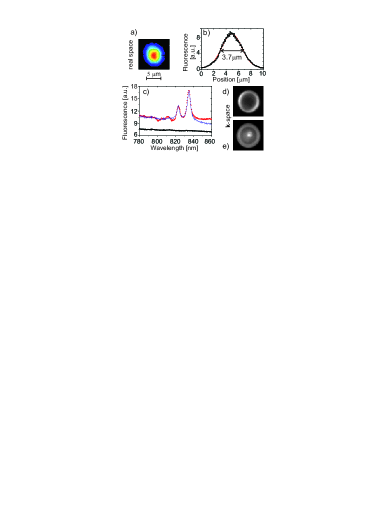
A Gaussian fit to the measurement in Fig. 2(c) yields a full width at half-maximum (FWHM) of at the planar mirror surface. To map the cavity mode directly, we scanned a 100 nm-diameter fluorescent polymer bead laterally and recorded its emission through the lower mirror. Here, we chose a DBR made of and bi-layers that yielded a band gap in the range 524-684 nm. The light from a diode laser at was coupled to the cavity resonantly via the fiber and was used to excite the bead. At the same time, the fluorescence of the bead (peaked at ) could traverse the DBR and be collected with an oil immersion objective (100X, N.A.=1.4). To ensure that the cavity stayed tuned to its resonance, we stabilized via a side-of-fringe locking scheme. Figure 3(a) presents an example of a two-dimensional image as the sample was moved over a range of at a step size of . Since we kept the excitation intensity well below saturation, this signal is proportional to the cavity field intensity. We find a mode with (see Fig. 3(b)), consistent with our CCD estimation. The knowledge of the FWHM of the mode at the DBR allows us to determine its 1/e half-width for the field amplitude () and thus compute the mode volume according to , taking into account the standing-wave nature of the mode.
Having characterized the microcavity, we now examine its coupling to a single Dibenzoterrylene (DBT) molecule. The ideal sample for our microcavity concept is a thin dielectric film that contains organic dye molecules with transition dipoles in the mirror plane. Recently, we demonstrated that anthracene films (thickness 20-50 nm) doped with DBT satisfy this requirement and provide a well-defined and photostable system for single-molecule studies Toninelli et al. (2010). We, thus, spin coated such a sample directly on a DBR made of 4 bilayers of and with band gap in the range 685-880 nm. The excitation light at experienced only a weak cavity effect so that it could be focussed through the DBR onto the molecule. The red trace in Fig. 3(c) plots a zoom into the fluorescence spectrum of a single molecule recorded through the cavity. Comparison with the emission spectrum of an unperturbed DBT molecule in Fig. 1(d) reveals a clear modification due to the coupling to two cavity transversal modes. To explore this effect further, we also recorded the angular distribution of the single molecule emission by imaging the back focal plane of the microscope objective Toninelli et al. (2010); Lieb et al. (2004) onto a sensitive CCD camera (see Fig. 1(b)). Figure 3(d) displays the resulting pattern when the micromirror was absent. The bright ring shows that in this case only the emission at large angles, which falls outside the DBR band gap, can be transmitted. The black symbols in Fig. 3(c) present part of the fluorescence spectrum emitted at these angles. Figure 3(e) shows that if fulfills a resonant condition, the molecular fluorescence can build up in the cavity and exit along its axis, resulting in a central peak in the Fourier plane.
The data presented in Figs. 3(c)-(e) clearly show that the molecular emission has been coupled to well-defined modes of the microcavity. However, contrary to what has been recently alluded in a related experiment Chizhik et al. (2009), such observations cannot be attributed to a modification of the emission spectrum arising from a Purcell effect. Instead, they are simply caused by a filtering process, whereby the part of the molecular emission that is not resonant with the cavity does not exit. To confirm this, we multiplied the emission spectrum of DBT (see Fig. 1(d)) by the transmission function of a cavity with . To account for a small contribution from the light exiting the DBR at large angles (see the ring in Figs. 3(d)), we added a background according to the experimental spectrum recorded through a DBR alone. As the blue trace in Fig. 3(c) shows, this simple procedure yields a very good agreement with the measured data of the red trace without the need for invoking an intrinsic modification of the molecular fluorescence.
Parameters , , and yield a maximal Purcell factor of about 1.5 for a narrow-band emitter in a closed cavity according to the expression H.Yokoyama and Ujihara (1995), where is the quality factor. Taking into account a solid angle of subtended by the cavity mode and its spectral overlap of with the broad molecular emission, the modification factor drops to about . Given such a small change in the radiative rate of the 0-0 transition, we cannot expect a considerable effect on the redistribution of the emission among various vibrational levels (see Figs. 1(a,d)). To enter this interesting regime, we plan to coat the micromirror by a multilayer dielectric, which has been reported to yield a cavity finesse of about Colombe et al. (2007). Combined with a modest radius of curvature of , such mirrors would allow Purcell factors up to . Accounting for the reduction of this effect due to the finite modal solid angle, such a cavity would enhance the 0-0 spontaneous emission by about 20 times and improve the fraction of the emission in this channel from 30% Trebbia et al. (2009) to about if one operates at liquid helium temperatures, where 0-0 linewidths under 1 GHz are common Kiraz et al. (2005); Gerhardt et al. (2009); Hwang et al. (2009). Further reduction of the radius of curvature of the fiber mirror would lower the mode volume and allow branching ratios as large as 98%. Such large effects will also be accompanied by an improvement of the collection efficiency through the resonator.
We thank R. Stutz for sputter deposition of DBRs. This work was financed by ETH Zurich (QSIT, Grant Nr. PP-01 07-02) and the Swiss National Foundation.
References
- Kiraz et al. (2005) A. Kiraz, M. Ehrl, T. Hellerer, E. Müstecaplioglu, C. Bräuchle, and A. Zumbusch, Phys. Rev. Lett., 94, 223602 (2005).
- Gerhardt et al. (2009) I. Gerhardt, G. Wrigge, G. Zumofen, J. Hwang, A. Renn, and V. Sandoghdar, Phys. Rev. A., 79, 011402(R) (2009).
- Hwang et al. (2009) J. Hwang, M. Pototschnig, R. Lettow, G. Zumofen, A. Renn, S. Götzinger, and V. Sandoghdar, Nature, 460, 76 (2009).
- Vahala (2004) K. Vahala, ed., Optical Microcavities (World Scientific (Advanced Series in Applied Physics), 2004).
- Guthohrlein et al. (2001) G. R. Guthohrlein, M. Keller, K. Hayasaka, W. Lange, and H. Walther, Nature, 414, 49 (2001).
- Hennessy et al. (2007) K. Hennessy, A. Badolato, M. Winger, D. Gerace, M. Atature, S. Gulde, S. Falt, E. L. Hu, and A. Imamoglu, Nature, 445, 896 (2007).
- Muller et al. (2009) A. Muller, E. B. Flagg, M. Metcalfe, J. Lawall, and G. S. Solomon, Applied Physics Letters, 95, 173101 (2009).
- Götzinger et al. (2006) S. Götzinger, L. de S. Menezes, A. Mazzei, S. Kühn, V. Sandoghdar, and O. Benson, Nano Lett., 6, 1151 (2006).
- Koenderink et al. (2005) A. F. Koenderink, M. Kafesaki, C. M. Soukoulis, and V. Sandoghdar, Opt. Lett., 30, 3210 (2005).
- Trupke et al. (2005) M. Trupke, E. A. Hinds, S. Eriksson, E. A. Curtis, Z. Moktadir, E. Kukharenka, and M. Kraft, Applied Physics Letters, 87, 211106 (2005).
- Colombe et al. (2007) Y. Colombe, T. Steinmetz, G. Dubois, F. Linke, D. Hunger, and J. Reichel, Nature, 450, 272 (2007).
- Steiner et al. (2005) M. Steiner, F. Schleifenbaum, C. Stupperich, A. V. Failla, A. Hartschuh, and A. J. Meixner, ChemPhysChem, 6, 2190 (2005).
- Buchler et al. (2005) B. C. Buchler, T. Kalkbrenner, C. Hettich, and V. Sandoghdar, Phys. Rev. Lett., 95, 063003 (2005).
- De Martini et al. (1987) F. De Martini, G. Innocenti, G. R. Jacobovitz, and P. Mataloni, Phys. Rev. Lett., 59, 2955 (1987).
- Chizhik et al. (2009) A. Chizhik, F. Schleifenbaum, R. Gutbrod, A. Chizhik, D. Khoptyar, A. J. Meixner, and J. Enderlein, Phys. Rev. Lett., 102, 073002 (2009).
- Yariv (1989) A. Yariv, Quantum Electronics (3rd edition, John Wiley and Sons, 1989).
- Toninelli et al. (2010) C. Toninelli, K. Early, J. Bremi, A. Renn, S. Götzinger, and V. Sandoghdar, Opt. Express, 18, 6577 (2010).
- Lieb et al. (2004) M. A. Lieb, J. M. Zavislan, and L. Novotny, Journal of the Optical Society of America B-optical Physics, 21, 1210 (2004).
- H.Yokoyama and Ujihara (1995) H.Yokoyama and K. Ujihara, eds., Spontaneous Emission and Laser Oscillation in Microcavities (CRC Press, 1995).
- Trebbia et al. (2009) J.-B. Trebbia, H. Ruf, P. Tamarat, and B. Lounis, Opt. Express, 17, 23986 (2009).