A deep Chandra observation of the poor cluster AWM 4 – I. Properties of the central radio galaxy and its effects on the intracluster medium
Abstract
Using observations from the Chandra X–ray Observatory and Giant Metrewave Radio Telescope, we examine the interaction between the intracluster medium and central radio source in the poor cluster AWM 4. In the Chandra observation a small cool core or galactic corona is resolved coincident with the radio core. This corona is capable of fuelling the active nucleus, but must be inefficiently heated by jet interactions or conduction, possibly precluding a feedback relationship between the radio source and cluster. A lack of clearly detected X–ray cavities suggests that the radio lobes are only partially filled by relativistic plasma. We estimate a filling factor of =0.21 (3 upper limit ) for the better constrained east lobe. We consider the particle population in the jets and lobes, and find that the standard equipartition assumptions predict pressures and ages which agree poorly with X–ray estimates. Including an electron population extending to low Lorentz factors either reduces () or removes () the pressure imbalance between the lobes and their environment. Pressure balance can also be achieved by entrainment of thermal gas, probably in the first few kiloparsecs of the radio jets. We estimate the mechanical power output of the radio galaxy, and find it to be marginally capable of balancing radiative cooling.
keywords:
galaxies: clusters: general — galaxies: clusters: individual (AWM 4) — intergalactic medium — galaxies: active — cooling flows — X–rays: galaxies: clusters1 Introduction
X–ray observations of clusters and groups of galaxies over the last decade have led to a significant revision of our models of the intergalactic medium in these systems. The Chandra and XMM-Newton observatories have provided strong evidence that despite cooling times being significantly shorter than the Hubble time (e.g., Sanderson et al., 2006), relatively little gas actually cools below 1 keV (Peterson et al., 2003; Kaastra et al., 2004). It is now widely accepted that excessive cooling is in many systems prevented by a feedback mechanism in which the AGN of the central dominant galaxy, fuelled by cooling intra–cluster gas, can reheat the gas through a variety of mechanisms (e.g., Peterson & Fabian, 2006; McNamara & Nulsen, 2007, and references therein).
X–ray and radio images provide numerous examples of interactions between AGN and the surrounding intra–cluster medium (ICM). Deep multiwavelength observations of the brightest nearby clusters have revealed complex structures associated with the radio jets and lobes, including shocks, sound waves, individual and linked chains of cavities, uplifted material and cooling filaments (e.g., Fabian et al., 2005, 2006; Forman et al., 2007; Wise et al., 2007; Blanton et al., 2009). Much of this work has concentrated on the cavities in the ICM which radio lobes produce as they inflate. The enthalpy of the cavities can be used as a measure of the mechanical power output of the radio jets, and has been shown to be sufficient to prevent or greatly reduce cooling in many systems (Bîrzan et al., 2004), provided the energy can be transfered into the intracluster medium and distributed relatively isotropically.
The disturbed structures produced by AGN jet/ICM interactions are relatively short–lived, and increasingly difficult to detect as they age. The radio lobes which inflate cavities fade rapidly once the AGN outburst ceases, and the X–ray cavities, which are detected by contrast with their surroundings, become less visible once they move beyond the dense group or cluster core. It is therefore considerably more difficult to study older AGN outbursts. However, since the mechanism by which cavities heat their surroundings is still a matter of debate, it is desirable to observe systems with as wide a range of ages as possible, so as to understand clearly the interaction between the radio lobes and their environment.
Most observations of radio galaxies to date have been based on observations at frequencies 1 GHz. Radio lobes may be studied over a wider range of timescales by observations at lower radio frequencies, which probe lower energy electrons less affected by spectral aging. Deep X–ray imaging is needed to complement such observations, and in this paper we discuss one example where this combination is available, the poor cluster AWM 4.
A previous XMM-Newton observation found AWM 4 to be approximately isothermal to a radius of 150 kpc, with no evidence of a central cool core (O’Sullivan et al., 2005, hereafter referred to as OS05). Comparison with MKW 4, a cluster of similar temperature and galaxy population, but which hosts a large cool core and lacks a central radio source (O’Sullivan et al., 2003), leads to the suggestion that AWM 4 had been strongly heated by its central radio galaxy, 4C+24.36. However, examination of the XMM-Newton data showed no evidence of cavities or shocks, and no high resolution images showing the lobes were available in the literature or radio archives. The existing VLA 1.4 GHz data were interpreted as evidence against the presence of lobes of sufficient volume to be responsible for reheating a large cool core (Gastaldello et al., 2008). The ICM and galaxy distribution both appear relaxed with no significant substructure, with a strong concentration of early–type galaxies toward the core (Koranyi & Geller, 2002). A cluster merger, which could also have heated the ICM, therefore appears unlikely. The central elliptical, NGC 6051, shows no signs of recent interactions (Schombert, 1987) and is considerably more luminous than its neighbours, with a difference in magnitude above the second–ranked galaxy of =1.6 (SDSS -band).
An analysis of deep GMRT radio observations at 235, 327 and 610 MHz was presented in (Giacintucci et al., 2008, hereafter referred to as GVM08). These data provided much new information about 4C+24.36, revealing radio emission from the jets and lobes extending 75 kpc from the AGN. The source was shown to be a wide–angle–tail radio galaxy with inner jets oriented close to the plane of the sky, probably moving southward with a velocity of 120. From modelling of the progressive steepening of the spectral index (defined as where is flux and frequency) along the jets the radiative age of the electron population was estimated as 160-170 Myr.
In this paper, we use a new Chandra ACIS-S observation of AWM 4, in combination with the GMRT and archival VLA observations, to study the structure of the ICM and the interaction of the AGN, radio jets and lobes with the surrounding hot gas. The general properties of the cluster are summarised in Table 1, along with the position, distances and angular scale of the system. Throughout the paper we assume =70, , and . Uncertainties are generally quoted at the 1 level, except in the case of X–ray spectral fitting, where 90 percent uncertainties were estimated. Section 2 describes the observation and data reduction, and Sections 3 and 4 our imaging and spectral analysis. In Section 5 we examine the properties of the gas in the core of NGC 6051, immediately surrounding the AGN, and in Section 6.1 we discuss the interaction between the radio jets and ICM, and place limits on the timescale of the outburst and the particle content of the radio lobes. We discuss our results in Section 7 and list our conclusions in Section 8.
| AWM 4 | z | 0.0318 |
| DA (Mpc) | 130.9 | |
| DL (Mpc) | 139.3 | |
| angular scale (kpc/′′) | 0.63 | |
| () | 400 | |
| NGC 6051 | RAJ2000 (h m s) | 16 04 56.8 |
| DECJ2000 (∘ ′ ′′) | +23 55 56 | |
| () | 6.94 | |
| 4C+24.36 | S1.4GHz,NVSS (mJy) | 608 |
| S235MHz (mJy) | 2750 | |
| log P1.4GHz (W Hz-1) | 24.14 |
2 Observations and Data Reduction
AWM 4 was observed by the Chandra ACIS instrument during Cycle 9 on 2008 May 18-19 (ObsID 9423) for 80 ks. A summary of the Chandra mission and instrumentation can be found in Weisskopf et al. (2002). The S3 CCD was placed at the focus of the telescope and the instrument operated in very faint mode, to take advantage of the superior cosmic ray rejection. We have reduced the data from the pointing using CIAO 4.1.2 and CALDB 4.1.2 following techniques similar to those described in O’Sullivan et al. (2007) and the Chandra analysis threads111http://asc.harvard.edu/ciao/threads/index.html. The level 1 events files were reprocessed using the very faint mode filtering, bad pixels and events with ASCA grades 1, 5 and 7 were removed, and the cosmic ray afterglow correction was applied. The data were corrected to the appropriate gain map, the standard time-dependent gain and charge-transfer inefficiency (CTI) corrections were made, and a background light curve was produced. The observation did not suffer from significant background flaring, and the final cleaned exposure time was 74.5 ks. While data from the entire detector were examined, for the purposes of this study we generally only make use of the S3 CCD, as the radio source and the cluster core fall on that chip.
Identification of point sources on S3 was performed using the ciao task wavdetect, with a detection threshold of 10-6, chosen to ensure that the task detects 1 false source in the field, working from a 0.3-7.0 keV image and exposure map. Source ellipses were generated with axes of length 4 times the standard deviation of each source distribution. These were then used to exclude sources from most spectral fits. A source was detected coincident with the peak of the diffuse X-ray emission; this was considered a potentially false detection and ignored, though we did later test for the presence of a central X-ray point source.
Spectra were extracted using the specextract task. Spectral fitting was performed in XSPEC 11.3.2ag. Abundances were measured relative to the abundance ratios of Grevesse & Sauval (1998). A galactic hydrogen column of 0.05 and a redshift of 0.0318 were assumed in all fits (except those whose purpose was to test the effect of varying hydrogen column), and 90% errors are reported for all fitted values. Spectra were grouped to 20 counts per bin, and counts at energies above 7 keV were ignored during fitting.
Background spectra were drawn from the standard set of CTI-corrected ACIS blank sky background events files in the Chandra CALDB. The exposure time of each background events file was altered to produce the same 9.5-12.0 keV count rate as that in the target observation. The same very faint mode background screening was applied to the background data sets. Comparison of source and background spectra suggested a slight excess of soft emission in the background datasets, mainly below 0.5 keV. This is not unexpected, as the soft X-ray background arises largely from hot gas in the galaxy, and from coronal emission associated with solar wind interactions, and thus is both spatially and temporally variable (e.g., Kuntz & Snowden, 2000; Snowden et al., 2004). There are also indications that the spectral shape of the background has changed since the creation of the blank-sky background files (c.f. the ACIS background cookbook222http://asc.harvard.edu/contrib/maxim/acisbg/COOKBOOK), which could contribute to the disagreement at low energies. Experimenting with fitting spectra in different energy bands, we found that ignoring energies below 0.7 keV produces results which are consistent with those derived from XMM-Newton in OS05. If the absorbing hydrogen column is allowed to vary in these fits it still tends to produce best fit values in excess of the galactic value, but typically consistent with it at the 90% uncertainty level, and with the hydrogen column derived from the XMM-Newton fits. Temperature, abundance and normalisation of the models are not significantly affected if the hydrogen column is allowed to vary, and our results are therefore independent of its value.
3 Imaging Analysis
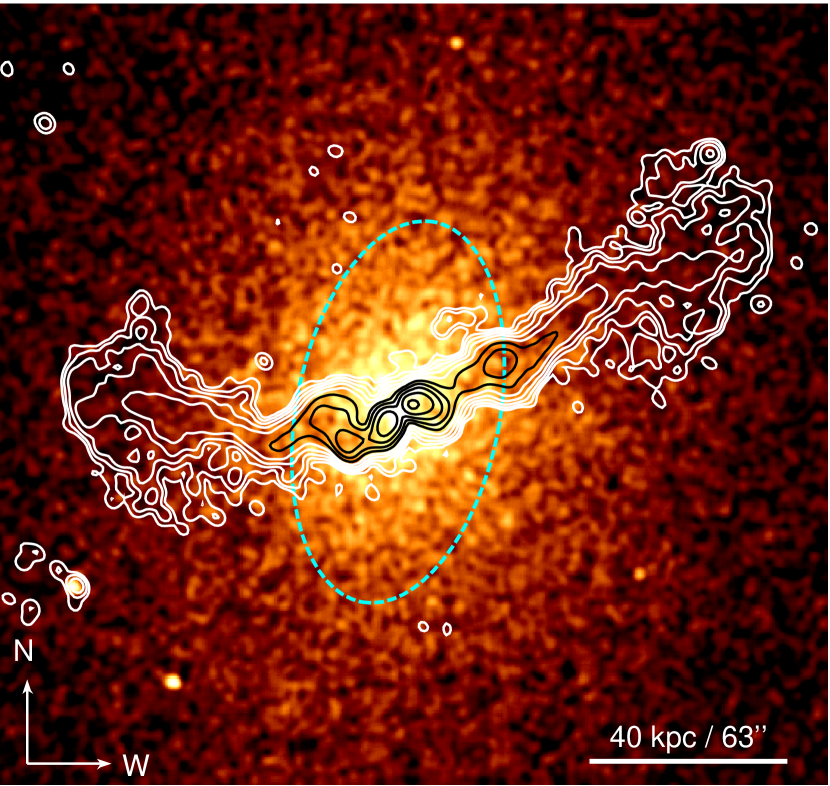
An initial examination of exposure–corrected images of AWM 4 agrees with the general conclusions of the XMM-Newton analysis of OS05. The cluster appears to be relaxed, with a fairly smooth elliptical surface brightness distribution roughly centred on NGC 6051. Figure 1 shows a soft-band image of the cluster with the ellipse of NGC 6051 and GMRT 610 MHz contours overlaid. There are no surface brightness discontinuities or “fronts” which would indicate the presence of large-scale gas motions or shocks in the cluster halo. However, a number of features which were not observed in the XMM images are visible in the Chandra data. The most obvious of them is a bright central peak, closely aligned with the central cD and the radio core detected at 4.9 GHz. This is only a few pixels in diameter, and so could not have been resolved by XMM. We will discuss this in more detail in Section 3.1.
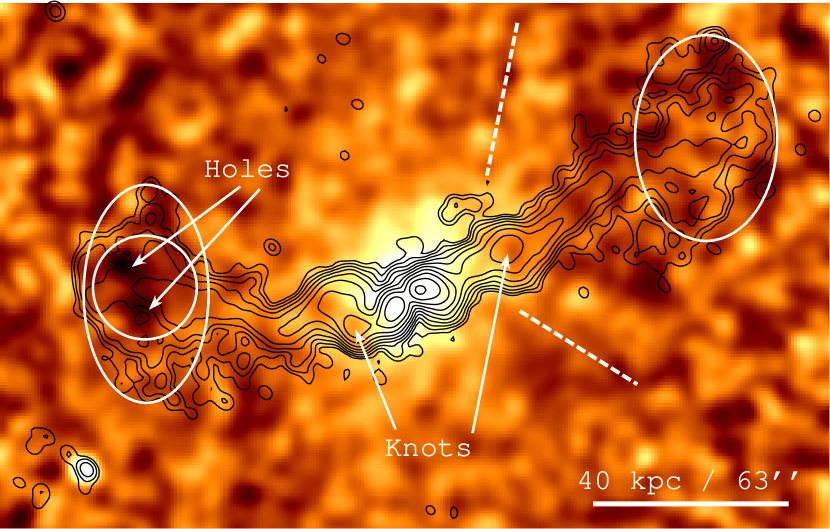
Weak features are visible along the jets, particularly in the east lobe and the knots 20 kpc from the radio core. To examine these, we created unsharp masked images smoothed at a range of scales. Figure 2 shows one example. The strongest feature in the field is a surface brightness deficit in the east radio lobe. The deficit is not well–correlated with the radio structure, instead appearing as two small “holes” in the X–ray emission toward the end of the lobe. No surface brightness structures are seen in the western lobe, though there is some indication of a broad opening or bay in the surface brightness on the west side of the cluster, into which the jet flows.
Using the ciao sherpa application we performed a two-dimensional surface brightness fit to the S3 0.7-3 keV image and subtracted the model image to search for residual features. Testing showed that PSF convolution did not significantly affect the fit, and we therefore used an unconvolved model. The background contribution was estimated from the scaled blank-sky dataset, and we corrected for vignetting and other effects using a monoenergetic 1.05 keV exposure map, the energy chosen to match the mean photon energy of the data. A reasonably accurate fit was produced with two -models, an extended elliptical component describing the large-scale emission and a compact component with negligible ellipticity describing the core surface brightness peak. The best fit parameters are given in Table 2 and the residual image is shown in Figure 2.
| Component | Parameter | Value (1 error) |
|---|---|---|
| 1 | (′′) | 0.14 |
| 0.433 | ||
| 2 | (′′) | 39.90 |
| 0.403 | ||
| ellip. | 0.231 | |
| p.a. (∘) | 80.2 |
Position angle (p.a.) represents the angle of the major axis north of due west.
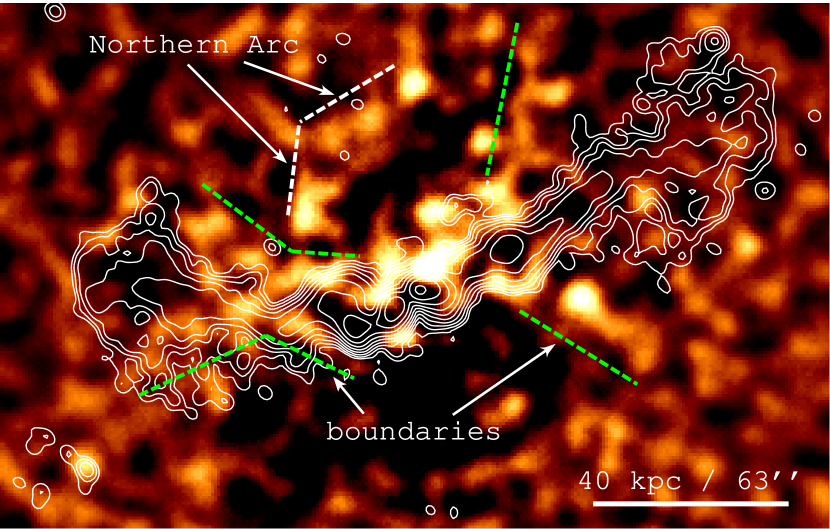
Unfortunately for our purposes, the strongest features in the resulting residual map are associated with a general inequality in surface brightness between the north and south quadrants of the cluster. This is visible in the residual image as a strong deficit in surface brightness to the south of the radio jet. AWM 4 is imperfectly described by a simple elliptical model, owing to the presence of additional surface brightness to the north of the core. This suggests that NGC 6051 is located somewhat to the south of the centroid of the large-scale X–ray halo. GVM08 determined that NGC 6051 is probably moving south, and this may explain the offset between the galaxy and ICM centroid. There is also an apparent arc of brighter emission to the north of the core, whose origin is unclear.
The residual image does reveal some indications of structures associated with the jets and lobes, most notably X–ray bright regions along the boundaries of the jets and possibly the inner part of the eastern lobe. The broad opening or “bay” in the surface brightness on the western side of the cluster also produces some features, though the opening angle is considerably wider than that of the jet and lobe. All of these features are relatively weak and identified in part because of apparent correlations with the jets.
To test the statistical significance of the features, we compared the structures with regions at similar radii, using the surface brightness models to define approximate isophotal ellipses. An elliptical annulus of width 40′′ covers the surface brightness deficits in the eastern lobe and the western bay, running through the base of the western lobe and the centre of the eastern lobe. We measured the 1-3 keV exposure corrected surface brightness (with point sources removed) in an azimuthal profile around the ellipse, using sections with angular width 9∘or 18∘. Figure 3 shows the results.
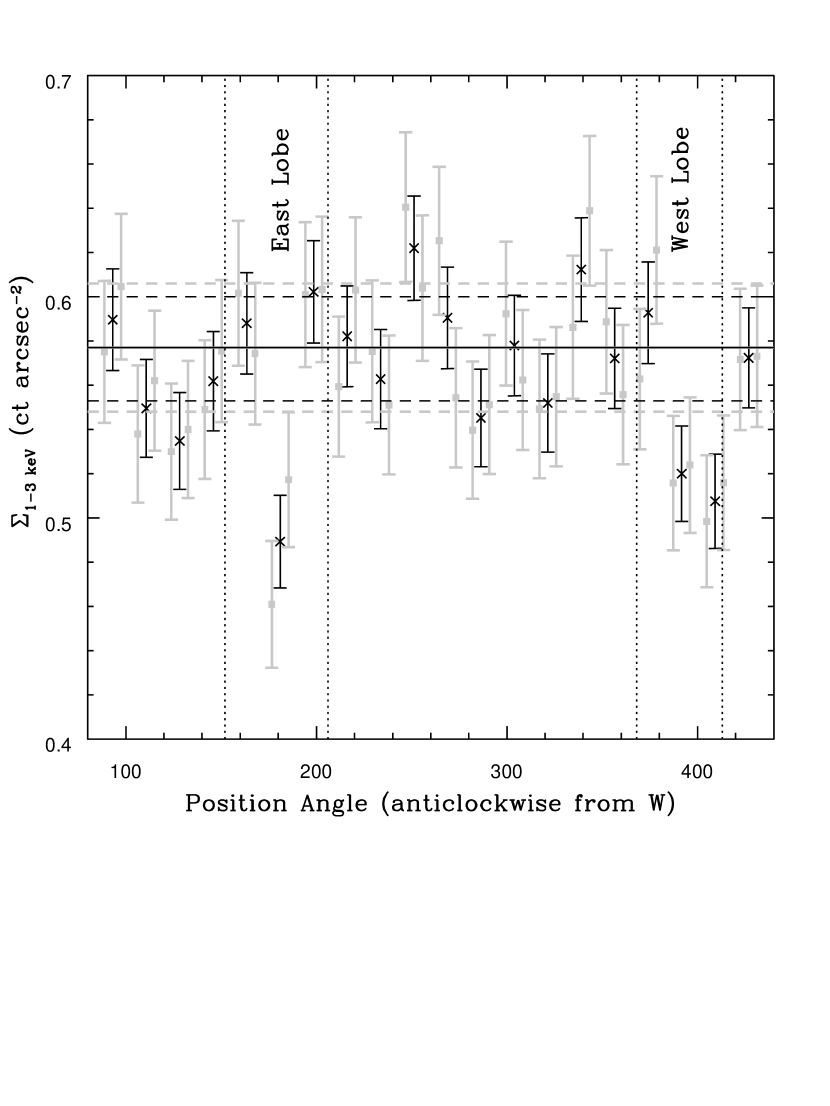
The two strongest negative features in the azimuthal profile occur within the boundaries of the radio lobes, and correlate with the features seen in the images. The deficit in the east lobe is stronger but smaller (corresponding to the “holes”) while the western deficit is broader but less deep, and offset to the north side of the lobe.
We estimate the significance of the deficits in the lobes by calculating the mean number of counts in the regions of the azimuthal profiles. Excluding the regions within the lobes (as marked on Figure 3) the mean of the 9∘ regions (or 18∘), exposure corrected and normalised to a fixed area of 4600 (2300) pixels, is 640.925.3 (320.517.9) counts. The lowest value in the east lobe is 547.1 (257.7) counts, giving a 3.7 (3.5) significance. This suggests that the “holes” in the east lobe represent a significant surface brightness depression, probably indicating the presence of a cavity in the ICM.
The lowest points in the western lobe are 2.9 (2.3) significant, and given the poorer alignment with the radio lobe it seems possible that they represent a more general deficit on this side of the cluster, rather than a cavity associated with the western lobe. This is supported by a simple analysis of the X–ray surface brightness in an ellipse chosen to match the lobe as a whole, compared with its surroundings. This shows a deficit only at 1 significance. Similar analysis for the east and west jet knots yields low significances. The highest, for the west knot, is 2.5. Deeper observations would be needed to determine the nature of these apparent structures.
The lack of clear, significant structures in the cluster is in itself interesting. If the radio lobes have excavated cavities in the ICM, we would expect a surface brightness deficit on their line of sight. We can estimate the volume of the lobes from their projected size. We assume them to be oblate ellipsoids with major/minor axes 2114.5 kpc (West) and 22.312.8 kpc (East) at radii of 68.8 and 64.7 kpc respectively. From the surface brightness models we expect to see 1120 counts (1-3 keV) along the line of sight of the west lobe and 1270 from the east lobe if there are no cavities. Based on the density profile of the ICM (see Section 4), we estimate that we would expect deficits of 184 counts and 251 counts for the west and east lobes respectively if the lobes are empty of ICM plasma. We would therefore expect to detect cavities at reasonable significance (4-5). The fact that we find a significant decrement only in a small region of the east lobe raises questions about the lobe contents.
3.1 The cluster core and AGN
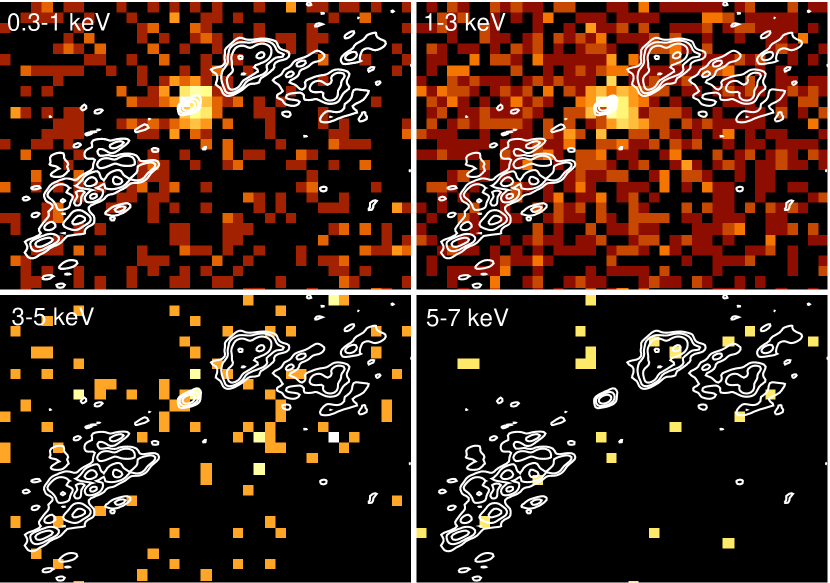
The observed central surface brightness peak could arise from several causes, including X-ray emission from the AGN, the presence of a small-scale cooling region or galactic corona, and emission associated with the stellar population of NGC 6051. Surface brightness fitting to the 0.7-3 keV image confirms that the emission is extended and is poorly described by a point source model, indicating that an AGN cannot be the only source present. Figure 4 shows images in four energy bands, 0.3-1 keV, 1-3 keV, 3-5 keV and 5-7 keV. The central source is clearly extended up to 3 keV, but examination of the 3-5 keV image shows four counts detected at the position of the radio core, and no counts in the 5-7 keV band. Contributions from thermal plasma emission should be negligible in such a small region in the harder bands, so the 3-5 keV counts may arise from either AGN or X-ray binary emission.
Comparison with the 4.9 GHz contours (derived from VLA archival data, project AK0360), indicates that the extent of the surface brightness peak is similar to the distance at which the jets are first detected, particularly for the western jet. The lack of detectable jets inside this region could indicate that they have switched off. We consider this unlikely, since the spectral index in the innermost region where the jets are detected is , consistent with a currently active radio galaxy rather than a dying source (GVM08). We instead assume that the jets are not detected closer to the core because they are highly collimated and therefore not resolved. This suggests that the jets lose collimation and ’flare’ to a greater width close to the edge of the X–ray surface brightness feature.
We can estimate the emission likely from unresolved point sources in NGC 6051 based on known X-ray/optical scaling relations. Unfortunately, the scale of the surface brightness peak is only a few arcseconds, and no suitable high-resolution optical data are available. We therefore extract a -band surface brightness profile from the 2-Micron All-Sky Survey (2MASS, Skrutskie et al., 2006) image of NGC 6051. This image has pixels 1′′ in size, but is derived from a combination of 2′′-pixel images obtained by the survey telescope. The central -band surface brightness profile is effectively smoothed by this process and may be broader and less peaked than the true profile.
We estimate the X-ray flux from low mass X-ray binaries (LMXBs) using the relation of Kim & Fabbiano (2004). The small number of 3-5 keV counts observed at the position of the radio core are consistent with the expected LMXB emission in this area, within the (large) uncertainties. We place a 90% upper limit on the AGN luminosity of L(0.7-7 keV) by assuming a power law spectrum with =1.7, and subtracting our best estimate of the flux from low-mass X-ray binaries.
To calculate the expected point source contribution in the area of the extended soft-band core, we must also include emission from stellar sources such as cataclysmic variables and coronally active binaries. This contribution can be predicted using estimates from the Milky Way bulge (Sazonov et al., 2006). We work in the 0.5-2 keV band for which this relation is defined, scaling the LMXB contribution to match. The stellar sources are assumed to have a 0.5 keV, solar abundance thermal plasma spectrum. We estimate the contribution from the large-scale gaseous halo of AWM 4 by fitting a -model to the 0.5-2 keV surface brightness profile between 30′′and 200′′. This produces an almost flat contribution to surface brightness in the core. Figure 5 shows these predicted surface brightness profiles compared to the measured surface brightness.
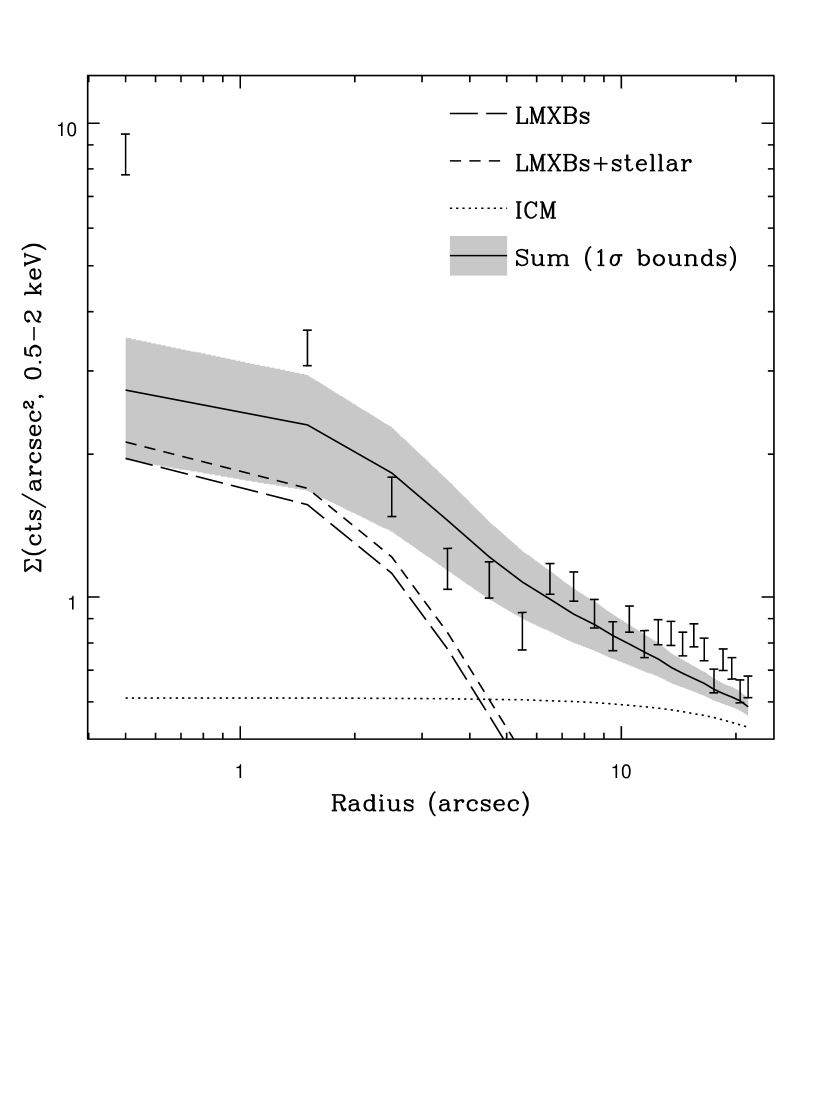
At radii greater than 6′′, the sum of the predicted profiles is a reasonable match to the measured surface brightness profile. Inside this radius the agreement is less satisfactory; the measured profile is brighter than expected by a factor 3 at the centre and appears to be more sharply peaked. The overestimation of flux at 2-6′′, while statistically acceptable, is probably a result of the poorer resolution of the -band profile. It seems unlikely that the underestimation of the peak flux could arise from this source, and we therefore conclude that an additional extended spectrally soft surface brightness component is present.
4 Spectral Analysis
To establish the general radial dependence of gas properties, we extracted spectra from the S3 CCD in circular annular regions chosen to produce spectra with a signal-to-noise ratio greater than 100 in a 0.7-7.0 keV band. A central bin of radius 6 pixels (3′′) was added to allow us to search for differences in the central surface brightness peak. The annuli were centred on the peak of the X-ray emission, which corresponds to the optical centre of NGC 6051 and the position of the core of 4C+24.36. The spectra were fitted using the wabs absorption (Morrison & McCammon, 1983) and APEC plasma models (Smith et al., 2001), and since gas properties are expected to vary with true three-dimensional radius, we used the xspec projct model to deproject the data. Beyond 200′′ the annuli no longer fall entirely on the S3 chip. The lost area was corrected for in the projct model, using the angular coverage parameters for each annulus. The outermost annulus in each fit contains less than the required number of counts and is not deprojected; for this reason values in the outermost bin should only be considered indicative. The radio lobes only extend to 145′′, so we do not expect edge effects to influence our results.
A second set of annular spectra were also extracted, with the radii of the bins in the range 3-136′′ chosen to be closely comparable with regions used in examining the physical properties of the radio jets and lobes. These spectra are treated identically to the S/N=100 profile, and produce very similar results. Comparison of the two profiles shows that outlying data points, such as the temperature in bin 5 of the S/N=100 profile, and abundance in bin 2 of the alternate profile, are not seen replicated when the radii of the spectral regions are changed. This suggests that they do not represent the true temperature or abundance at those radii; the underlying gas properties are likely to vary smoothly with radius.
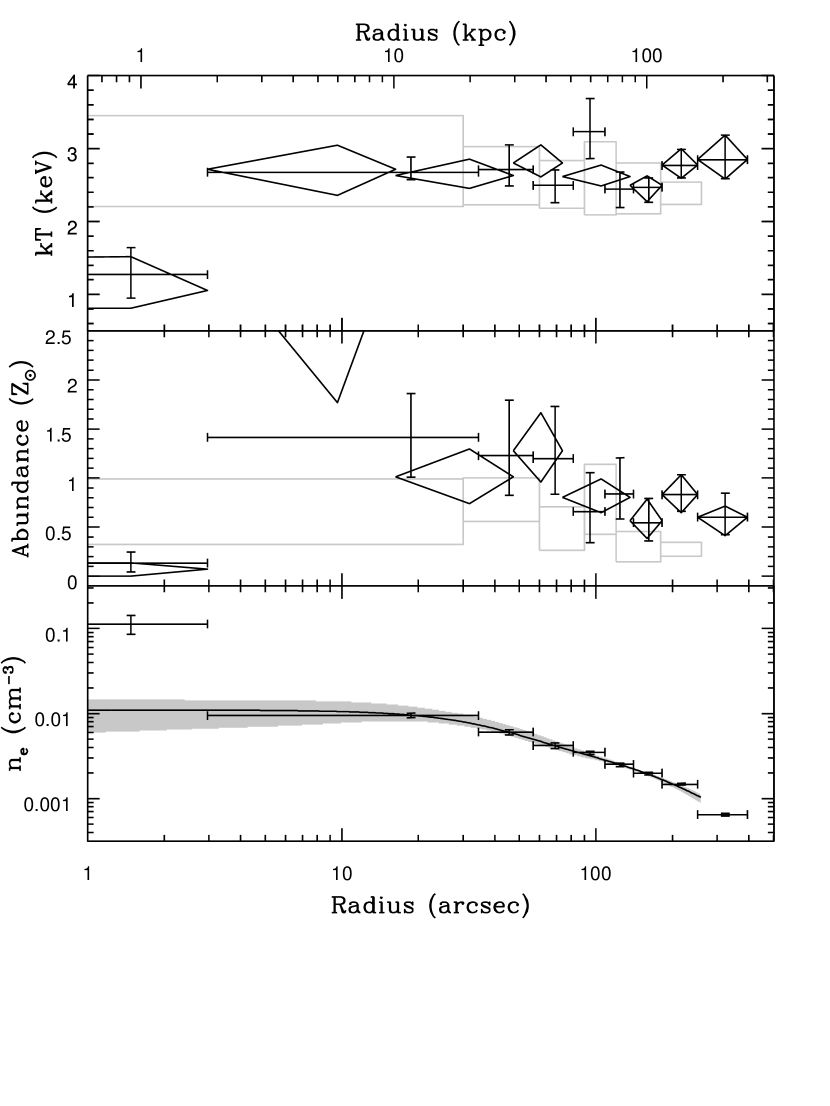
Figure 6 shows the deprojected temperature and abundance profiles for this deprojection. Comparison with the XMM temperature and density profiles shows close agreement, confirming the approximate isothermality and smooth decline of density with radius over the field of view. The exception is the central bin, which has a temperature of 1.2 keV compared to the 2.6 keV surrounding emission and a mean density approximately an order of magnitude greater than the ICM. This suggests that the central surface brightness peak corresponds to a small-scale cool core or galactic corona.
An apparent difference in abundance profiles between Chandra and XMM arises from the different abundance tables used in the analysis. We use the Grevesse & Sauval (1998) tables, while the older Anders & Grevesse (1989) tables were used for the XMM analysis (OS05). Refitting our models using the older table produces results in good agreement with the XMM profile. There is some indication of a central abundance plateau in AWM 4, extending out to 75′′ (50 kpc). Outside this radius the abundance declines.
The central bin has a very low abundance, possibly owing to our use of a single temperature plasma model for a spectrum which must have multiple emission components. We therefore repeat our deprojection analysis, adding two more components to the spectral model of the central bin, a 0.5 keV solar abundance APEC model representing stellar sources and a =1.7 power law for the LMXBs. Normalisations were determined from the estimated surface brightness profiles described in Section 3.1. These additional components affect the parameters of the original plasma model only slightly, and we find a temperature of =1.00 keV and abundance of 0.10. This is still very low, and it seems likely we are still underestimating the abundance, possibly owing to the presence of a range of temperatures within the central bin (The Fe–bias effect, Buote & Fabian, 1998).
5 Gas Properties of the Core
The mean density in the core, assuming that it fills a sphere of radius 1875 pc (3′′), equivalent to our spectral extraction region, is =0.101. Sun et al. (2007) examined a sample of small cool cores contained within galaxies, which they argued were formed largely from material produced by stellar mass loss, distinct from the surrounding hotter gas associated with the larger group or cluster. They suggest that these galactic coronae should be in pressure equilibrium with the surrounding ICM. Estimating the required pressure, we find that a density of 0.291 is needed. If the background subtracted flux in the 3′′ aperture arises only from a corona with this density and the measured temperature, it must occupy a smaller volume, a sphere of radius 1320 pc (2′′). This is in reasonable agreement with our surface brightness modelling. The 0.5-2 keV and 1.4 GHz luminosities, L and L W Hz-1, are in the respective ranges found for the population of coronae studied by (Sun, 2009).
The isobaric cooling time of the gas in the cool core can be approximated as
| (1) |
where is the volume of the gas, is the bolometric X-ray luminosity, is deprojected temperature, the deprojected electron number density, and and are the mean molecular weight (0.593) and mean mass per electron (1.167) of the gas. We find a cooling time of 302 Myr, as compared to =1.5-3 Gyr for the 2.6 keV gas immediately outside the corona.
Gas cooling from the corona may be the main source of material fuelling the active nucleus. We therefore consider the physical parameters of this cooling to determine whether the corona is a realistic source of fuel over the lifespan of the outburst. The mass of gas cooling out of the X-ray phase within the corona can be estimated based on the assumption of continuous isobaric cooling as
| (2) |
where is the proton mass. We find a deposition rate of =0.067yr-1. This is a sufficient rate to support the observed AGN activity; taking our largest estimate of the mechanical energy output of the AGN, 1.63 erg (for lobes completely filled by relativistic plasma at the projected distance from the AGN, see Section 6.5) and the radiative timescale determined from the radio observations (170 Myr; GVM08) we can estimate the AGN power output to be 3.04. The required efficiency of the AGN in converting the cooled gas into energy would thus be =8. Sun et al. (2007) note that mass loss from stars may contribute to the mass of cool gas available, reducing the required efficiency further. We estimate the stellar mass loss from AGB stars within the core to be 0.03yr-1, based on the mass loss rates of Athey et al. (2002). This suggests that the stellar mass loss rate may be at least capable of balancing cooling losses from the corona.
If the AGN is fuelled directly from the hot gas of the corona (i.e., without the requirement that the gas first cool out of the X–ray regime), a first approximation of the energy available can be obtained by assuming the Bondi accretion rate (e.g., Allen et al., 2006). The Bondi accretion radius , where is the adiabatic sound speed (536) and the black hole mass, which we can estimate from the relationship between and the central stellar velocity dispersion (Gebhardt et al., 2000). Taking the averaged velocity dispersion for NGC 6051 from LEDA333http://leda.univ-lyon1.fr/, =343, we find =9.1, and therefore a Bondi accretion radius =13.65 pc. The Bondi accretion rate is defined as where is the density at the Bondi accretion radius. Since this radius is a factor smaller than our innermost spectral bin, it is clear that the uncertainty on will be the dominant source of uncertainty in our estimate of the accretion rate.
We can place a lower limit on by assuming that it is equal to the mean density of the corona. Unlike cooling time and mass deposition rate, the Bondi accretion rate will therefore depend on the volume we assume the corona to occupy. Adopting the lower density derived from the spectral extraction region we find yr-1, implying a maximum conversion efficiency of , rather higher than the efficiency of 0.1 often assumed. If we instead estimate by fitting two -models to the deprojected density profile, we find a central electron density of , about ten times greater than the mean density of the central spectral bin. This leads to a Bondi accretion rate yr-1 and a conversion efficiency . This is likely still an underestimate, as the 0.3-1 keV surface brightness profile, which most closely reflects the density of the cool gas, does not flatten in the core at the resolution of Chandra. However, these values are sufficient to confirm that accretion directly from the hot phase could fuel the AGN. We therefore conclude that at least in principle, the corona can support the AGN outburst over long periods without the need to build up significant quantities of cold gas.
Given the strong temperature difference between the corona and ICM, conduction could have a significant effect on the corona gas. Studies of coronae in clusters across a range of temperatures suggest that conduction must be suppressed (by factors 30-500) for the corona to survive more than a few Myr (Sun et al., 2007). This is an important factor in differentiating coronae from simple cool cores, as the suppression of conduction implies a physical separation between corona and ICM, with the corona sustained by stellar mass loss within the galaxy rather than cooling from the cluster.
We assume a temperature gradient of 1.36 keV across a distance of 5.16 kpc, the distance between the midpoints of the first and second bins of our temperature profile. We find the mean free path of electrons in the ICM to be 170 pc. Conductivity follows the relations described by (Spitzer, 1962) where mean free path , the scale height of the temperature gradient, and saturates where the two are comparable (Cowie & McKee, 1977). We find pc and estimate the temperature gradient extends over 5 kpc, so calculate the “classical” conduction rate (using the methods described in O’Sullivan et al., 2007).
We find the classical rate of energy transfer to be 1042, assuming a radius of 1875 pc for the corona. The bolometric X–ray luminosity of the corona gas is only 5.71040, and radiative cooling therefore cannot balance conduction. The implied timescale for the corona to be heated to the temperature of the surrounding IGM is 10 Myr. If we use the smaller radius estimated from the pressure balance argument, the conduction rate is reduced, but the corona will still be heated in 20 Myr. Taking the radiative age of 170 Myr as the timescale over which the temperature gradient has existed, conduction into the corona must be suppressed by at least a factor 15-20, presumably owing to the effects of magnetic fields. Shorter timescales will reduce the need for suppression, but are unlikely to resolve the issue.
The estimated mechanical power of the AGN jets would also heat the corona on short timescales if the jets were interacting with the corona gas. Assuming a jet power of (see Section 6.5) only 0.4 per cent efficiency would be required to heat the corona over the timescale of the current outburst (170 Myr). The apparent tight collimation of the jets within the corona suggests that any interaction with the corona gas is minimal. We conclude that neither conduction nor the AGN jets are heating the corona to a significant degree. This suggests that the presence of the corona may disrupt the feedback relationship between gas cooling and AGN heating, since the jets do not reheat the material which fuels the nuclear activity.
6 Properties of the radio source and impact on the ICM
6.1 Pressure balance
The absence of strong X–ray surface brightness features associated with the radio source suggests a) that the jets and lobes of 4C+24.36 are in approximate pressure equilibrium with the ICM, and b) that any cavities associated with the lobes are only partially filled by radio plasma, or that some other factor is affecting our estimate of the expected surface brightness deficit. A comparison of the apparent pressures of the thermal and relativistic plasma can provide insight into the particle content of the jets (e.g., Dunn & Fabian, 2004; Dunn et al., 2005; Bîrzan et al., 2008). We therefore estimate pressure profiles from both the X–ray and radio data.
Our radio analysis is performed using the GMRT 235, 327 and 610 MHz observations presented in GVM08 and archival 1.4 and 4.9 GHz VLA data. We select four regions along each jet, with minimum size based on the lowest resolution data (13′′ HPBW at 235 MHz). These regions are shown in Figure 7. While they appear large compared to the structures in the 610 MHz image, they are well matched to the size of jets and lobes at 235 MHz and therefore suitable for examination of the spectral index across the different frequencies. The volumes of the regions are estimated assuming them to be oblate or prolate ellipsoids with rotation axes aligned with the jet. Fluxes are measured in each band to obtain the integrated radio spectra for each region. The spectra are fitted with the Synage++ package (Murgia, 2001), adopting a continuous injection model (CI, Kardashev, 1962) to derive the injection spectral index for each region. Using , we then derive the physical parameters in each regions assuming minimum energy conditions, in which the contribution to the total energy content from relativistic particles and magnetic field are approximately equal. Uncertainties on derived parameters are estimated using the errors on provided by the best-fits, and an assumed 5% uncertainty on the radio flux. For our analysis, the synchrotron radio pressure is defined to be
| (3) |
where and are the energy density of the magnetic field and relativistic particles, and are the minimum energy magnetic field and total energy in electrons, is the permeability of free space (4 N or if working in Gauss and cgs units), is the volume of the region, is the filling factor, and is the ratio of energy in non-radiating particles to the energy in electrons.
For the initial pressure calculations we assume and , implying that half of the energy in particles is in the form of non-radiating particles, as would be the case in an electron-proton jet. An electron-positron jet would have . We note that our definition of differs from some commonly used formulae (e.g., Fabian et al., 2002) which use the ratio of the total energy in particles to the energy in electrons (i.e. ). Under our definition, , so our assumption of equal energy in radiating and non-radiating particles would imply .
The pressure of the relativistic plasma also depends strongly on the range of energies in the particle population. As particles with low values radiate at frequencies which are not practically observable in most sources, it is generally necessary to assume an energy range. We have chosen to consider three possible ranges:
-
1.
values equivalent to the frequency range 10 MHz-100 GHz, which we refer to as the standard equipartition case. This is comparable to many previous studies in the literature.
-
2.
=100-5500, referred to as revised equipartition with =100. This is the range chosen by GVM08.
-
3.
=10-5500, referred to as revised equipartition with =10, chosen to allow us to examine the effect of including low energy electrons, under the assumption that the electron energy distribution continues to follow a power law down to low Lorentz factors.
We discuss these ranges and the reason for their choice below.
Most previous studies of the physical parameters of the jets and lobes of radio galaxies have adopted the frequency range of 10 MHz-100 GHz normally used in the standard equipartition equations (Pacholczyk, 1970). In many cases high values (of the order of 100-10000, e.g., Dunn et al., 2005) are found, indicating a requirement for a large fraction of energy in non-radiating particles. Inverse Compton observations of high-redshift radio sources have shown that the assumption of a power law distribution of electron energies is reliable down to values of a few hundred, which would have synchrotron frequencies 500 kHz. These lower energy electrons could provide at least part of the additional pressure implied by the large observed values (Croston et al., 2008; Dunn et al., 2010). GVM08 include these lower energy electrons in their estimates of total energy and pressure, using the revised equipartition equations of Brunetti et al. (1997) with a minimum electron energy cutoff () instead of a minimum frequency. Following GVM08, we estimate the radio pressure assuming and . The maximum energy cutoff, , was selected such that the maximum emitting frequency of the electrons matched the observed break frequency of the radio spectrum, again following GVM08. In the lobes, this gave =5500. Approximate break frequencies for the different regions are given in Table 3.
| Region | Region | ||
|---|---|---|---|
| (GHz) | (GHz) | ||
| E1 | 30 | W1 | 5 |
| E2 | 3 | W1 | 2 |
| E3 | 1.2 | W3 | 1 |
| E4 | 0.7 | W4 | 0.7 |
Note that in regions W1 and E1 the frequencies are poorly constrained, as the change in powerlaw slope is small.
The thermal pressure of the ICM was derived from the deprojected spectral profiles with annuli selected to match those of the ellipses used in the radio. The pressure in each annulus was calculated as P where we have assumed an ideal gas with . The resulting profile agrees well with the pressure profile derived from the XMM-Newton analysis of OS05, except in the central bin which the XMM profile does not resolve. We note that the X–ray pressure profile presented in GVM08 was unfortunately incorrect, with the normalisation of the thermal gas pressure profile decreased by a factor of 10 from its true value. Figure 8 shows a comparison between the thermal gas pressure profiles and the minimum synchrotron pressure estimates described above.
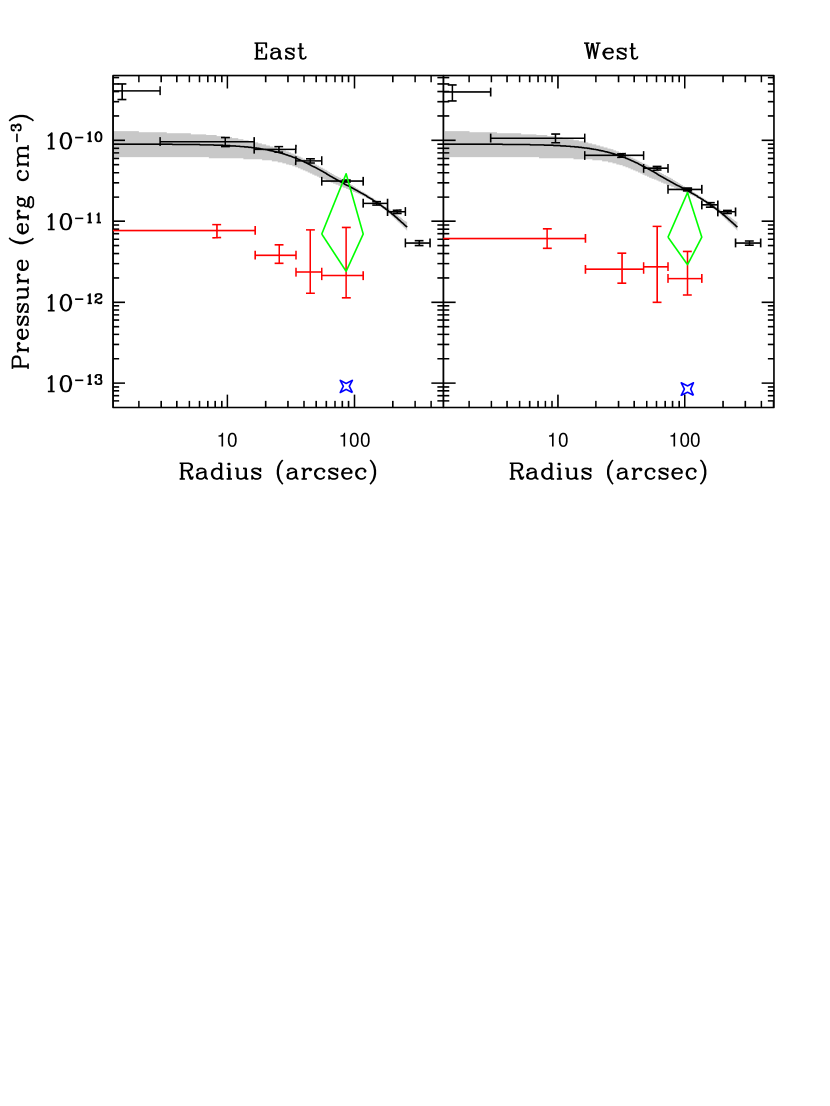
The estimated synchrotron pressure in the jets and lobes is lower than the thermal pressure at all radii. This is expected; pressure imbalances between radio sources and the surrounding ICM are common in extended FR-I radio sources, with the ratio of thermal to synchrotron pressures (Pth/Psync) having values of up to 100 (under standard equipartition assumptions, Feretti et al., 1992). The uncertainties in the synchrotron pressures in the outer bins are large. For our estimates, the imbalance is significant, except in the east lobe where the significance drops to 2.2. While this means that statistically the east lobe may be in pressure equilibrium, the consistently low pressure estimates in the other regions strongly indicate an imbalance in the source as a whole.
The synchrotron pressures decline by a factor 3-4 with radius, as expected, given radiative energy losses from the particle population of the jets. The pressure profiles are roughly consistent with a constant pressure ratio of 15. There is no indication of a strong gradient in pressure ratio, which might have been expected if the jets are entraining significant quantities of ICM gas over their whole length.
As our assumed values of =1 and =1 appear to be inconsistent with the data for the case, we estimate the change in these parameters which would be necessary to produce pressure equilibrium in the lobes. Setting equation 3 to be equal to the thermal pressure and rearranging allows us to place limits on these parameters, shown in Table 4.
| Lobe | revised equipartition, | standard equipartition | revised equipartition, | |||||||
|---|---|---|---|---|---|---|---|---|---|---|
| (erg cm-3) | (G) | (erg cm-3) | (G) | (erg cm-3) | (G) | (erg cm-3) | ||||
| East | 31.40 | 6.36 | 2.14 | 160.3 | 1.92 | 9.11 | 3192.6 | 11.45 | 6.95 | 43.3 |
| West | 24.80 | 6.09 | 1.96 | 123.0 | 1.85 | 8.44 | 2448.2 | 10.97 | 6.38 | 32.4 |
Note that values of are those required for pressure equilibrium in the three cases. The spectral index used was .
Our alternative estimates of pressure in the lobes can also be considered in this way. Assuming standard equipartition conditions decreases the estimated pressure in the lobes by a large factor, with pressure ratios of . This translates into a high value of , which strongly suggests a large amount of additional energy in the non-radiating particle population. The revised equipartition estimates for =10 reduce the pressure imbalance to a factor of 3.9-4.5, with 1 uncertainties consistent with the thermal pressure. While these uncertainties are large, owing to the extrapolation of uncertainties in the spectral index to low values, this indicates that the additional energy required for pressure balance could be provided by the inclusion of electrons with low Lorentz factors. The remaining imbalance could be explained by relatively minor changes in or ; the latter is of particular interest given the weak cavities in AWM 4. The large differences between these two estimates clearly indicates the importance of the equipartition assumptions in determining the pressure imbalance and any interpretation of the data.
6.2 Outburst Timescale
The activity timescale of the radio source can be estimated in several ways. Following Parma et al. (1986), GVM08 estimate the age of the source by modelling the change in radio spectral index along the jets and lobes, under the assumption that the age of the radio emitting electrons increases linearly with distance. They find ages of 171 Myr and 159 Myr for the east and west jets and lobes respectively, assuming =10 and a fitted injection spectral index 0.5. Recalculating with =100, we find ages of 183 Myr and 164 Myr for the east and west jets and lobes. As these calculations are based on multiple independent spectral index measurements in each direction, this is likely the most reliable radiative age measurement available. However, it should be noted that the ages are most applicable to the lobes; a younger age would be found at a given point along the jet. GVM08 also note that the estimated age is dependent on the assumption that losses associated with source expansion are negligible. If this is not that case, the radiative age could be reduced by up to a factor of 3.
Radiative ages can also be estimated for individual regions, based on the minimum energy magnetic field measurements, using Equation 1 of GVM08. The injection spectral index estimated for the lobes () differs from the global estimate (), which can lead to large differences in radiative age. Adopting =100, we find an age of 135 Myr (132 Myr) for the east (west) lobe. These values are consistent with those derived from the ages derived from modelling of spectral aging. The standard equipartition assumptions produce much greater ages, 252 Myr and 236 Myr for the east and west lobes respectively. Conversely, adopting the revised equipartition assumptions with =10, we find much shorter ages, 66 Myr for both lobes.
Independent limits on the age of the radio source, and therefore on its magnetic field strength and particle content, can be estimated based on dynamical arguments. A lower limit on the age of the lobes can be estimated from the time taken for them to grow to their current size assuming that (as we see no evidence of shocks associated with them) their expansion has been subsonic. We can also estimate the time taken for the jets to expand to their observed length at the sound speed (770 for =2.6 keV), though there is a possibility that the jets may have expanded supersonically earlier in their history and the shocks produced have now moved out of the field of view or weakened to become undetectable.
A more realistic value may be the time taken for the lobes to rise buoyantly to their current position. The buoyant velocity is
| (4) |
where is the mean radius from the core at which the lobe is found, is its cross-sectional area in the direction of motion, its volume, the total gravitational mass within , and the coefficient of drag, typically taken to be 0.75 (Churazov et al., 2001). Finally, we can also estimate the time required for the ICM to refill the displaced volume as the lobe rises, , where is the mean radial size of the lobe. These four timescale estimates are given in table 5.
| Lobe | |||||||||||
|---|---|---|---|---|---|---|---|---|---|---|---|
| (Myr) | (Myr) | (Myr) | (Myr) | (Myr) | (Myr) | (Myr) | (Myr) | ||||
| East | 183 | 171 | 135 | 66 | 27.53 | 69.5 | 103.16 | 120.02 | 430.3 | 249.6 | 196.3 |
| West | 164 | 159 | 132 | 66 | 26.77 | 87.3 | 134.76 | 129.20 | 239.0 | 118.8 | 128.7 |
is the radiative age estimated from spectral aging along the jets
is the radiative age estimated from the spectral index of the lobes
is the time required for lobes to expand to their current width at the sound speed
is the time required for the west jet and lobe to reach their current length at the sound speed.
Using these timescales to estimate the magnetic field strength, we can again assume pressure equilibrium so as to determine . However, we must take into account the dependence of the energy of the particle population on the magnetic field strength. Following Brunetti et al. (1997), this dependence is of the form , leading us to modify equation 3 as
| (5) |
where is a constant related to the synchrotron flux, and the spectral index. We can therefore calculate the change in relative to our original value. The timescales and resulting values, assuming magnetic field strengths derived for the revised equipartition conditions and =100, are given in Table 5. Estimates based on the sonic expansion timescale of the lobes are not included as this is short enough to imply synchrotron pressures greater than the thermal pressure.
The dynamical timescales are all shorter than the GVM08 radiative age derived from the spectral aging along the jets. The buoyancy and refill timescales of the west lobe are comparable to the radiative age derived from the =100 magnetic field measurement in that lobe. However, both timescales depend strongly on the filling factor; reducing would produce a shorter refill time, but a longer buoyant rise time. The change in buoyancy timescale will depend on the morphology of the lobe material. For a simple spherical cavity, , so for =0.2, will increase by a factor 1.3 to 175 Myr for the west lobe. The clumpy appearance of the radio lobes suggests that they have a large surface area for their volume, so is likely to increase more slowly. However, it seems possible that filling factor considerations account for part of the difference between the buoyancy and radiative timescales.
The sonic expansion timescale of the jets is comparable to the =10 radiative age in the east jet, and longer than it in the west jet. The large uncertainties on the radiative age mean that there is no formal disagreement, but this suggests that the jets expanded supersonically over some portion of their history. If this is the case, shocks would have been produced, perhaps providing additional heating.
6.3 Filling factors and Mixing in the Lobes
The lack of clearly detected cavities in AWM 4 raises the possibility that the lobes are not completely filled by relativistic plasma. Some support for this provided by the radio maps of 4C+24.36 (e.g., Figure 7), which show both lobes to be clumpy, with brighter regions apparently tracing the jets out to the tips of the lobes and fainter, flocculent regions to north and south. By comparison, the jets are much more sharply defined.
The lobes may have formed because the jets become uncollimated, with the relativistic plasma breaking up to form smaller clouds and filaments which then mix with the ICM. The appearance of the radio emission and the lack of evidence for higher ICM temperatures along the lines of sight to the lobes argue against direct mixing of the jet plasma with the ICM gas, instead suggesting that it remains confined, probably in the form of clumps with embedded magnetic fields. For this scenario, we can place limits on the filling factor based on the X–ray surface brightness in the lobes.
For the western lobe, where only a weak deficit in surface brightness is seen, we estimate a 3 upper limit of , assuming that there are no significant additional sources of X–ray flux in the lobe. The observed decrement of 40 counts (1120 counts expected, 1080 observed, 1-3 keV) suggests =0.21, and is consistent with a zero filling factor. As discussed in Section 3, we would expect a deficit of 184 counts if the lobe were empty of thermal plasma.
In the east lobe, where we see some indication of a cavity, we use the circular region shown in Figure 2 (as compared to the larger ellipse discussed in Section 3) and find 430 counts, giving a decrement of 60 counts below the 495 expected from the surface brightness model. Assuming ICM properties typical at this radius, this implies a that only 24% of the volume of the lobe is filled by relativistic plasma. However, the X–ray emission over the remainder of the lobe is uneven, with weak filamentary structures to north and south of the holes, so our estimate of the filling factor may be too low. Considering the lobe region as a whole (i.e., the ellipse region in Figure 2), we can place a 3 upper limit of .
As discussed in Section 6.1, provided the magnetic field is similar to the equipartition or minimum energy field strengths. Using the revised equipartition conditions, the magnetic field can be defined as
| (6) |
where is the synchrotron luminosity, is the volume, and is the spectral index (Govoni & Feretti, 2004). The constant is a function of the spectral index and the frequency band over which we integrate (Pacholczyk, 1970).
For our source , so . Our filling factors thus suggest a pressure increase of a factor of 2-2.2, with a 3 minimum increase of 1.5. This is insufficient to resolve the pressure imbalance we estimate from the revised equipartition assumptions with =100, but would significantly reduce the discrepancy. Based on these limits on we can estimate the value of (and the 3 upper limits) to be =37.5 () for the east lobe, and =24.8 () for the west lobe. Filling factors of order =0.015 would be required to match the range of pressure imbalance in the lobes. While this would be consistent with the lack of surface brightness features in the west lobe, it is problematic for the decrement seen in the east lobe. This suggests that simple mixing with the ICM gas cannot account for the observed pressure imbalance.
If we assume =10, the limits on will of course be reduced. In this case =10.4 for the east and =6.8 for the west lobe. Within the uncertainties, the =10 pressures are consistent with the =1 expected for an electron/proton jet with equal energies in each class of particles. However, the uncertainties on are very large, and would also be consistent with =0 or with the values estimated using =100.
6.4 Entrainment in the Jets
A possible additional source of pressure is gas entrained and heated by the jets. It is thought that entrainment slows FR-I jets and causes their broadening (e.g., Worrall, 2009), and heating of entrained material is likely to be most effective where the jet is still collimated and its velocity is high. As we see little sign of interaction between the jets and corona, the most likely source of entrained material is mass loss from stars inside the kpc–scale jets. We place a maximum limit on the jet width from the 0.4′′ resolution of the 4.9 GHz data (250 pc), and take the length from mean distance between the radio core and the points where the jets begin to flare (1.5 kpc). We estimate the stellar mass loss rate for stars within the jets from the mass loss rate of AGB stars in old stellar populations, ) yr-1 (Athey et al., 2002), using the mean stellar density within 1.5 kpc, 2.76 kpc-3. Each jet is therefore likely to entrain approximately 1.63 yr-1. If we assume the jet has been active for 170 Myr and is rapid enough to transfer all entrained material into the lobes, we expect of stellar material to be mixed with the relativistic plasma.
Based on the ICM density profile and the ellipsoidal lobe regions assumed above, we estimate that if they are completely filled by radio plasma, the lobes have each displaced of ICM gas. The pressure imbalance suggests that the radio component in fact occupies only 25 per cent of the lobe volume. For entrained stellar wind gas to provide the remaining pressure, it would need to be heated to temperatures 5 MeV. Such material could be the source of additional particles in the jet implied by , without contributing significantly to the X–ray flux from the lobes. It would produce inverse-Compton scattering, but an electron energy of 5 MeV is equivalent to , so CMB photons will be scattered into the mid-Infrared rather than the X-ray band. Assuming that this population provides all of the pressure required to bring the lobes into equilibrium, and a nominal spread of energies of a factor of four, we can expect an Infrared flux of 1.1. This is well below most estimates of the cosmic Infrared background (e.g., Dole et al., 2006) and approximately three orders of magnitude below the 15m limit from ISOCAM (Elbaz et al., 1999) which most closely matches the expected energy.
It is also possible that ICM and stellar material are entrained and heated in the broader section of the jets which extends from the corona out to the lobes. Since the velocity of the jet is expected to be lower, and the broader jet is likely to entrain more material, it is possible that the heating could be mild, producing a separate high temperature thermal component rather than adding to the jet material. However, if the lobes are in equilibrium, the maximum energy involved in heating entrained gas is that required to achieve pressure equilibrium in the volume filled by jet material. Assuming =0.25, this is erg, a significant fraction of the mechanical energy of the jet.
A final consideration is the effect of material entrained within the jet on the relativistic particle population. Coulomb losses due to collisions with thermal electrons could be important for particles with low factors, if the two plasmas are not segregated. Sarazin (1999) estimates the loss rate to be
| (7) |
The instantaneous loss timescale then gives an approximate timescale over which particles will lose their energy via Coulomb interactions. Figure 9 shows the relationship between loss timescale and density for particles of different factor.

From the estimated mass of gas lost from stars in the kpc–scale jets, we can estimate the maximum density of thermal plasma within the jets in this region. Taking a lower limit on the jet velocity from the large–scale expansion speed of the radio source (0.002, GVM08), we estimate a maximum density of . This suggests that Coulomb losses could be significant for particles with but that more energetic particles will not lose a significant amount of energy. If stellar mass loss is the only source of entrained material, losses in the lobes will be even smaller, as the greater mass of gas occupies a much larger volume.
However, it is clear that if the entrained material is significantly denser, Coulomb losses will rapidly become important. If densities occur along much of the jet, we would expect significant energy losses from particles with . In this case the entrained and heated gas would have to provide the necessary additional pressure, since the contribution from low– relativistic particles would be removed.
We can rule out the most extreme case, entrainment of unheated (or only mildly heated) ICM plasma by the jets. For the observed ICM densities, Coulomb losses would affect particles radiating at radio frequencies, and would produce a clear change in the radio spectrum. This could only be avoided if the thermal plasma were segregated from the relativistic particles, with the thermal plasma entrained in non-interacting clumps.
In summary, the lack of clearly detected cavities and the clumpy, filamentary appearance of the radio lobes suggest that the lobes are regions of mixing between the relativistic jet plasma and the ICM. Our best estimate of the filling factor is =0.2-0.25. This naturally leads to a reduction in estimates of the energy in non-radiating particles. If the energy distribution of the electron population follows the measured powerlaw to , then no additional components are required to bring the radio plasma into pressure equilibrium with its surroundings, albeit with large uncertainties. Alternatively, additional material could be entrained by the jets, probably without producing detectable extra emission components. However, heating such material to the temperatures required to produce pressure equilibrium would require a significant fraction of the total energy of the jets. Coulomb interactions between entrained material and the relativistic plasma of the jet could also be important, and while material from stars within the kpc–scale jets is unlikely to significantly affect the particle population, entrainment of larger quantities of gas from the ICM could cause the loss of the lowest electrons, and any contribution toward the pressure support of the lobes they provide.
6.5 Energetics of the radio source
To obtain a first approximation of the maximum mechanical energy output of 4C+24.36, we can assume that the radio lobes have in fact excavated cavities in the ICM, and estimate the power required. The enthalpy in a cavity is given by , where is the ratio of specific heats (5/3 for a non-relativistic gas, 4/3 for relativistic gas). Assuming the cavities to be completely filled with relativistic synchrotron-emitting plasma, the mechanical energy required is . Assuming the projected distances of the lobes and using the ellipsoidal regions described in Section 3 (and shown in outline in Figure 2), we estimate this to be 1.63 erg. Taking the age estimate of 170 Myr from radio spectral modelling, the power output of the AGN would be 3.04. The bolometric X–ray luminosity of the ICM within a sphere with radius equal to the outer radius of the western lobe is , neglecting the contribution from the corona.
At first glance, the similarity between the energy available from the AGN and the radiative energy loss suggests a balance between heating and cooling. OS05 discussed the possibility that AWM 4 may at one time have possessed a large cool core comparable to those observed in clusters of similar temperature and galaxy population. The estimated that heating such a cool core to the present typical temperature of 2.6 keV would require roughly 9 erg. At best only about half of the AGN energy input would be available to heat the gas after radiative losses, but over the lifetime of the outburst, the total energy available is erg, a close match to energy required.
This simple calculation may underestimate the energy supplied by the AGN. The timescale of activity could be shorter, implying a greater power output for the same total energy and smaller fractional losses from radiative cooling. For a timescale of 135 Myr, similar to the buoyant rise time of the west lobe, the power of the jets would be .
As discussed above, there is also the possibility that the jets may have driven shocks into the surrounding ICM during earlier phases of the outburst. Despite the difficulty of observing such shocks, owing to the short period between their formation and their progression to the low density outer regions of the cluster halo, several examples have been confirmed (e.g., Gitti et al., 2010; Graham et al., 2008; Forman et al., 2007; McNamara et al., 2005; Nulsen et al., 2005). These tend to be weak shocks with Mach numbers , but may transfer considerable amounts of energy into the ICM. The shocks in the Perseus and Virgo clusters involve considerably more energy than the radio lobe cavities in those systems, suggesting that shocks are the dominant mechanism of energy injection (Forman et al., 2005), and simulations of jet/ICM interactions show that multiple shocks may be produced during a single nuclear activity cycle (Brüggen et al., 2007). It is therefore plausible that shocks have contributed to the heating of the ICM in AWM 4 at some stage, though none are currently detected.
However, it seems more likely that our calculation overestimates the energy input from the AGN. As discussed in Section 6.3, the lobes are probably partially filled by relativistic plasma, implying that we have overestimated the cavity volume. To examine the effect of the filling factors calculated in section 6.3, we consider the lower estimate of filling factor and the upper limit of . These imply enthalpies of 3.4 erg ( erg) and mechanical jet powers of 0.64 (), assuming a simple scaling with total volume. This suggests that the energy available from the radio source is just sufficient to balance cooling, unless some other mechanism for energy injection (e.g., shock heating) plays a significant role.
6.6 Non-thermal X-ray emission from the radio lobes
An alternative reason for the lack of clear cavities could be the presence of non-thermal X–ray emission from the radio lobes, which would “fill in” some or all of the cavity surface brightness decrement. This motivates us to determine the limits of any inverse-Compton component.
Of the two sources of seed photons available, the energy density of radio-frequency synchrotron photons produced in the lobes is a factor lower than that of cosmic microwave background (CMB) photons, and we therefore neglect synchrotron self–Compton scattering. We can estimate the expected X–ray flux from inverse–Compton scattering of CMB photons from the radio spectral properties, under the assumption of equipartition. We can determine which electrons are involved in scattering from the relation between the change in photon energy and the Lorentz factor of the electrons, , where and are the frequencies of the scattered X-ray photon and the pre-scattering CMB photon, and is the Lorentz factor of the scattering electron. To scatter a photon at the peak frequency of the CMB, 160 GHz, up to an energy of 1 keV, an electron with is required ( for 0.1 keV, 2800 for 7 keV). This is within the range of Lorentz factors used in our equipartition calculations.
Erlund et al. (2006) provide an estimate of the approximate inverse–Compton (IC) luminosity in a given energy band, under the simplifying assumption of a monochromatic distribution of CMB photons:
| (8) |
where is the spectral index determined from the radio data, is the Thompson scattering cross-section, is the speed of light, =, the energy density of the cosmic microwave background, and and are the lower and upper frequency bounds of the chosen energy range. The energy distribution of the electron population is assumed to be a power law, described by:
| (9) |
where E is the energy of the electron population between Lorentz factors and , is the normalisation of the power-law, is the electron mass, and is the index of the power law, related to the spectral index of the radio emission and photon index of the X-ray emission by .
Under the assumption of equipartition, the energy of the electron population in the lobes can be determined from modelling of the radio spectral distribution. Table 6 lists the relevant radio parameters and resulting flux estimates. We use the injection spectral index, as this is probably a more accurate estimate of the index at low values of . We note that the energy in the relativistic particle population, , is calculated assuming that electrons and positrons each contribute 50 per cent of the energy. The expected FX is therefore an upper limit; for an electron/proton plasma the predicted flux will decrease by 50 per cent, and if a larger fraction of the jet energy is in heavy particles the flux will be further decreased.
| East lobe | West lobe | |
|---|---|---|
| 1.01 | 1.01 | |
| (1057 erg) | 2.088 | 2.021 |
| expected FX (, 0.7-7 keV) | 1.38 | 1.33 |
| measured FX (, 0.7-7 keV) | 8.21 | 4.62 |
In order to place limits on the actual IC flux in the lobes, we extract X–ray spectra from each lobe and three annular bins extending from the lobes out to our limiting radius of 395′′, and use a deprojection to model the contribution of gas along the line of sight to the lobes. The thermal emission is again modelled with an APEC plasma model, and we add a powerlaw model with fixed photon index to account for the IC emission. Comparing fits with and without the predicted levels of IC emission we find no significant differences in spectral parameters. The expected fluxes are a factor 10-3-10-4 of the measured total flux, and the photon indices of 2 produce a similar spectral shape to the observed 2.6 keV plasma spectrum. Allowing the normalisation of the power-law component to fit freely, we find that the flux is consistent with the predicted values and with zero, within 90 per cent uncertainties. The upper bounds on the IC flux are shown in table 6. Even assuming these maximum IC fluxes to be correct, the parameters of the plasma model are largely unaffected. We therefore conclude that non-thermal emission is not detected from the lobes of 4C+24.36, and cannot be responsible for the lack of distinct X-ray cavities associated with the lobes.
6.7 Bending of the jets along the line of sight
A final factor which could reduce the expected surface brightness decrement of cavities is bending of the jets. Bending would place the lobes at greater radii, where the density of the ICM is lower, reducing the pressure difference. While GVM08 note that both the small scale jet/counter-jet brightness ratio and the symmetry of jet properties on large scales suggest the radio source is aligned close to the plane of the sky, this does not preclude some bending of the jets along the line of sight.
If we assume that the lobes rise buoyantly and the radiative age estimate of 170 Myr is correct, we expect the lobe will rise to a distance at which kpc-4. Using the gravitational mass profile of OS05, we find that this occurs at kpc, compared to projected distances of 53 kpc for the east lobe and 67 kpc for the west lobe. The thermal pressure at this radius is , still a factor 10 greater than the synchrotron pressure in the lobes. This would suggest that bending could contribute 20% of the apparent imbalance in the west lobe and 35 per cent of the imbalance in the east lobe. Larger contributions imply higher velocities and pressure balance cannot be achieved within the radiative timescale as this would require spersonic motion.
If the jets are bent in the line of sight, NGC 6051 must be in motion relative to the surrounding ICM. A true radius for the lobes of 77 kpc suggests a galaxy velocity of 316 of which 218 would be along the line of sight. However, optical measurements show NGC 6051 to have a velocity identical (within uncertainties) to the mean velocity of the cluster galaxy population (Koranyi & Geller, 2002). The uncertainties on these measurements are small enough that a velocity offset of the magnitude required appears unlikely. The large difference in luminosity (and hence mass) between NGC 6051 and the other cluster galaxies, and lack of apparent substructure in the cluster also argues against recent interactions which could have produced such a velocity offset. We therefore conclude that NGC 6051 probably has only a small velocity along the line of sight, relative to the cluster, and that bending makes only a small contribution to the apparent pressure imbalance.
7 Discussion
The analysis described above provides solutions to a number of the outstanding questions raised by previous observations of AWM 4, and helps provide a more coherent context for the cluster among other systems with powerful central AGN. However, a number of issues remain unresolved.
While there are a number of weak features suggesting that the radio source 4C+24.36 is interacting with the ICM, few are statistically significant even in this relatively deep Chandra pointing. The lack of strong cavities associated with the radio lobes suggests that relativistic plasma only partially fills these volumes, mixing with ICM gas which may occupy as much as 80 per cent of the lobe volume. Radio imaging suggests that the relativistic component is clumpy and filamentary, suggesting that mixing has occurred at the level of clouds rather than on microscopic scales.
This evidence of mixing, and the lack of clear cavities raises the question of why such a process should be observed in AWM 4 but not in other systems. Any such discussion is necessarily speculative. However, one important factor is the age of the AGN outburst. We estimate the synchrotron timescale of the radio lobes to be 170 Myr, compared to the few tens of Myr considered typical for FR-I radio galaxies (Mack et al., 1998). Dynamical age estimates for sources with detected ICM cavities are similar (Dunn et al., 2005; Bîrzan et al., 2008). These estimates may favour younger, more powerful radio galaxies whose lobes radiate more power at high frequencies and which can excavate larger cavities in denser environments. However, even our shortest synchrotron age estimate, 66 Myr, is long in comparison, and an age of 170 Myr would be fairly unusual. It may be that over such timescales, energy losses from the relativistic plasma are sufficient for the confinement of the plasma to weaken, allowing mixing to begin. This seems most likely to occur if entrainment slows the jet velocity by a large factor.
The lack of clear cavities is only apparent in AWM 4 because of the availability of both a deep X–ray observation and low-frequency radio data. Most studies of cavities have used radio observations at frequencies 1 GHz, and have identified many instances of ghost cavities, X-ray strcutures with no radio counterpart. Using lower radio frequencies extends the timescale over which the radio component remains visible, and this may be allowing us to observe systems which have aged to the point where the cavities break up. However, deep X–ray observations are also needed, so that even at large radii, where the expected surface brightness contrast is small, we can be certain that the cavity is weaker than expected.
There is some evidence of similar “missing” cavities in other systems. One example is HCG 62, in which low-frequency radio observations reveal emission extending beyond the cavities detected in the X–ray (Gitti et al., 2010). This suggests the presence of a set of old, outer radio lobes for which no cavities are detected. There is also the possible ‘ancient’ bubble in the Perseus cluster (Dunn et al., 2006) which is observed only as a temperature structure, with no known radio or X–ray surface brightness counterpart. The age of this bubble is estimated as 100 Myr, comparable to that of the AWM 4 radio lobes. However, both these cases differ from AWM 4 in that they appear to be related to old AGN outbursts, rather than to ongoing activity. Further investigation is needed to resolve these issues, particularly since it seems likely that an increasing number of similar cases will be observed as low–frequency radio observations become more common.
The question of whether mixing occurs only in the lobes or begins through entrainment of unheated material in the jets remains unresolved. 4C+24.36 has a classic FR-I morphology, with narrow (unresolved) jets in the central few kpc, broadening rapidly to a width of several kpc over most of their length, with relatively diffuse lobes and no hot spots. Such jet broadening is thought to occur because of entrainment of gas within the jets, leading to a rapid decline of jet velocity (e.g. Worrall, 2009). Slowing of the jets may also lead to instabilities which could explain the “wiggles” in the jets, as discussed by GVM08. Our estimated values of could be explained if external gas has been entrained and heated by the jets. The large uncertainties mean that we cannot be certain that entrainment is required, and entrained heated gas is likely not detectable without very deep hard X–ray observations. Abundance mapping does provide evidence of gas motions along the jet axis (O’Sullivan et al., 2010), but it is unknown whether the enriched material is inside the jets or drawn out alongside them by buoyantly rising lobes (Churazov et al., 2000).
The jets and lobes of cluster central radio galaxies are commonly found to be out of pressure equilibrium with the ICM (e.g., Dunn & Fabian, 2004; Dunn et al., 2005; Bîrzan et al., 2008; Croston et al., 2008). The range of pressure differences is extreme, with pressure ratios of one to several thousand, and the cause of these differences is currently the subject of debate. This is generally cast in terms of the parameter, as higher apparent pressure imbalances imply a need for a greater ratio of total energy to measured energy in the electron population.
Examination of cavities and radio bubbles in the Perseus and Centaurus cluster shows that their values increase with the radius of the cavity from the cluster core, and therefore its age (Dunn et al., 2005), and this correlation is seen in a small sample of radio sources in galaxy groups (Croston et al., 2008). A correlation is also found between and the synchrotron age of cluster radio galaxies, determined from the break frequency of their radio spectra (Bîrzan et al., 2008). These findings can be interpreted as supporting spectral aging as the cause of the imbalance, with a larger fraction of the particle population of older sources falling to lower energies and radiating at lower frequencies.
Alternatively, entrainment of additional non–radiating articles within the jets may provide the additional pressure. Dunn et al. (2006) argue M87 and NGC 1275 have electron–positron jets on small scales near the AGN, but lobes with high values which require the presence of protons (or more exotic jet models), which must therefore be acquired through entrainment. Croston et al. (2008) show that the apparent pressure imbalance is linked to morphology, with “plumed” FR-I sources (in which much of the lobe is beyond the end of the collimated jets) have greater imbalances. As “plumed” sources have a greater surface area in contact with the ICM, they interpret the difference in pressure as arising from a greater degree of entrainment. This result is strengthened by the choice of Croston et al. (2008) to assume a minimum particle energy of =10, thereby including an estimate of the additional energy available from low–energy particles and hopefully reducing the influence of spectral aging. On the other hand, the characterisation of structures in the X–ray observations of the systems is hampered by the low X–ray surface brightness of the systems, and estimation of the filling factor from the X–ray data is not possible.
Our observations of AWM 4 are well suited to a study of the pressure imbalance and particle content of the radio lobes. We have high–quality radio data extending to low frequencies which allow us to place relatively strong constraints on the synchrotron pressure and age, and make measurements in multiple regions. We are able to place some constraints on the filling factors of the lobes, for a source where . Our source is also old and therefore near–certain to be in equilibrium with its environment.
It is clear that the choice of energy range over which we assume the particle population to follow a power law distribution has a dramatic effect on our estimates of pressure and . Taking the standard range of 10 MHz-100 GHz, we find low synchrotron pressures, high values of , and therefore a requirement for entrained material. The associated radiative ages of the lobes are approximately twice the longest dynamical timescales. It therefore seems likely that the energy of the electron population is underestimated, and the minimum energy cutoff at 10 MHz is too high.
Using the revised equipartition conditions and =100 reduces the pressure imbalance and the required value of considerably, but does not reach equilibrium. Our best estimate of the synchrotron timescale under these conditions (170 Myr, see Table 5) is rather longer than the buoyant and refill timescales. However, the low filling factor of the lobes may bring these timescales into agreement. If we lower the minimum energy to =10, pressure equilibrium in the lobes can be achieved, with values consistent with minimal (or no) entrainment of external material. However, this may imply a radiative age for the lobes short enough that purely buoyant expansion of the source is ruled out and supersonic expansion over some part of its lifetime is required. This is not physically unreasonable, and may be desirable for energetic reasons.
We conclude from these results that a large fraction of the apparent pressure imbalance is due to spectral aging and that inclusion of low–energy particles by extension to lower values of produces more realistic results. We are then left with the question of whether we consider the shorter timescales associated with =10 to be likely.
The relatively flat pressure profile of the jets and lobes (calculated for =100) suggests that entrainment from the ICM is not effective over most of the length of the jet. In this case, if entrained material does contribute to it must enter the jet close to its source, on scales too small for us to examine. This could suggest that entrainment and heating of external material is only effective while the jet is collimated and has a high velocity, in its first few kpc in the core of NGC 6051. This makes supersonic expansion of the jets on scales of tens of kiloparsecs less likely, and argues for outburst timescales comparable to the buoyant rise time and higher values of . This is certainly the more conservative solution.
We can also consider the thermal state of the ICM. Our estimate of the total enthalpy of the radio lobes suggests that it is insufficient to reheat a large cool core comparable to that in MKW 4. However, a smaller core would require less energy, and additional energy may be available from shocks or other forms of heating. Using our best estimate of the outburst timescale, 170 Myr, the mechanical energy of the jets is comparable to or slightly less than the rate of energy loss through radiative cooling. This could indicate that heating was greater at earlier times, or that a shorter outburst timescale is required. For the 66 Myr timescale associated with =10, the observed filling factors would be more than sufficient to balance radiative losses from the ICM, and the supersonically expanding jets would certainly drive shocks.
As discussed at the beginning of this Section, under either scenario the AGN outburst has a relatively long lifespan. The presence of a corona in NGC 6051 may provide some explanation. This small volume of cool gas appears capable of fuelling the AGN outburst, replenished by stellar mass losses. As the conduction of heat from the surrounding ICM is suppressed, the corona is likely magnetically separate from its environment. This implies a breakdown of the ICM–AGN feedback loop, since gas cooling from the ICM cannot reach the central engine, and the AGN jets do not heat the corona significantly. If this is the case, the AGN outburst is not self-limiting and could continue indefinitely.
The origin of the corona is unclear. Sun (2009) suggests that powerful radio AGN may destroy large cool cores in galaxy group scale systems, leaving only the corona in the central galaxy. The size of the corona may then be determined by the radius at which the radio jets broaden and begin to interact with the ICM, or might itself be the cause of this broadening, with the jets losing collimation as they cross the strong density gradient (or possibly magnetic field) at its boundary. Associations between jet broadening and changes in density have been found in other corona-type systems (e.g., Sun et al. 2005a;b).
In the first case the origin of the magnetic separation between corona and ICM is unclear unless conduction was suppressed throughout the pre-existing cool core. Strong suppression of conduction is expected in cool cores owing to the heat-flux-driven buoyancy instability (HBI, Parrish & Quataert, 2008). This suggests that where magnetic fields are aligned radially along the temperature gradient of a cool core, convection will lead to gas motions which cause the magnetic field to be realigned tangentially, reducing conduction by large factors. It is unclear what the timescale for the saturation of the instability would be in a relatively poor, low-temperature system such as AWM 4 (the timescale for 5 keV clusters is estimated to be 120 Myr, Parrish et al., 2009), but HBI provides a potentially feasible mechanism.
The corona could also represent the original galaxy halo of NGC 6051, compressed and/or stripped by the surrounding cluster gas, with the galactic magnetic field maintaining separation from the ICM even before the AGN outburst. The temperature of the material outside the corona prior to the outburst cannot be known in this scenario. In both cases, the separation between corona and ICM suggests that metals released from stars within the corona cannot easily diffuse outwards, and that any enrichment must be driven by losses from the stellar population outside the corona.
There is also the possibility that the corona has been stable over a timescale considerably longer than the current AGN outburst, and that AWM 4 has been relatively isothermal for a long period. If the corona is a stable feature, it is difficult to predict the AGN duty cycle, since ICM cooling would not be the driving force in triggering activity. The merger of another galaxy with NGC 6051 might disrupt the corona, but as NGC 6051 is much larger than any other cluster member galaxy and appears undisturbed, it seems unlikely that a merger has occurred for at least 1 Gyr. For radiative cooling in the ICM to be balanced by energy injection from the AGN without a feedback mechanism linking the two would be highly coincidental. As the roughly isothermal temperatures demonstrate that the AGN is providing at least enough energy to prevent cooling, we would expect that its energy output over the long–term would exceed radiative losses, and that no cool core has been able to develop. The relatively steep rise in gas fraction at 75 kpc radius reported by OS05 could be an indication that strong heating has moved ICM gas out of the cluster core.
A final consideration is the motion of NGC 6051 within the cluster. Both the X-ray morphology and the bending of the radio jets suggest that the galaxy is moving south relative to the ICM, and the difference in size between the east and west jets suggests that there may be an eastward component to the motion. The galaxy population of the cluster is primarily aligned on a north-south axis (Koranyi & Geller, 2002) as is the ICM, so motion in this direction is perhaps unsurprising. Movement of NGC 6051 relative to the ICM may act to spread the energy released by the AGN more evenly through the cluster core, and aid in mixing enriched gas outward from the galaxy.
8 Conclusions
We have used a deep, 75 ks Chandra observation of the poor cluster AWM 4 to examine its structure and properties, and the relationship between the central radio galaxy and the ICM. Previous studies of AWM 4 found the cluster to have a number of unusual and conflicting features. GMRT observations showed that its dominant galaxy hosts an old, active FR-I radio galaxy, but XMM-Newton found no evidence of cooling in the cluster core to fuel this AGN. Conversely, heating a cool core to produce the approximately isothermal 2.6 keV ICM observed required more energy than was estimated to be available from the radio source. Our analysis provides solutions to some of these problems, as well as insights which may be applicable to other clusters and cluster central radio sources. Our results can be summarised as follows:
-
1.
The Chandra observation reveals a small cool core located at the centre of NGC 6051 and coincident with the core radio source. This meets the criteria for a galactic corona (Sun et al., 2007; Sun, 2009). It is compact (radius 1-2 kpc), significantly cooler than the surrounding cluster halo (=1.0 keV compared to 2.6 keV for the ICM), and has a short cooling time (181 Myr) and moderate luminosity (L). Heat conduction at the Spitzer rate would be sufficient to heat the core to the temperature of the surrounding ICM in 10-20 Myr. This suggests that conduction is strongly suppressed. Similarly, a few percent of the mechanical energy of the radio jets would be sufficient to have heated the corona over the lifetime of the AGN outburst, and we conclude that any interaction between the jets and corona must be extremely inefficient. VLA 4.9 GHz radio maps do not resolve the jets inside the corona, suggesting that they are collimated and narrow, only broadening at its outer edge.
-
2.
We estimate the mass deposition rate through radiative cooling of the corona gas to be =0.067yr-1. This would be sufficient to power the AGN, requiring an efficiency in converting the cool gas to energy of only 0.1 per cent. Mass loss from stars within the corona appears sufficient to approximately balance cooling losses from the corona. Direct accretion from the 1 keV gas at the Bondi rate could fuel the AGN, though the accretion rate is rather uncertain owing to the large extrapolation in radius required. Magnetic separation of the corona from the ICM would prevent gas cooling from the ICM reaching the central engine, and the AGN jets do not significantly heat the corona. These factors appear to preclude a feedback relationship between AGN and ICM. However, the corona itself is capable of fuelling the AGN for long periods, and this may explain the unusually long outburst timescale estimated for the radio source. It may also explain the lack of a large cool core in the system, since without a feedback relationship, AGN heating seems likely to have exceeded cooling over the recent history of the cluster.
-
3.
Imaging shows the gaseous halo of AWM 4 to be generally relaxed, in agreement with previous observations. There are weak indications of structures associated with the radio source, including a broad bay-like structure around the west jet and lobe. However, the only statistically significant surface brightness feature is a decrement near the centre of the east lobe. There is no evidence of spectrally hard emission associated with the lobes, and the expected level of inverse Compton emission is below our detection threshold. If the lobes contained only relativistic plasma, we would expect to detect the cavities with high statistical significance. We interpret these results as indicating that the lobes are only partially filled. This is supported by the clumpy, filamentary appearance of the lobes in radio images. Based on the surface brightness, we can place limits on the fraction of ICM plasma in the lobes. Assuming the remaining volume is occupied by radio–emitting relativistic plasma, we find filling factors for this component of and for the east and west lobes respectively, with 3 upper limits of and .
-
4.
We measure the pressure profile of the ICM, and compare this with minimum energy pressure estimates for the jets and lobes of the radio source. Under the most conservative conditions, assuming contributions from particles emitting between 10 MHz and 100 GHz, we find a strong pressure imbalance between the lobes and their environment, with the lobes apparently underpressured by a factor 160. However, these conditions imply an age for the source which is considerably longer than the timescale for the lobes to buoyantly rise to their current position. Estimates which include less energetic particles greatly reduce the pressure imbalance, to a factor 15 for =100, or to a factor 4 for =10, with the latter case consistent with pressure equilibrium within uncertainties. The radiative age estimated for =100 is roughly consistent with the buoyant timescale of the lobes, while the age estimated for =10 is significantly shorter and could imply a supersonic expansion phase for the jets. We consider the effects of bending in the jets on our pressure estimates, but find that they are unlikely to have a significant impact on our results.
-
5.
From these measurements and the filling factor estimates described above, we estimate the required ratio of energy in non–radiating particles to the observed energy in electrons, , for each lobe. Assuming , we estimate =37.5 and 24.8 for the east and west lobes, with 3 upper limits of and respectively. For , we estimate =10.4 and =6.8 for the east and west lobes, with large uncertainties consistent with =1 (an electron–proton plasma) or =0 (an electron–positron plasma), or with the values. This indicates that in principle the apparent pressure imbalance in the lobes can be resolved by the inclusion of these lower energy relativistic particles. Alternatively, entrainment and heating of thermal plasma (either from stars or the ICM) could provide the necessary additional pressure. However, such entrained material must have a low density and very high temperature, rendering it undetectable with the current data.
-
6.
We estimate the enthalpy of the radio lobes and find that for the filling factors estimated above it is erg. This is lower than the estimated energy required to reheat a large cool core such as that seen MKW 4, a cluster of similar temperature and galaxy population. The mechanical power output of the jet depends on the timescale of the outburst; for our best estimate of 170 Myr the jet power is . This is lower than or comparable to the bolometric X–ray luminosity of the ICM within the radius of the lobes, , suggesting that in the absence of other forms of heating, the energy available from the radio lobes is at best just sufficient to balance cooling in the ICM.
However, the relative isothermality of the ICM and lack of any significant cooling region outside the corona strongly suggests that the AGN has provided enough energy to balance or exceed cooling losses in the past. This could be achieved through additional heating mechanisms (e.g., weak shocks, sound waves, cosmic rays), larger filling factors, or a shorter outburst timescale. If we instead assume the shorter radiative timescale (66 Myr) estimated from the spectra of the lobes and assuming =10, the jet mechanical power is 2.6, in excess of the cooling rate. This timescale would also require supersonic expansion of the jets, providing additional heating through weak shocks.
ACKNOWLEDGEMENTS
The authors thank M. Sun and P. Mazzotta for informative discussions, and
the anonymous referee for a number of useful suggestions. Support for this
work was provided by the National Aeronautics and Space Administration
through Chandra Award Number GO8-9127X-R issued by the Chandra X-ray
Observatory Center, which is operated by the Smithsonian Astrophysical
Observatory for and on behalf of the National Aeronautics Space
Administration under contract NAS8-03060. E. O’Sullivan acknowledges the
support of the European Community under the Marie Curie Research Training
Network. We thank the staff of the GMRT for their help during the
observations. GMRT is run by the National Centre for Radio Astrophysics of
the Tata Institute of fundamental Research. We acknowledge the usage of the
HyperLeda database (http://leda.univ-lyon1.fr).
References
- Allen et al. (2006) Allen S. W., Dunn R. J. H., Fabian A. C., Taylor G. B., Reynolds C. S., 2006, MNRAS, 372, 21
- Anders & Grevesse (1989) Anders E., Grevesse N., 1989, Geo. et Cosmo. Acta, 53, 197
- Athey et al. (2002) Athey A., Bregman J., Bregman J., Temi P., Sauvage M., 2002, ApJ, 571, 272
- Bîrzan et al. (2008) Bîrzan L., McNamara B. R., Nulsen P. E. J., Carilli C. L., Wise M. W., 2008, ApJ, 686, 859
- Bîrzan et al. (2004) Bîrzan L., Rafferty D. A., McNamara B. R., Wise M. W., Nulsen P. E. J., 2004, ApJ, 607, 800
- Blanton et al. (2009) Blanton E. L., Randall S. W., Douglass E. M., Sarazin C. L., Clarke T. E., McNamara B. R., 2009, ApJ, 697, L95
- Brüggen et al. (2007) Brüggen M., Heinz S., Roediger E., Ruszkowski M., Simionescu A., 2007, MNRAS, 380, L67
- Brunetti et al. (1997) Brunetti G., Setti G., Comastri A., 1997, A&A, 325, 898
- Buote & Fabian (1998) Buote D., Fabian A., 1998, MNRAS, 296, 977
- Churazov et al. (2001) Churazov E., Brüggen M., Kaiser C. R., Böhringer H., Forman W., 2001, ApJ, 554, 261
- Churazov et al. (2000) Churazov E., Forman W., Jones C., Böhringer H., 2000, A&A, 356, 788
- Cowie & McKee (1977) Cowie L. L., McKee C. F., 1977, ApJ, 211, 135
- Croston et al. (2008) Croston J. H., Hardcastle M. J., Birkinshaw M., Worrall D. M., Laing R. A., 2008, MNRAS, 386, 1709
- Dole et al. (2006) Dole H., Lagache G., Puget J., 2006, in L. Armus & W. T. Reach ed., Astronomical Society of the Pacific Conference Series Vol. 357 of Astronomical Society of the Pacific Conference Series, The Cosmic Infrared Background: Resolved, Unresolved and Spitzer Contributions. p. 290
- Dunn et al. (2010) Dunn R. J. H., Allen S. W., Taylor G. B., Shurkin K. F., Gentile G., Fabian A. C., Reynolds C. S., 2010, MNRAS, 404, 180
- Dunn & Fabian (2004) Dunn R. J. H., Fabian A. C., 2004, MNRAS, 355, 862
- Dunn et al. (2006) Dunn R. J. H., Fabian A. C., Celotti A., 2006, MNRAS, 372, 1741
- Dunn et al. (2006) Dunn R. J. H., Fabian A. C., Sanders J. S., 2006, MNRAS, 366, 758
- Dunn et al. (2005) Dunn R. J. H., Fabian A. C., Taylor G. B., 2005, MNRAS, 364, 1343
- Elbaz et al. (1999) Elbaz D., Cesarsky C., Aussel H., 1999, in A. J. Bunker & W. J. M. van Breugel ed., The Hy-Redshift Universe: Galaxy Formation and Evolution at High Redshift Vol. 193 of Astronomical Society of the Pacific Conference Series, The 15 m Extragalactic Background Light from ISOCAM galaxies. p. 254
- Erlund et al. (2006) Erlund M. C., Fabian A. C., Blundell K. M., Celotti A., Crawford C. S., 2006, MNRAS, 371, 29
- Fabian et al. (2002) Fabian A. C., Allen S. W., Crawford C. S., Johnstone R. M., Morris R. G., Sanders J. S., Schmidt R. W., 2002, MNRAS, 332, L50
- Fabian et al. (2005) Fabian A. C., Sanders J. S., Taylor G. B., Allen S. W., 2005, MNRAS, 360, L20
- Fabian et al. (2006) Fabian A. C., Sanders J. S., Taylor G. B., Allen S. W., Crawford C. S., Johnstone R. M., Iwasawa K., 2006, MNRAS, 366, 417
- Feretti et al. (1992) Feretti L., Perola G. C., Fanti R., 1992, A&A, 265, 9
- Forman et al. (2007) Forman W., Jones C., Churazov E., Markevitch M., Nulsen P., Vikhlinin A., Begelman M., Böhringer H., Eilek J., Heinz S., Kraft R., Owen F., Pahre M., 2007, ApJ, 665, 1057
- Forman et al. (2005) Forman W., Nulsen P., Heinz S., Owen F., Eilek J., Vikhlinin A., Markevitch M., Kraft R., Churazov E., Jones C., 2005, ApJ, 635, 894
- Gastaldello et al. (2008) Gastaldello F., Buote D. A., Brighenti F., Mathews W. G., 2008, ApJ, 673, L17
- Gebhardt et al. (2000) Gebhardt K., Bender R., Bower G., Dressler A., Faber S. M., Filippenko A. V., Green R., Grillmair C., Ho L. C., Kormendy J., Lauer T. R., Magorrian J., Pinkney J., Richstone D., Tremaine S., 2000, ApJ, 539, L13
- Giacintucci et al. (2008) Giacintucci S., Vrtilek J. M., Murgia M., Raychaudhury S., O’Sullivan E. J., Venturi T., David L. P., Mazzotta P., Clarke T. E., Athreya R. M., 2008, ApJ, 682, 186, GVM08
- Gitti et al. (2010) Gitti M., O’Sullivan E., Giacintucci S., David L. P., Vrtilek J., Raychaudhury S., Nulsen P. E. J., 2010, ApJ, 714, 758
- Govoni & Feretti (2004) Govoni F., Feretti L., 2004, International Journal of Modern Physics D, 13, 1549
- Graham et al. (2008) Graham J., Fabian A. C., Sanders J. S., 2008, MNRAS, pp 349–+
- Grevesse & Sauval (1998) Grevesse N., Sauval A. J., 1998, Space Sci. Rev., 85, 161
- Kaastra et al. (2004) Kaastra J. S., Tamura T., Peterson J. R., Bleeker J. A. M., Ferrigno C., Khan S. M., Paerels F. B. S., Piffaretti R., Branduardi-Raymont G., Böhringer H., 2004, A&A, 413, 415
- Kardashev (1962) Kardashev N. S., 1962, Soviet Astronomy, 6, 317
- Kim & Fabbiano (2004) Kim D., Fabbiano G., 2004, ApJ, 611, 846
- Koranyi & Geller (2002) Koranyi D. M., Geller M. J., 2002, AJ, 123, 100
- Kuntz & Snowden (2000) Kuntz K. D., Snowden S. L., 2000, ApJ, 543, 195
- Mack et al. (1998) Mack K.-H., Klein U., O’Dea C. P., Willis A. G., Saripalli L., 1998, A&A, 329, 431
- McNamara & Nulsen (2007) McNamara B. R., Nulsen P. E. J., 2007, ARA&A, 45, 117
- McNamara et al. (2005) McNamara B. R., Nulsen P. E. J., Wise M. W., Rafferty D. A., Carilli C., Sarazin C. L., Blanton E. L., 2005, Nature, 433, 45
- Morrison & McCammon (1983) Morrison R., McCammon D., 1983, ApJ, 270, 119
- Murgia (2001) Murgia M., 2001, PhD thesis, Universitá di Bologna
- Nulsen et al. (2005) Nulsen P. E. J., McNamara B. R., Wise M. W., David L. P., 2005, ApJ, 628, 629
- O’Sullivan et al. (2010) O’Sullivan E., Giacintucci S., Vrtilek L. P., David L. P., Raychaudhury S., 2010, MNRAS, in prep.
- O’Sullivan et al. (2007) O’Sullivan E., Vrtilek J. M., Harris D. E., Ponman T. J., 2007, ApJ, 658, 299
- O’Sullivan et al. (2005) O’Sullivan E., Vrtilek J. M., Kempner J. C., David L. P., Houck J. C., 2005, MNRAS, 357, 1134, OS05
- O’Sullivan et al. (2003) O’Sullivan E., Vrtilek J. M., Read A. M., David L. P., Ponman T. J., 2003, MNRAS, 346, 525
- Pacholczyk (1970) Pacholczyk A. G., 1970, Radio astrophysics. Nonthermal processes in galactic and extragalactic sources. Series of Books in Astronomy and Astrophysics, San Francisco: Freeman, 1970
- Parma et al. (1986) Parma P., de Ruiter H. R., Fanti C., Fanti R., 1986, A&AS, 64, 135
- Parrish & Quataert (2008) Parrish I. J., Quataert E., 2008, ApJ, 677, L9
- Parrish et al. (2009) Parrish I. J., Quataert E., Sharma P., 2009, ApJ, 703, 96
- Peterson & Fabian (2006) Peterson J. R., Fabian A. C., 2006, Phys. Rep., 427, 1
- Peterson et al. (2003) Peterson J. R., Kahn S. M., Paerels F. B. S., Kaastra J. S., Tamura T., Bleeker J. A. M., Ferrigno C., Jernigan J. G., 2003, ApJ, 590, 207
- Sanderson et al. (2006) Sanderson A. J. R., Ponman T. J., O’Sullivan E., 2006, MNRAS, 372, 1496
- Sarazin (1999) Sarazin C. L., 1999, ApJ, 520, 529
- Sazonov et al. (2006) Sazonov S., Revnivtsev M., Gilfanov M., Churazov E., Sunyaev R., 2006, A&A, 450, 117
- Schombert (1987) Schombert J. M., 1987, ApJS, 64, 643
- Skrutskie et al. (2006) Skrutskie M. F., Cutri R. M., Stiening R., Weinberg M. D., Schneider S., Carpenter J. M., Beichman C., Capps R., Chester T., Elias J., Huchra J., Liebert J., Lonsdale C., Monet D. G., Price S. e. a., 2006, AJ, 131, 1163
- Smith et al. (2001) Smith R. K., Brickhouse N. S., Liedahl D. A., Raymond J. C., 2001, ApJ, 556, L91
- Snowden et al. (2004) Snowden S. L., Collier M. R., Kuntz K. D., 2004, ApJ, 610, 1182
- Spitzer (1962) Spitzer L., 1962, Physics of Fully Ionized Gases. Physics of Fully Ionized Gases, New York: Interscience (2nd edition), 1962
- Sun (2009) Sun M., 2009, ApJ, 704, 1586
- Sun et al. (2005) Sun M., Jerius D., Jones C., 2005, ApJ, 633, 165
- Sun et al. (2007) Sun M., Jones C., Forman W., Vikhlinin A., Donahue M., Voit M., 2007, ApJ, 657, 197
- Sun et al. (2005) Sun M., Vikhlinin A., Forman W., Jones C., Murray S. S., 2005, ApJ, 619, 169
- Weisskopf et al. (2002) Weisskopf M. C., Brinkman B., Canizares C., Garmire G., Murray S., Van Speybroeck L. P., 2002, PASP, 114, 1
- Wise et al. (2007) Wise M. W., McNamara B. R., Nulsen P. E. J., Houck J. C., David L. P., 2007, ApJ, 659, 1153
- Worrall (2009) Worrall D. M., 2009, ARA&A, 17, 1