Witnessing the Birth of a Quasar
Abstract
The coalescence of a supermassive black hole binary (SMBHB) is thought to be accompanied by an electromagnetic (EM) afterglow, produced by the viscous infall of the surrounding circumbinary gas disk after the merger. It has been proposed that once the merger has been detected in gravitational waves (GWs) by the Laser Interferometer Space Antennae (LISA), follow-up EM observations can search for this afterglow and thus help identify the EM counterpart of the LISA source. Here we study whether the afterglows may be sufficiently bright and numerous to be detectable in EM surveys alone. The viscous afterglow is characterized by an initially rapid increase in both the bolometric luminosity and in the spectral hardness of the source. For binaries with a total mass of , this phase can last for years to decades, and if quasar activity is triggered by the same major galaxy mergers that produce SMBHBs, then it could be interpreted as the birth of a quasar. Using an idealized model for the post-merger viscous spreading of the circumbinary disk and the resulting light curve, and using the observed luminosity function of quasars as a proxy for the SMBHB merger rate, we delineate the survey requirements for identifying such birthing quasars. If circumbinary disks have a high disk surface density and viscosity, an all-sky soft X-ray survey with a sensitivity of which maps the full sky at least once per several months, could identify a few dozen birthing quasars with a brightening rate maintained for at least several years. If of the X-ray emission is reprocessed into optical frequencies, several dozen birthing quasars could also be identified in optical transient surveys, such as the Large Synoptic Survey Telescope. Distinguishing a birthing quasar from other variable sources may be facilitated by the monotonic hardening of its spectrum, but will likely remain challenging. This reinforces the notion that observational strategies based on joint EM-plus-GW measurements offer the best prospects for the successful identification of the EM signatures of SMBHB mergers.
1 Introduction
Observational evidence robustly indicates that all or nearly all galaxies harbor a supermassive black hole in their nucleus (SMBH; e.g., Magorrian et al., 1998). Since cosmological structure formation models predict a hierarchy of galaxy mergers, if nuclear SMBHs were indeed common at earlier times, then these mergers should result in the formation of SMBH binaries (SMBHBs; Begelman et al., 1980), and these binaries should then be common throughout cosmic time (Haehnelt, 1994; Menou et al., 2001; Volonteri et al., 2003; Wyithe & Loeb, 2003; Sesana et al., 2007b; Lippai et al., 2009; Tanaka & Haiman, 2009).
It has also long been known, both observationally (e.g., Sanders et al. 1988) and theoretically (e.g., Barnes & Hernquist 1991) that galaxy mergers can drive gas to the nucleus of the merger remnant, which could facilitate the merger of the nuclear SMBHs on one hand, while also providing fuel for quasar activity on the other. Mergers are therefore generically also believed to trigger quasar activity; the rate of major galaxy mergers can indeed provide an explanation for the observed evolution of the quasar population as a whole (Carlberg 1990; for more recent work, see, e.g., Hopkins et al. 2007a and Wyithe & Loeb 2009 and references therein).
Despite their expected ubiquity, observational evidence for SMBHBs is scarce, and the precise timing of any quasar activity, and when it occurs relative to the merger of the nuclear SMBH binary, remains unclear (Kocsis et al., 2006). A handful of pairs of active SMBHs in the same galaxy have been resolved directly, at kpc separation in X–ray (Komossa et al., 2003) and optical (Comerford et al., 2009) images, and at 10pc separation in the radio (Rodriguez et al., 2006), confirming that gas is present around the SMBH binary, and that quasar activity can, at least in some systems, commence prior to their coalescence. However, there has been at least one suggestion that luminous activity can be occurring later, at the time of the merger, as well – momentarily interrupted by the coalescence of the SMBHs and reactivated after-wards (Liu et al., 2003b). While there are many more observed SMBHB candidates with small separations (e.g., Roos et al., 1993; Schoenmakers et al., 2000; Merritt & Ekers, 2002; Sudou et al., 2003; Liu, 2004; Boroson & Lauer, 2009), the evidence for these tighter binaries is indirect, and each candidate system has alternative explanations. The expectation is that at large separations, the binaries rapidly lose orbital angular momentum through dynamical friction with background stars and through tidal–viscous interaction with the surrounding gas (Ivanov et al., 1999; Armitage & Natarajan, 2002; Escala et al., 2005; Merritt & Milosavljević, 2005; Dotti et al., 2007; Sesana et al., 2007a; Cuadra et al., 2009; Callegari et al., 2009; Colpi et al., 2009; Haiman et al., 2009; Chang et al., 2010). Once sufficiently compact, gravitational wave (GW) emission rapidly shrinks the orbit, culminating in a merger. How long this process lasts, and at what stage(s) the SMBHs light up as luminous quasars, is, however, also poorly understood theoretically.
Apart from the cosmological context, interest in EM signatures of SMBH mergers surged recently (e.g., Milosavljević & Phinney, 2005; Bode & Phinney, 2007; Lippai et al., 2008; Schnittman & Krolik, 2008; Shields & Bonning, 2008; O’Neill et al., 2009; Chang et al., 2010; Megevand et al., 2009; Corrales et al., 2010; Rossi et al., 2010; Anderson et al., 2010; Krolik, 2010; Tanaka & Menou, 2010; Shapiro, 2010), driven by (i) the prospect that the Laser Interferometer Space Antennae222http://lisa.nasa.gov/ (LISA) will detect the mergers in GWs and provide a tractable list of (perhaps as low as a few hundred; e.g., Kocsis et al. 2008) EM candidates for SMBHBs and (ii) the breakthrough in numerical general relativistic calculations of BH mergers (e.g., Pretorius 2005; Campanelli et al. 2006; Baker et al. 2006), which led to robust predictions of significant mass–loss and recoil that can significantly perturb the ambient gas. A simultaneous observation of the merger in gravitational and EM waves would enable new scientific investigations in cosmology and BH accretion physics (Cutler, 1998; Holz & Hughes, 2005; Kocsis et al., 2006, 2007; Lang & Hughes, 2008; Phinney, 2009; Bloom et al., 2009).
In this paper, we focus on one particular signature of SMBHB coalescence, which we will hereafter refer to as the “viscous afterglow”. The physics of this model was discussed by Liu et al. (2003b) in the context of the interruption of jets in double-double radio galaxies, and later by Milosavljević & Phinney (2005; hereafter MP05) in the context of EM counterparts of LISA sources. Prior to merger, the SMBHB torques open and maintain a cavity in the center of a thin circumbinary gas disk (Artymowicz & Lubow, 1994). When the binary becomes sufficiently compact, GW emission causes the binary orbit to shrink faster than the gas just outside the cavity can viscously respond. The merger takes place inside the cavity, which is subsequently filled as the disk viscously spreads inward. Because the refilling inner disk produces higher-energy photons than the outer regions, the disk is predicted to transition from an X-ray-dim state to an X-ray-bright one, with its bolometric luminosity increasing by a factor of during this time. This transition is expected to take place on humanly tractable timescales, with the cavity filling in , where is the total mass of the binary. A study of an optically selected sample by Gibson et al. (2008) found X-ray-dim AGN to be rare ( at ), suggesting that it would be tractable to catalog and monitor such systems for possible observational signatures of a merger afterglow.
In the observational scenario originally proposed by MP05, LISA would detect the GWs from the merger and determine its approximate location in the sky to within deg, triggering a follow–up search to identify the EM counterpart and host galaxy. A natural question to ask, however – and the subject of the present paper – is whether the viscous afterglows may be sufficiently bright and numerous to be detectable in EM surveys alone, even before LISA is launched. The identification of mergers by their EM signatures alone could, in fact, be valuable for several reasons. First, LISA will be sensitive to GWs from relatively low–mass SMBHBs, with total masses of . EM studies could, in principle, detect coalescing SMBHBs outside this mass range, and therefore complement the LISA binary population. Second, while many models for the cosmological evolution of SMBHs predict that LISA will detect dozens or hundreds of mergers (if “seed” black holes are abundant and merge often; e.g., Sesana et al. 2007b), there are some SMBH assembly scenarios that may result in far fewer LISA events (i.e. if seeds are rare and grow primarily through rapid accretion or are very massive already at formation; Tanaka & Haiman 2009; Lippai et al. 2009). It is therefore plausible that EM surveys could deliver a larger SMBH binary sample than available from GWs. Third, several transient EM surveys are already under way, or are planned to be completed before the expected launch date of the LISA mission around 2020.
If luminous quasar activity is triggered by major mergers of galaxies, as argued above, then the viscous afterglow could plausibly be interpreted as the signature of the birth of a quasar. In this paper, we estimate the number of identifiable afterglow sources, i.e. birthing quasars, in the sky, by (i) adopting an idealized time-dependent model (Tanaka & Menou, 2010, hereafter TM10) of the evolution of the disk structure, to calculate photometric light curve and variability of the afterglow, and (ii) by using the observed luminosity function of quasars as a proxy for the SMBHB merger rate. Our two main goals are:
-
1.
To assess whether there is any hope of detecting and identifying the viscous afterglows with conventional EM telescopes alone.
-
2.
To see how the identifiability of the afterglows depends on theoretical parameters and to delineate the ideal survey attributes (wavelength, angular coverage and depth). We compare the derived attributes to those similar to planned large surveys of the transient sky: a soft-X-ray survey with specs similar to those that were proposed recently, unsuccessfully, for the the Lobster-Eye Wide-Field X-ray Telescope 333http://www.star.le.ac.uk/lwft/ (LWFT) mission; and the Large Synoptic Survey Telescope444http://www.lsst.org/lsst (LSST) in the optical.
We find that the detectability of the afterglow is sensitive to the properties of the circumbinary disk, in particular to the ratio of the viscous stress to the gas pressure, and to the surface density of the disk. We conclude that purely EM identification of the afterglows by the planned surveys are unlikely, unless the surface density and the viscosity in the circumbinary disk are at the high end of the expected range. In this latter, optimistic scenario, several dozen birthing quasars could be identified in a soft X-ray transient survey. We also find that if of the X-ray radiation emitted in the central regions is reprocessed into the optical frequencies by dust surrounding the source, or by warps or geometric splaying in the disk itself (TM10), several dozen afterglows could be detected in an optical transient survey, such as LSST.
This paper is organized as follows. In § 2, we summarize the viscous afterglow model, and describe our methods for estimating the identifiable population of AGN harboring a recently merged SMBHB. In § 3, we present estimates for the number of identifiable afterglow sources in the sky. We summarize our results and offer our conclusions in § 4.
2 A Simple Model for the Afterglow Population
In this section, we describe the model and underlying assumptions used to estimate the number of observable afterglow sources in the sky. We use the idealized Newtonian viscous evolution model described by TM10 to calculate the light–curve and spectral evolution of the source, and to obtain light curves in fixed frequency bands. Then, following Haiman et al. (2009) we assume that every SMBHB merger ultimately leads to a bright quasar episode. Using the bolometric quasar luminosity function of Hopkins et al. (2007b) as a proxy for the underlying SMBH mass function, we estimate the number of afterglow sources in the sky that exhibit identifiable photometric brightening. 555 As discussed by Haiman et al. (2009), an alternative method to construct the luminosity function is to calculate the SMBH merger rate from the merger rate of dark matter halos, and apply the post-merger light curve to each merger event. That method requires a third ingredient, namely a way to prescribe the SMBH masses from the halo masses. Given the approximate nature of our calculation, we choose the simpler method described in the text.
Throughout this paper, , and denote the binary mass, mass ratio and semi-major axis, respectively. The physical constants , , and have their usual meanings.
2.1 Modeling Afterglow Light Curves
Below, we briefly recapitulate the main features of the viscous afterglow model, which was advanced by MP05 and elaborated upon by TM10 (see also Shapiro 2010). We refer the reader to those earlier works for further details; a derivation of the disk evolutionary equations, in particular, can be found in Appendix A of TM10.
A SMBHB in a circular orbit of semi-major axis will open an annular gap in a thin circumbinary disk at a radial distance from the binary’s center of mass (Artymowicz et al., 1991). The binary will shrink gradually by depositing orbital angular momentum in the disk, maintaining a nearly self-similar geometry with . The kinematic viscosity of the gas comprising the disk is a weak function of radius , and thus the viscous time roughly scales just outside the cavity as . Because GW emission shrinks the orbit on a timescale , there exists a value of inside which the binary orbit begins to shrink faster than the circumbinary gas can viscously follow. This critical binary separation is of the order ; past this point, the evolution of the binary and the disk are decoupled.
After decoupling, the evolution of the disk surface density can be described by the standard equation for a thin, Keplerian accretion disk (e.g., Frank et al., 2002):
| (1) |
In the special case when the dependence of the gas viscosity on radius can be approximated as a power–law, , the surface density evolution can be solved semi-analytically with a Green’s function formalism (Lynden-Bell & Pringle 1974, TM10), starting from an arbitrary initial distribution .
The subsequent evolution of the circumbinary disk is sensitive to several properties of the binary-plus-disk system. For a given total binary mass , the relevant observable quantities can be expressed in terms the following eight system parameters.
-
•
The parameter is the symmetric mass ratio of the binary, scaled to unity for equal-mass binaries.
-
•
The ratio of the diameters of the circumbinary cavity and the binary separation at decoupling is specified by the parameter .
-
•
The gas viscosity is parametrized via the ratio of the viscous stress to the gas pressure, (Shakura & Sunyaev, 1973). The choice to scale the viscosity with the gas pressure and not the total pressure is motivated by calculations that suggest that radiation pressure-dominated thin disks may be thermally unstable (Shakura & Sunyaev, 1976; Pringle, 1976).666 Even if thermally stable (Hirose et al., 2009), such disks may still be viscously unstable (Lightman & Eardley, 1974; Piran, 1978; Hirose et al., 2009).
-
•
The parameter gives the ratio at decoupling of the timescale on which the binary shrinks due to GW emission to the viscous time of the gas at the cavity wall. MP05 prescribed , based on the fact that the gas near the cavity wall has a very steep density gradient and will move on a characteristic time–scale after the binary torques vanish. However, the calculations by TM10 suggest that the lower value of is more appropriate, as it gives a closer approximation to the time elapsing between the merger and when the binary torques cease to influence the gas.
-
•
The disk porosity parameter, , prescribes how the optical thickness between the disk midplane and the height where the emitted photons are thermalized relates to the surface density: , where is the electron-scattering cross section.
-
•
The viscous evolution model assumes a radial power–law for the kinematic viscosity, . Prior to merger, viscosity in a circumbinary decretion disk may be expected to be a weak function of radius, with ; after the merger, may be expected in the accretion region of interest (TM10).
-
•
Another parameter of interest is the radial power-law index of the disk mass profile at decoupling. The standard steady-state solution for a thin accretion disk around a single central object satisfies , with mass flow constant with radius. However, at the cavity wall the binary torques decrete the gas outward; in this regime, the disk would more likely satisfy , with torque density (e.g., Pringle, 1991). We prescribe initial surface density profiles satisfying
with a steep exponential drop-off in near (MacFadyen & Milosavljević 2008; TM10).
-
•
The value of the surface density at the cavity wall at decoupling depends on how much gas has piled up due to accretion of outer gas and decretion of the gas just inside. We parametrize this value as , where is the accretion rate that would produce a luminosity corresponding to the Eddington limit for the binary mass , assuming a radiative efficiency of . The parameter can be thought of as the product of two quantities: the mass supply rate to the disk in Eddington units, and the enhancement of the disk surface density just outside the cavity due to mass accumulation. The second factor may be expected to exceed unity.
In addition to the above parameters, the cosmological redshift of the source will also obviously affect the observed spectra, luminosity, and brightening rates of the sources.
For a given set of parameters, we use the corresponding surface density evolution to calculate the disk temperature profile at depths where the emitted photons are thermalized, which in turn is used to obtain the monochromatic luminosity in the source rest frame:
| (2) |
The leading factor of two on the right hand side of equation (2) accounts for the fact that the disk radiates from two faces; is the Planck function; is the ratio of the absorption to the total opacity; and the fraction is the deviation of the flux from blackbody (e.g., Rybicki & Lightman, 1986; Blaes, 2004). The effective temperature in the inner region of the disk is higher than a blackbody disk with the same surface density distribution, and thus it produces a harder spectrum. The lower limit of integration, , is the radius of the innermost stable circular orbit, for which we adopt the value , consistent with the assumption that the binary remnant has moderate spin, . The choice for the upper limit of integration is somewhat arbitrary, and does not significantly affect as long as it is sufficiently large; at larger radii the flux is significantly lower, and evolves on much longer timescales than the inner region originally occupied by the cavity.
The overall disk evolution timescale is roughly the viscous time at the cavity wall, evaluated at decoupling:
| (3) |
Although the disk continues to brighten and spectrally harden for after the merger, the most dramatic evolution takes place in the first , which corresponds to the faster viscous spreading of the sharp density edge at .
The time–dependent spectrum of the viscously spreading disk can be divided into two parts: a nearly static low–frequency component produced predominantly by gas outside ; and a rapidly evolving high–frequency component produced predominantly by the gas flowing into the central cavity. The characteristic frequency that marks the boundary between the static and variable parts of the spectrum can be approximated in the source rest frame (TM10) as
| (4) |
or, in terms of the wavelength,
| (5) |
Above, we have defined , , and . These equations already reveal that significant brightening will occur primarily at photon energies in the hard UV to X-ray bands. While the characteristic frequency in eq. (4) can move into the optical bands for the most massive SMBHs, the overall evolutionary timescale for these sources, eq. (3), becomes long. The most rapid evolution takes place as the cavity fills; once it is filled, the system evolves more gradually to approach a standard steady thin accretion disk solution around a single SMBH, with the quantity peaking at a frequency of roughly . The spectrum falls off steeply at higher frequencies, and is likely unobservable above .
Prior to decoupling, the luminosity of the disk at frequencies is negligible. Once the cavity is filled, the monochromatic luminosity at frequencies reaches
| (6) |
In order to be identifiable in a survey, an afterglow source must exhibit significant brightening, at least comparable to the typical variability of typical AGN, at luminosities and frequencies to which the survey is sensitive.
2.2 Modeling the Population of Afterglow Sources
We now turn to estimating the number of identifiable afterglow sources. The approach described below closely follows that described in Haiman et al. (2009) for estimating the number of pre-merger sources that may be detectable by their periodic variability. We begin by prescribing the quasar luminosity function as a proxy for the SMBH mass function. Specifically, we adopt the bolometric luminosity function of Hopkins et al. (2007b), and suppose that during a typical bright quasar phase, the luminosity and SMBH mass are related via a simple approximate relation, , where is the Eddington luminosity for an object with mass , and is a constant. This is an admittedly rough estimate, as is known to have a non-negligible spread among the population of bright quasars. However, our simple estimate is sufficient for a proof-of-concept; a more precise calculation is not warranted, given the approximate and highly idealized nature of the afterglow model and the uncertainty in the system parameters. We choose the fiducial values (e.g., Kollmeier et al., 2006) and assume a rest-frame quasar lifetime of (e.g., Martini, 2004).
We further assume that there is a one-to-one correspondence between a SMBHB merger and a bright quasar episode, i.e. that a SMBHB merger ultimately triggers quasar activity. This assumption is consistent with our post-merger disk evolution model, which naturally leads to a state with a fully extended disk around a single SMBH, as long as fuel remains available to maintain near-Eddington accretion rate at the outer edge of the disk. Given the comoving number density of AGN , we are interested in the subset of SMBH merger remnants that are producing an observable, brightening afterglow, and have not yet settled to a later, presumably steadier quasar phase. To estimate this fraction of SMBHs, we use the afterglow model described above, and calculate the duration over which the photometric emission from a circumbinary disk brightens at a rate exceeding some threshold value. This threshold should be chosen to correspond to a brightening rate that is not only measurable, but is also distinguishable from other possible sources of time-variability. The number of variable sources in the sky of such SMBHB remnants in a given mass and redshift range is then
| (7) |
where is the cosmological comoving volume between redshifts and and is the space density of SMBHs of mass , inferred from the quasar luminosity function evaluated at . It is worth emphasizing that this expression does not assume that the birthing quasars have a bolometric luminosity of – rather, here represents the characteristic luminosity that is produced by SMBHs of mass in their quasi–steady quasar state; this asymptotic luminosity is reached only yrs after the merger, according to our afterglow models.
3 Results and Discussion
3.1 Basic Parameter Dependencies
The dependence of the number of detectable variable sources on the various model parameters for the binary-plus-disk population is of obvious interest, and is not trivial, as each parameter affects differently the luminosity, spectral frequency and brightening rate of the afterglow. For example, increasing the binary mass increases the source luminosity and lowers the characteristic frequency of the source, while making the afterglow evolve more slowly — thus, the brightening and hardening rates both decrease (making identification more difficult) while the total flux and the total afterglow lifetime both increase (making a detection easier).
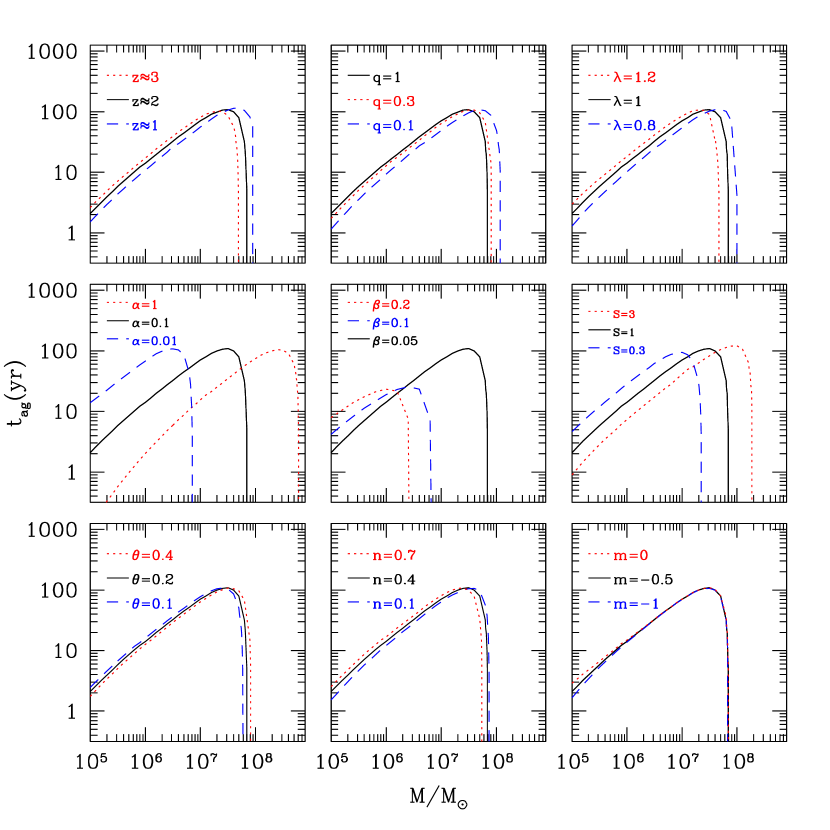
To illustrate how each of the parameters and the source redshift affect the detectability of variable afterglow sources, in Figure 1 we first plot the basic quantity , representing the amount of time sources are observed to spend at or above the required threshold for the brightening rate. The threshold in this figure is set at of at least , in the soft X–ray frequency window of keV (motivated by the proposed all-sky X-ray transience survey LWFT; see below). The solid black curve in each panel shows for the fiducial parameter values , , , , and . In each panel, we show how the apparent duration of the rapidly brightening phase is affected by changes (dashed and dotted lines) in one of the system parameters.
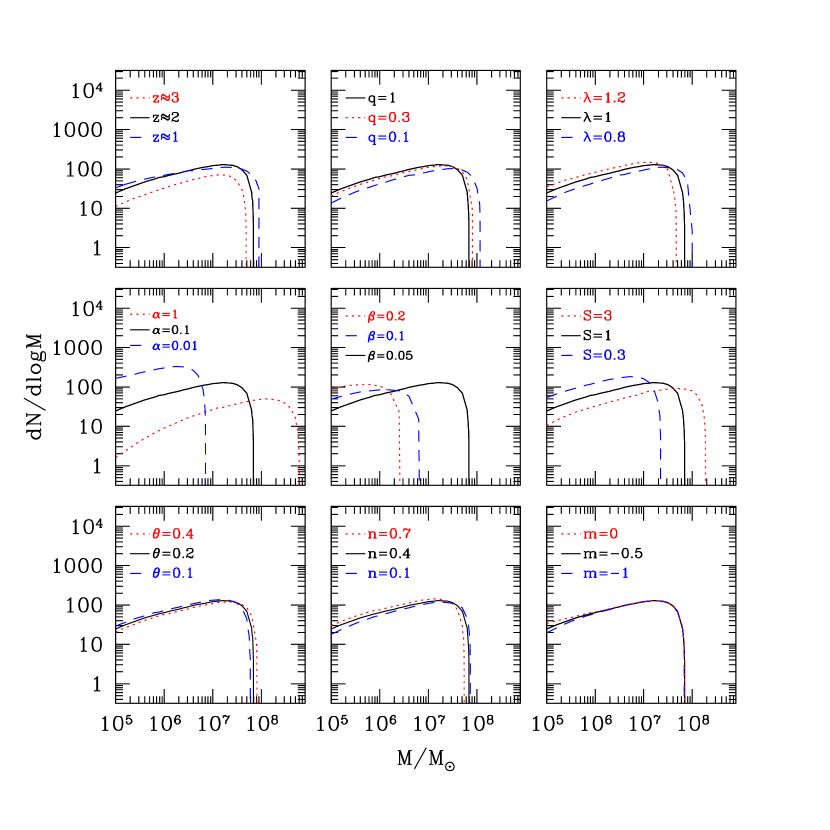
In Figure 2, we plot the corresponding number of sources that exhibit a band luminosity of at least and an observed brightening rate of at least in the same keV frequency window. This is given by the product of the duty cycle and the space density of SMBHs (eq. 7), except that a further cut is imposed in luminosity. This is because the brightening rate initially may exceed the threshold for SMBHs with masses near the low–mass end of the range shown in the figure, but their band fluxes are still below the imposed threshold; these sources are excluded by subtracting the duration of this initial, sub-luminous state from the duty cycle . The number is computed for the whole sky, and over a redshift range . The line-style scheme is the same as in Figure 1: the solid black curves show for fiducial parameter values, and the dashed and dotted curves show how the number of rapidly brightening sources depends on each parameter. The optimistic luminosity and brightening thresholds in this figure are chosen purely for demonstrative purposes. For reference, a source with and would, in fact, have a flux of only , and thus be too faint to be monitored for variability. Also, AGN have been observed to vary in their X-ray brightness by as much as order unity on timescales of years. Although the afterglows in question would exhibit a monotonic increase in X-ray brightness, along with a corresponding monotonic spectral hardening, it is unclear whether a brightening rate of , even if sustained for several years, and accompanied by a monotonic hardening of the spectrum, would be sufficient to distinguish an afterglow candidate from other X-ray variable sources.
The steep cutoff at high binary masses seen in both and , in Figures 1 and 2, respectively, has two causes. One is that for sufficiently large , the emission frequency of the source becomes too low, and falls out of the soft X–ray window. The other reason is that the disk evolution timescale scales as , so that for sufficiently large the disk evolves so slowly that its brightening rate never reaches the adopted threshold of .
Figures 1 and 2 also show that the duration of the brightening phase, and the mass function of the afterglow sources depend strongly only on the parameters , and . This is due to the fact that the afterglow frequency range and evolution timescale scale steeply with these parameters (see equations 3 and 4). Increasing , increasing and decreasing relative to their fiducial values all have the effect of increasing the afterglow emission frequencies and pushing it further into the survey frequency window, while also increasing the brightening rate of the afterglow. The quantities and both depend only weakly on , and varies too weakly in the range to have a sizable effect. Increasing (decreasing) the parameter results in afterglows that are further inside (outside) the frequency window but evolve much more slowly (quickly) – the two effects tend to cancel out, and yield a relatively weak overall effect on .
It is worth noting that the brightest afterglow sources satisfying a fixed are not the most massive ones. This is because disks around more massive BHs evolve more slowly, and the brightening rate is greatest early in the post-decoupling disk evolution when the source is dimmer. For most of the parameter value combinations probed in Figure 2 — excepting , and for the moment — the most luminous sources brightening at or above the threshold rate are those with binary masses of . Interestingly, this mass range lies in the middle of LISA’s sensitivity window.
The maximum band luminosities of these sources are typically , and behave roughly as described in equation (6). For and , the masses and luminosities for the brightest afterglow sources are somewhat greater: and .
The range of luminosities across the parameter combinations probed in Figures 1 and 2 correspond to an observed soft X-ray flux of in the range . Thus, if the approximate location of the source is known via a prior GW detection, the afterglow would be observable during the rapidly brightening phase at the sensitivity achieved by existing instruments such as XMM-Newton, ROSAT HRI, and Chandra (at ks exposure; see, e.g., Brandt & Hasinger, 2005). For the parameter combinations probed in Figures 1 and 2, there are at most sources in the sky with and , and they maintain this luminosity and brightening rate for in the observer frame.
3.2 Counts of Birthing Quasars in X-ray and Optical Surveys
Applying the methods described above to estimate the afterglow light-curve and source population, we next calculate the source counts of identifiable afterglows as a function of their apparent flux. Based on the fact that the mergers of massive dark matter halos peak at a redshift , we limit our analysis to AGN in the redshift range . We assume that the typical disk-plus-binary system has parameter values , , , , and . In reality, these parameters will vary from system to system, perhaps by a great deal. However, because our calculations above (equation 6 and Figure 2) suggest that neither the luminosity nor the mass function of afterglow sources are likely to be affected by the values of these parameters by more than an order of magnitude, we limit further exploration of the parameter space to the - plane. The value of the viscosity parameter is highly uncertain; however, numerical simulations of MHD disks suggest in the radiation-dominated regions of an accretion disk is consistent with our type of viscosity prescription (Hirose et al., 2009). Assuming that the mass supply rate around the afterglow phase is at least comparable to the rate during prolonged AGN activity, we expect to be at least as great as the ratio of the typical luminosity of the typical AGN episode to the Eddington luminosity limit of the SMBH engine, i.e. . Depending on how much mass the circumbinary disk accumulates near its inner wall prior to decoupling, may, however, significantly exceed .
3.2.1 X-ray Surveys
We consider a hypothetical survey with observational capabilities similar to those of the proposed LWFT mission, sensitive to photon energies of keV, down to fluxes of (confusion limit for LWFT).
In Figure 3, we present the X-ray source counts of objects increasing in band luminosity by at least , , and in the relevant frequency band. (Note that the energy range approximately coincides with the sensitivity window of existing deeper-exposure telescopes such as Chandra and XMM-Newton, and the planned all-sky survey eROSITA.) In the figure, the height of the histogram pillars are the number of sources in each logarithmic flux bin, with each bin having a width . The dashed vertical line in each panel shows the approximate source confusion flux limit. These results suggest that only if is large, i.e. if there is significant mass accumulation at the inner wall of the circumbinary disk, then rapidly brightening afterglow sources could be detected by the model mission: several sources at and as many as dozens of sources for . The brightest of these sources have central SMBH masses of , and thus most of the X-ray-detectable sources would also be observable by LISA. However, for , some would fall outside LISA’s sensitivity window. These sources are expected to continue to brighten at a slightly reduced rate at harder frequencies, keV; this is a prediction that could be tested with pointed follow-up observations. Our calculations indicate that birthing quasars will be difficult to identify with existing and planned wide-angle soft-X-ray surveys. For example, the eROSITA all-sky survey is expected to have a semi-annual flux limit of with a time resolution of months at those flux levels. Intrinsic absorption of soft X-rays by the birthing quasar itself could also be an observational barrier for at least some of the sources (see, e.g., Brandt et al., 2000), especially if galaxies harboring merging SMBHBs tend to be more heavily shrouded in gas and dust than the general population of active galaxies.
Whether the monotonic brightening of the afterglow would be sufficiently distinguishable from the X-ray variability of faint AGN and other sources is an open (and more difficult) question. Luminous X-ray AGN have been known to vary by as much as (e.g., Mushotzky et al., 1993). Any monotonic brightening in the X-ray must be distinguished from other sources of intrinsic variability, in addition to any instrumental error close to the faint-flux detection limit. It would appear likely, however, that a source that monotonically increases its X-ray luminosity by up to order unity per year for several years, while showing a consistent and monotonic hardening of its spectrum for the entire duration, would be fairly unusual. While an increase in the accretion rate through a standard thin accretion disk is also expected to produce a simultaneous brightening and spectral hardening, the spectral evolution will be different in detail. We also note that a variability survey, utilizing the ROSAT all sky survey, as well as pointed ROSAT observations (Grupe et al., 2001) found no correlation between changes in flux and spectral hardening in a sample of luminous soft-X-ray AGN. If the brightening is caused by the viscous afterglow, it would also slow down on humanly tractable timescales and the light curve could be checked at different observational frequencies against the evolutionary models for the viscously spreading disk. This feature would also help distinguish birthing quasars from tidal disruption events.
It is worth emphasizing that a major caveat of the above analysis is that the thin-disk formalism adopted in our afterglow model breaks down for models with . Indeed, in this massive regime, the disk midplane temperature becomes sufficiently high that a one-dimensional estimate for the disk scale-height-to-radius ratio , evaluated at the cavity wall, exceeds unity (\al@MP05, TM10; \al@MP05, TM10). This suggests that horizontal advection would become a significant factor in determining the structure of the inner accretion flow. The evolution and emission properties of the disk in this advective regime is highly uncertain and it remains a subject of active research. Advective disks have generally been associated with radiatively inefficient accretion states (see Narayan & Quataert, 2005, for a review), but the situation may be different here, with a high density accretion flow and an intrinsically time-dependent flow. As suggested by MP05, horizontal advection could act to make the disk “slim”, as in the models of Abramowicz et al. (1988), and thus relatively radiatively efficient. It is also unclear how well binary torques can open a central cavity in the first place, if the disk becomes geometrically thick. Adding to the various modeling uncertainties is the possibility that a sizable fraction of the viscously dissipated energy could be deposited into a hot disk corona (e.g., Liu et al., 2003a), which would lead to a significant increase of the afterglow high energy emission, well above what is predicted by our strictly thermal afterglow models.
3.2.2 Optical Surveys (LSST)
Our simple viscous emission model predicts that the same SMBH binary remnant that produces an X-ray afterglow would brighten at lower, optical frequencies at a rate of , several years prior to the X-ray afterglow (TM10). This less pronounced variability is comparable in magnitude to the intrinsic r.m.s. long-term variability of optical AGN (e.g., Ulrich et al. 1997). However, if the approximate location of the source is known through a GW detection, searching for AGN exhibiting steady optical/ultraviolet brightening may identify the source before the X-ray afterglow. Alternatively, in the absence of a GW signal, a wide-angle variability survey of optical AGN with high time resolution, such as those possible with LSST, could possibly still be used to select afterglow candidates for follow-up X-ray observations.
Motivated by these possibilities, we apply our simple source-count estimate to the LSST u photometric band ( nm). We choose this band because it is the LSST filter with the highest frequency range, and thus the one in which the afterglow brightening is likely to be the most prominent. The results are presented in Figure 4. In both panels, the dashed vertical lines demarcate the limiting flux for signal-to-noise of over a period ( accumulated exposure). With the fiducial parameter choices in the left panel, there is clearly no hope of a detection. We also find that, unlike in the X-ray bands, raising the value of does not increase the source counts. This is because while increasing beyond the fiducial value pushes the evolving portion of the spectrum into the model instrument band, it pushes it further out of the LSST u band, reducing the optical variability. Therefore, we instead show, in the right panel, the expected number counts for the larger value , on which the emission frequency depends less strongly. We find that the sources are still likely to be too dim and too few to be identifiable with high confidence from among the large number of AGN expected to be detected by LSST. However, gradually brightening optical AGN could still be cataloged, and their X-ray luminosities could be cross-checked with data from instruments such as eROSITA for subsequent X-ray afterglows, which may still prove useful.
More promising for optical surveys is the possibility that the X-ray afterglow may be promptly reprocessed into optical or infrared frequencies, either by dust surrounding the source (MP05) or by warps and vertical splaying in the circumbinary disk (TM10). If a significant portion of the X-ray emission is reprocessed, then the afterglow source will appear as an AGN whose optical/infrared luminosities can brighten by . Such a monotonic variability would exceed the typical long-term r.m.s. variability in AGN brightness at these frequencies, and is likely to be identifiable by LSST. For purely demonstrative purposes, we adopt here a simple toy model, in which a fraction of the emitted power above keV in the source’s rest frame is reprocessed (thermalized) and re–emitted at frequencies below the ultraviolet energy eV, so that the power below eV is enhanced as
| (8) |
We further assume that the fractional energy enhancement is roughly uniform in the optical and infrared — i.e., we ignore line emission from recombination processes — so that for our purposes the optical spectral emission is given by
| (9) |
This prescription is similar in spirit to the model of Gierliński et al. (2009), who showed that reprocessing signature of the X-ray outbursts of the stellar-mass black hole system XTE J1817-330 is consistent with reprocessing a constant fraction of the bolometric X-ray luminosity. We also neglect the reprocessing time, which is dominated by the light-travel time and much shorter than the variability timescales of interest here (see, e.g., Peterson & Horne, 2004).
The source counts in the LSST u band for this model, for a reprocessing fraction , are shown in Figure 5. Our simple calculations suggest that perhaps dozens of afterglows could be detected if the X-ray emission is reprocessed, for moderately optimistic parameter values, e.g., for . It is worth cautioning that the reprocessed fraction is highly dependent on the vertical disk geometry, which itself may be rapidly evolving during the afterglow. For instance, TM10 found in their non-irradiated afterglow models that the scale-height-to-radius ratio can be a steeply increasing function of radius during the period when the cavity is refilling, but not necessarily before or after this phase. Such complications should be included, along with details of radiative transfer, in a more realistic analysis of disk irradiation and reprocessing. Finally, absorption of the reprocessed UV/optical emission by gas and dust, surrounding the nuclear SMBH on larger scales, could be another observational hindrance for at least some of the sources.
4 Conclusions
Using an idealized model for the population of coalescing SMBHBs, and for the light curve of the afterglow produced by the viscously spreading post-merger circumbinary disk, we have shown that ongoing afterglows of SMBHB mergers may be present in the data sets of wide X-ray and optical surveys. In soft X-ray bands, this requires that the surface density and the viscosity in the circumbinary disk be at the high end of the expected range, while afterglows could only be found in optical surveys if the X-ray emission is promptly and significantly reprocessed into optical frequencies.
Despite the highly approximate nature of our analysis and other model uncertainties, our calculations provide a proof-of-concept for a very general hypothesis: SMBHB mergers may exhibit identifiable, steady brightening rate for a period of the order of decades, and such afterglows could be detected serendipitously in a large survey that revisits the sky at least every few months for several years. Our more specific findings can be summarized as follows:
-
•
For optimistic parameter values, several birthing quasars, brightening by at least for several years, could be identified in the 0.1 - 3.5 keV soft X-ray band by an all-sky survey with specifications comparable to those proposed for the LWFT mission.
-
•
At any given time, there could be up to sources in the sky that exhibit a brightening at or above , with soft X-ray luminosities . The most luminous sources typically spend in this state, and thus can be monitored on humanly tractable timescales. These numbers depend weakly on most system parameters.
-
•
To have any hope of detecting birthing quasars, a survey has to reach a depth of at least a few . However, the slopes of our calculated distributions at fluxes just below this threshold are relatively shallow (Figures 3, 4 and 5), implying that surveys should favor large angular sky coverage over depth, once they reach this flux threshold.
-
•
If identified, candidate sources can be followed up by pointed observations at higher frequencies, where they are expected to continue both their monotonic brightening and their spectral hardening.
-
•
Most birthing quasars that are identifiable have, coincidentally, SMBH masses lying in the middle of LISA’s sensitivity window (), and are thus members of the same population that would be probed with GW detections. However, a minority ( for ) of the detectable X-ray variables have masses of , probing a population above LISA’s range.
-
•
These sources may be identifiable by LSST if a fraction as low as of the X-ray flux is promptly reprocessed into the optical frequencies.
Our calculations are contingent on theoretical caveats of the afterglow scenario we have considered. The two primary uncertainties regarding the post-merger evolution of the circumbinary cavity are related to the viscous and advective properties of the disk. As stated in § 2.1, the viscosity of accretion flows, including the possibility of viscous instability, are not well understood when radiation pressure dominates gas pressure, which is the relevant regime for the gas refilling the circumbinary cavity. Additionally, the disk may be geometrically thick (\al@MP05, TM10; \al@MP05, TM10), either right at decoupling or later during the afterglow phase, suggesting that horizontal advection may play a significant role in determining the surface density evolution and the disk net emission properties. The importance of viscous instabilities in radiation-dominated accretion flows remains a general open question, and the role of advection in a viscously spreading accretion flow remains a largely unexplored regime. More detailed studies of the circumbinary cavity will be needed to address how these effects may affect the emission predicted by simple analyses based on a thin disk formalism such as ours. Another major uncertainty is the validity of our assumption that quasar activity can be associated with SMBH coalescence. In reality, there may not be a one-to-one relation: it is possible that for at least some AGN, gas accretion or changes in radiative efficiency are triggered by mechanisms other than SMBH mergers; conversely, some SMBH mergers may not trigger prolonged quasar activity. If the former is true, our analysis overestimates the number of identifiable afterglow sources; if the latter is true, then our results could in principle be an underestimate.
For completeness, we note that while we focused here on the viscous afterglows, other SMBHB merger–related signatures could also be looked for in EM surveys. For example, the GW–emission–induced mass–loss and recoil can cause strong disturbances in the circumbinary disk, which can produce a detectable afterglow (Lippai et al., 2008; Schnittman & Krolik, 2008; Shields & Bonning, 2008; O’Neill et al., 2009; Megevand et al., 2009; Corrales et al., 2010; Rossi et al., 2010). For the low SMBH masses of relevant for LISA, these signatures are expected to have a short duration few years (e.g., Corrales et al. 2010) and would be too rare to be found serendipitously, without a trigger from LISA. However Schnittman & Krolik (2008) and Shields & Bonning (2008) focused on these signatures in disks around more massive SMBHs, which occur on longer (yr) time–scales, and proposed detecting a flare by monitoring a population of AGN in the infrared or X-rays bands. Another possibility is that the binary is activated, and produces periodic emission, tracking the orbital frequency, prior to the merger. Haiman et al. (2009) argued that as long as this emission is at a few percent of the Eddington luminosity, a population of these variable sources, with periods of tens of weeks, may be identifiable in optical or X-ray surveys.
To conclude, the concomitant observation of a SMBHB merger based on GW and EM signals remains by far the most promising scenario for the unambiguous detection of such systems. The precision with which LISA would determine the masses, spins, and luminosity distances of coalescing binaries can not be replicated by current or planned EM telescopes. However, detections based on EM signatures alone could still help identify SMBHB mergers before LISA is launched, and perhaps more importantly, possibly outside LISA’s mass sensitivity window. Detecting the EM signatures from the mergers of the most massive SMBHs would complement the synergistic EM-plus-GW observations of lower-mass systems, and help provide a more complete picture of the accretion physics and cosmological evolution history of SMBHBs.
TT thanks Joshua Peek and Jennifer Sokoloski, and ZH thanks Stefanie Komossa, Jules Halpern, and Richard Mushotzky, for useful conversations on AGN surveys. This work was supported by the Polányi Program of the Hungarian National Office for Research and Technology (NKTH) and by NASA ATFP grant NNXO8AH35G.
References
- Abramowicz et al. (1988) Abramowicz, M. A., Czerny, B., Lasota, J. P., & Szuszkiewicz, E. 1988, ApJ, 332, 646
- Anderson et al. (2010) Anderson, M., Lehner, L., Megevand, M., & Neilsen, D. 2010, Phys. Rev. D, 81, 044004
- Armitage & Natarajan (2002) Armitage, P. J. & Natarajan, P. 2002, ApJ, 567, L9
- Artymowicz et al. (1991) Artymowicz, P., Clarke, C. J., Lubow, S. H., & Pringle, J. E. 1991, ApJ, 370, L35
- Artymowicz & Lubow (1994) Artymowicz, P. & Lubow, S. H. 1994, ApJ, 421, 651
- Baker et al. (2006) Baker, J. G., Centrella, J., Choi, D., Koppitz, M., & van Meter, J. 2006, Physical Review Letters, 96, 111102
- Barnes & Hernquist (1991) Barnes, J. E. & Hernquist, L. E. 1991, ApJ, 370, L65
- Begelman et al. (1980) Begelman, M. C., Blandford, R. D., & Rees, M. J. 1980, Nature, 287, 307
- Blaes (2004) Blaes, O. M. 2004, in Accretion Discs, Jets and High Energy Phenomena in Astrophysics, ed. V. Beskin, G. Henri, F. Menard, & et al., 137–185
- Bloom et al. (2009) Bloom, J. S., Holz, D. E., Hughes, S. A., & Menou, K. 2009, in The Astronomy and Astrophysics Decadal Survey, Vol. 2010, 20
- Bode & Phinney (2007) Bode, N. & Phinney, S. 2007, APS Meeting Abstracts, 1010
- Boroson & Lauer (2009) Boroson, T. A. & Lauer, T. R. 2009, Nature, 458, 53
- Brandt & Hasinger (2005) Brandt, W. N. & Hasinger, G. 2005, ARA&A, 43, 827
- Brandt et al. (2000) Brandt, W. N., Laor, A., & Wills, B. J. 2000, ApJ, 528, 637
- Callegari et al. (2009) Callegari, S., Mayer, L., Kazantzidis, S., Colpi, M., Governato, F., Quinn, T., & Wadsley, J. 2009, ApJ, 696, L89
- Campanelli et al. (2006) Campanelli, M., Lousto, C. O., Marronetti, P., & Zlochower, Y. 2006, Physical Review Letters, 96, 111101
- Carlberg (1990) Carlberg, R. G. 1990, ApJ, 350, 505
- Chang et al. (2010) Chang, P., Strubbe, L. E., Menou, K., & Quataert, E. 2010, MNRAS, 1003
- Colpi et al. (2009) Colpi, M., Callegari, S., Dotti, M., & Mayer, L. 2009, Classical and Quantum Gravity, 26, 094029
- Comerford et al. (2009) Comerford, J. M., Griffith, R. L., Gerke, B. F., Cooper, M. C., Newman, J. A., Davis, M., & Stern, D. 2009, ApJ, 702, L82
- Corrales et al. (2010) Corrales, L. R., Haiman, Z., & MacFadyen, A. 2010, MNRAS, 404, 947
- Cuadra et al. (2009) Cuadra, J., Armitage, P. J., Alexander, R. D., & Begelman, M. C. 2009, MNRAS, 393, 1423
- Cutler (1998) Cutler, C. 1998, Phys. Rev. D, 57, 7089
- Dotti et al. (2007) Dotti, M., Colpi, M., Haardt, F., & Mayer, L. 2007, MNRAS, 379, 956
- Escala et al. (2005) Escala, A., Larson, R. B., Coppi, P. S., & Mardones, D. 2005, ApJ, 630, 152
- Frank et al. (2002) Frank, J., King, A., & Raine, D. J. 2002, Accretion Power in Astrophysics: Third Edition (Cambridge University Press)
- Gibson et al. (2008) Gibson, R. R., Brandt, W. N., & Schneider, D. P. 2008, ApJ, 685, 773
- Gierliński et al. (2009) Gierliński, M., Done, C., & Page, K. 2009, MNRAS, 392, 1106
- Grupe et al. (2001) Grupe, D., Thomas, H., & Beuermann, K. 2001, A&A, 367, 470
- Haehnelt (1994) Haehnelt, M. G. 1994, MNRAS, 269, 199
- Haiman et al. (2009) Haiman, Z., Kocsis, B., & Menou, K. 2009, ApJ, 700, 1952
- Hirose et al. (2009) Hirose, S., Blaes, O., & Krolik, J. H. 2009, ApJ, 704, 781
- Holz & Hughes (2005) Holz, D. E. & Hughes, S. A. 2005, ApJ, 629, 15
- Hopkins et al. (2007a) Hopkins, P. F., Bundy, K., Hernquist, L., & Ellis, R. S. 2007a, ApJ, 659, 976
- Hopkins et al. (2007b) Hopkins, P. F., Richards, G. T., & Hernquist, L. 2007b, ApJ, 654, 731
- Ivanov et al. (1999) Ivanov, P. B., Papaloizou, J. C. B., & Polnarev, A. G. 1999, MNRAS, 307, 79
- Kocsis et al. (2006) Kocsis, B., Frei, Z., Haiman, Z., & Menou, K. 2006, ApJ, 637, 27
- Kocsis et al. (2008) Kocsis, B., Haiman, Z., & Menou, K. 2008, ApJ, 684, 870
- Kocsis et al. (2007) Kocsis, B., Haiman, Z., Menou, K., & Frei, Z. 2007, Phys. Rev. D, 76, 022003
- Kollmeier et al. (2006) Kollmeier, J. A., Onken, C. A., Kochanek, C. S., Gould, A., Weinberg, D. H., Dietrich, M., Cool, R., Dey, A., Eisenstein, D. J., Jannuzi, B. T., Le Floc’h, E., & Stern, D. 2006, ApJ, 648, 128
- Komossa et al. (2003) Komossa, S., Burwitz, V., Hasinger, G., Predehl, P., Kaastra, J. S., & Ikebe, Y. 2003, ApJ, 582, L15
- Krolik (2010) Krolik, J. H. 2010, ApJ, 709, 774
- Lang & Hughes (2008) Lang, R. N. & Hughes, S. A. 2008, ApJ, 677, 1184
- Lightman & Eardley (1974) Lightman, A. P. & Eardley, D. M. 1974, ApJ, 187, L1+
- Lippai et al. (2008) Lippai, Z., Frei, Z., & Haiman, Z. 2008, ApJ, 676, L5
- Lippai et al. (2009) —. 2009, ApJ, 701, 360
- Liu et al. (2003a) Liu, B. F., Mineshige, S., & Ohsuga, K. 2003a, ApJ, 587, 571
- Liu (2004) Liu, F. K. 2004, MNRAS, 347, 1357
- Liu et al. (2003b) Liu, F. K., Wu, X., & Cao, S. L. 2003b, MNRAS, 340, 411
- Lynden-Bell & Pringle (1974) Lynden-Bell, D. & Pringle, J. E. 1974, MNRAS, 168, 603
- MacFadyen & Milosavljević (2008) MacFadyen, A. I. & Milosavljević, M. 2008, ApJ, 672, 83
- Magorrian et al. (1998) Magorrian, J., Tremaine, S., Richstone, D., Bender, R., Bower, G., Dressler, A., Faber, S. M., Gebhardt, K., Green, R., Grillmair, C., Kormendy, J., & Lauer, T. 1998, AJ, 115, 2285
- Martini (2004) Martini, P. 2004, in Coevolution of Black Holes and Galaxies, ed. L. C. Ho, 169–+
- Megevand et al. (2009) Megevand, M., Anderson, M., Frank, J., Hirschmann, E. W., Lehner, L., Liebling, S. L., Motl, P. M., & Neilsen, D. 2009, Phys. Rev. D, 80, 024012
- Menou et al. (2001) Menou, K., Haiman, Z., & Narayanan, V. K. 2001, ApJ, 558, 535
- Merritt & Ekers (2002) Merritt, D. & Ekers, R. D. 2002, Science, 297, 1310
- Merritt & Milosavljević (2005) Merritt, D. & Milosavljević, M. 2005, Living Reviews in Relativity, 8, 8
- Milosavljević & Phinney (2005) Milosavljević, M. & Phinney, E. S. 2005, ApJ, 622, L93 (MP05)
- Mushotzky et al. (1993) Mushotzky, R. F., Done, C., & Pounds, K. A. 1993, ARA&A, 31, 717
- Narayan & Quataert (2005) Narayan, R. & Quataert, E. 2005, Science, 307, 77
- O’Neill et al. (2009) O’Neill, S. M., Miller, M. C., Bogdanović, T., Reynolds, C. S., & Schnittman, J. D. 2009, ApJ, 700, 859
- Peterson & Horne (2004) Peterson, B. M. & Horne, K. 2004, Astronomische Nachrichten, 325, 248
- Phinney (2009) Phinney, E. S. 2009, in The Astronomy and Astrophysics Decadal Survey, Vol. 2010, 235
- Piran (1978) Piran, T. 1978, ApJ, 221, 652
- Pretorius (2005) Pretorius, F. 2005, Physical Review Letters, 95, 121101
- Pringle (1976) Pringle, J. E. 1976, MNRAS, 177, 65
- Pringle (1991) —. 1991, MNRAS, 248, 754
- Rodriguez et al. (2006) Rodriguez, C., Taylor, G. B., Zavala, R. T., Peck, A. B., Pollack, L. K., & Romani, R. W. 2006, ApJ, 646, 49
- Roos et al. (1993) Roos, N., Kaastra, J. S., & Hummel, C. A. 1993, ApJ, 409, 130
- Rossi et al. (2010) Rossi, E. M., Lodato, G., Armitage, P. J., Pringle, J. E., & King, A. R. 2010, MNRAS, 401, 2021
- Rybicki & Lightman (1986) Rybicki, G. B. & Lightman, A. P. 1986, Radiative Processes in Astrophysics (Wiley-VCH)
- Sanders et al. (1988) Sanders, D. B., Soifer, B. T., Elias, J. H., Madore, B. F., Matthews, K., Neugebauer, G., & Scoville, N. Z. 1988, ApJ, 325, 74
- Schnittman & Krolik (2008) Schnittman, J. D. & Krolik, J. H. 2008, ApJ, 684, 835
- Schoenmakers et al. (2000) Schoenmakers, A. P., de Bruyn, A. G., Röttgering, H. J. A., van der Laan, H., & Kaiser, C. R. 2000, MNRAS, 315, 371
- Sesana et al. (2007a) Sesana, A., Haardt, F., & Madau, P. 2007a, ApJ, 660, 546
- Sesana et al. (2007b) Sesana, A., Volonteri, M., & Haardt, F. 2007b, MNRAS, 377, 1711
- Shakura & Sunyaev (1973) Shakura, N. I. & Sunyaev, R. A. 1973, A&A, 24, 337
- Shakura & Sunyaev (1976) —. 1976, MNRAS, 175, 613
- Shapiro (2010) Shapiro, S. L. 2010, Phys. Rev. D, 81, 024019
- Shields & Bonning (2008) Shields, G. A. & Bonning, E. W. 2008, ApJ, 682, 758
- Sudou et al. (2003) Sudou, H., Iguchi, S., Murata, Y., & Taniguchi, Y. 2003, Science, 300, 1263
- Tanaka & Haiman (2009) Tanaka, T. & Haiman, Z. 2009, ApJ, 696, 1798
- Tanaka & Menou (2010) Tanaka, T. & Menou, K. 2010, ApJ, 714, 404 (TM10)
- Ulrich et al. (1997) Ulrich, M., Maraschi, L., & Urry, C. M. 1997, ARA&A, 35, 445
- Volonteri et al. (2003) Volonteri, M., Haardt, F., & Madau, P. 2003, ApJ, 582, 559
- Wyithe & Loeb (2003) Wyithe, J. S. B. & Loeb, A. 2003, ApJ, 590, 691
- Wyithe & Loeb (2009) —. 2009, MNRAS, 395, 1607