A two-component model of the neutron diffuse scattering in the relaxor ferroelectric PZN-4.5%PT
Abstract
We report measurements of the neutron diffuse scattering in a single crystal of the relaxor ferroelectric material 95.5%Pb(Zn1/3Nb2/3)O3-4.5%PbTiO3 (PZN-4.5%PT). Our results suggest that the nanometer scale structure in this compound exhibits both and polarizations, which contribute to different portions of the total diffuse scattering intensity. These contributions can be distinguished by the differing responses to an electric field applied along [001]. While diffuse scattering intensities associated with (T2-type) polarizations show little to no change in a [001] field, those associated with (T1-type) polarizations are partially suppressed by the field at temperatures below the Curie temperature TC K. Neutron spin-echo measurements show that the diffuse scattering at (0.05,0,1) is largely dynamic at high temperature and gradually freezes on cooling, becoming mostly static at 200 K.
pacs:
77.80.-e, 77.84.Dy, 61.12.ExI Introduction
The study of relaxors has grown dramatically over the past two decades. While many interesting properties distinguish relaxors from conventional ferroelectrics, the hallmark of relaxors is a highly frequency-dependent dielectric response that peaks broadly at a temperature that is unrelated to any structural phase transition. Park and Shrout (1997); Uchino (1996); Service (1997) Although the origin of many relaxor properties are still not well understood, most researchers tend to agree that the chemical short-range order in these materials, which are primarily compositionally disordered oxides, plays a key role in determining the bulk response. Cross (1987); Burton et al. (2006) In the case of the well-known lead-based, perovskite ABO3 relaxors Pb(Mg1/3Nb2/3)O3 (PMN) and Pb(Zn1/3Nb2/3)O3 (PZN), Park and Shrout (1997); Kuwata et al. (1981) the mixture of 2+ and 5+ B-site cations leads to local charge imbalances that create random fields that destroy long-range polar order. On the other hand short-range polar order, more commonly known as polar nanoregions (PNR), appears at temperatures well above the temperature at which the dielectric susceptibility reaches a maximum (). Burns and Dacol (1983) There have been substantial experimental evidences exist that suggest the PNR influence various bulk properties of relaxors such as the thermal expansion in PMN, Gehring et al. (2009) the piezoelectric coefficients in PMN doped with PbTiO3 (PMN-PT), Matsuura et al. (2006) and the transverse acoustic phonon lifetimes in PZN doped with 4.5% PbTiO3 (PZN-4.5%PT). Xu et al. (2008) However, unlike the chemical short-range order, which is quenched and thus does not change with temperature, the polar short-range order (PNR) is sensitive to both temperature and external electric fields. It has therefore been the focus of numerous studies.
Different techniques including dielectric spectroscopy, Cross (1987); Colla et al. (1998) Raman scattering, Welsch et al. (2009); Ohwa et al. (1998, 1999); Siny et al. (2000) and piezoelectric force microscopy Lehnen et al. (2001); Shvartsman and Kholkin (2004) have been used to explore the behavior of PNR in relaxor systems. Yet the most effective and direct probe of PNR within bulk relaxor samples is arguably obtained through measurements of the corresponding diffuse scattering, which reflects the presence of short-range ordered, atomic displacements. Xu (2010) Many neutron Xu et al. (2004a); Vakhrushev et al. (1995); Hirota et al. (2002); Hiraka et al. (2004); Hlinka et al. (2003); Gvasaliya et al. (2004); La-Orauttapong et al. (2003); Dkhil et al. (2001); Jeong et al. (2005) and x-ray diffuse You and Zhang (1997); Takesue et al. (2001); Xu et al. (2006a) scattering studies have been performed to determine the structure, polarization, and other properties of PNR. It has been shown that the diffuse scattering in pure PMN, PZN, and their solid solutions with low PbTiO3 (PT) doping, exhibits very similar behavior. Xu et al. (2004b); Matsuura et al. (2006) In all cases, the diffuse scattering intensities are strongly anisotropic, varying with Brillouin zone, and can be affected by an external electric field. Most neutron and x-ray diffuse scattering studies also agree that the diffuse scattering in both PMN-PT and PZN-PT systems extends preferentially along in reciprocal space. This diffuse scattering is rod-shaped but adopts an “X” or butterfly shape when measured in the (HK0) scattering plane near reflections of the form . Detailed analysis indicates that the butterfly-shaped diffuse scattering is associated with short-range ordered, ionic displacements oriented along Xu et al. (2004b) and couples strongly to transverse acoustic (TA) phonons propagating along (TA2 modes). Xu et al. (2008); Stock et al. (2005) For this reason we shall refer to it as “T2-diffuse scattering” in this article. The T2-diffuse scattering intensities come from PNR composed of ionic displacements that are neither purely strain (no relative changes between A, B, and O site positions) nor purely polar (only relative changes between A, B, and O site positions), which suggests that the local atomic structure both within and around the PNR is very complicated. Xu et al. (2006b)
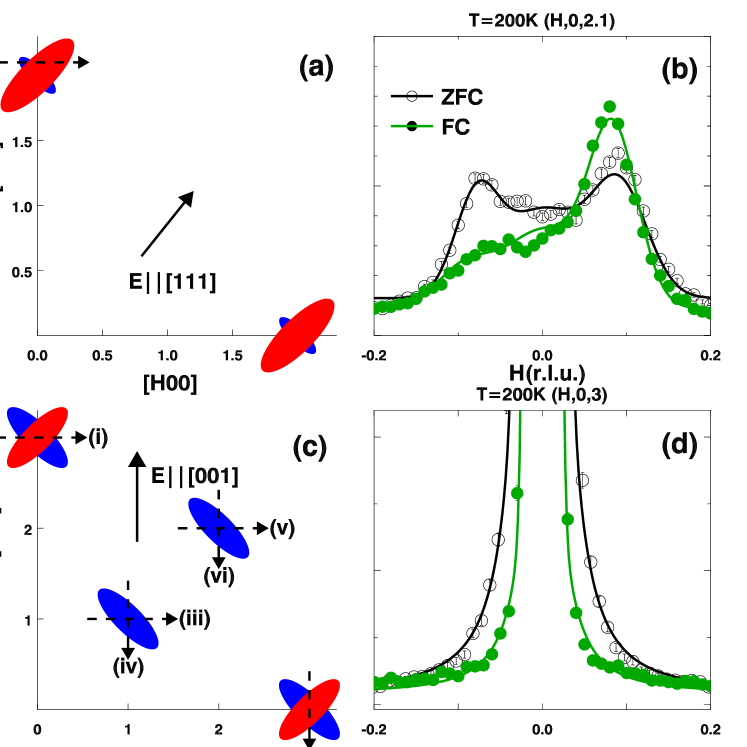
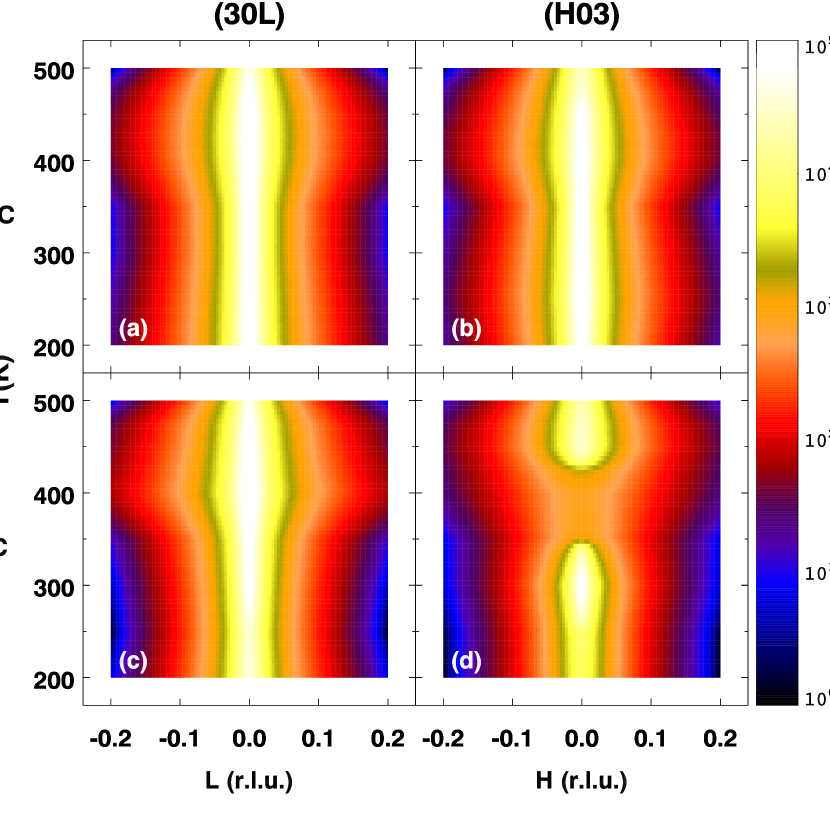
When an external electric field is applied along [111], the T2-diffuse scattering intensities are redistributed between different rods of diffuse scattering, while the overall diffuse scattering intensity appears to be conserved [see panels (a) and (b) of Fig. 1]. Xu et al. (2006a) However when an external field is applied along [001], the T2-diffuse scattering is essentially unchanged. Wen et al. (2008) At the same time, there is evidence that suggests the presence of another type of diffuse scattering different from the T2-diffuse scattering. For example, Gehring et al. found that the diffuse scattering measured in PZN-8%PT near (003) along [100], i. e. in a transverse direction, is strongly suppressed by an external [001] field, whereas that measured near (300) along [001] remains unaffected. Gehring et al. (2004) This effect has been confirmed in our measurements on PZN-4.5%PT [see panels (c) and (d) of Fig. 1] and cannot be explained by a simple redistribution of the T2-diffuse scattering.
In this article we report diffuse scattering measurements made under a [001]-oriented electric field on the relaxor ferroelectric PZN-4.5%PT at reduced wavevectors offset from various Bragg peaks along in the (H0L) zone [refer to the dashed lines in panel (c) of Fig. 1]. We show that, in addition to the T2-diffuse scattering, which dominates the total diffuse scattering intensity in most cases, there is another component of diffuse scattering which is primarily distributed along . We shall refer to this component as “T1-diffuse scattering” because of its similarities in both polarization and propagation direction to that of T1 phonon modes in perovskite systems. The application of a [001] electric field has no obvious effect on the T1-diffuse scattering which is associated with short-range ordered, ionic displacements polarized along [100], but strongly suppresses the diffuse scattering which is associated with short-range ordered, ionic displacements polarized along [001]. This effect is most prominent at temperatures slightly below K. In addition, spin-echo measurements performed on the same sample show that the diffuse scattering has a large dynamic component at high temperature (550 K), which gradually freezes and becomes almost fully static at 200 K.
II Experimental Details
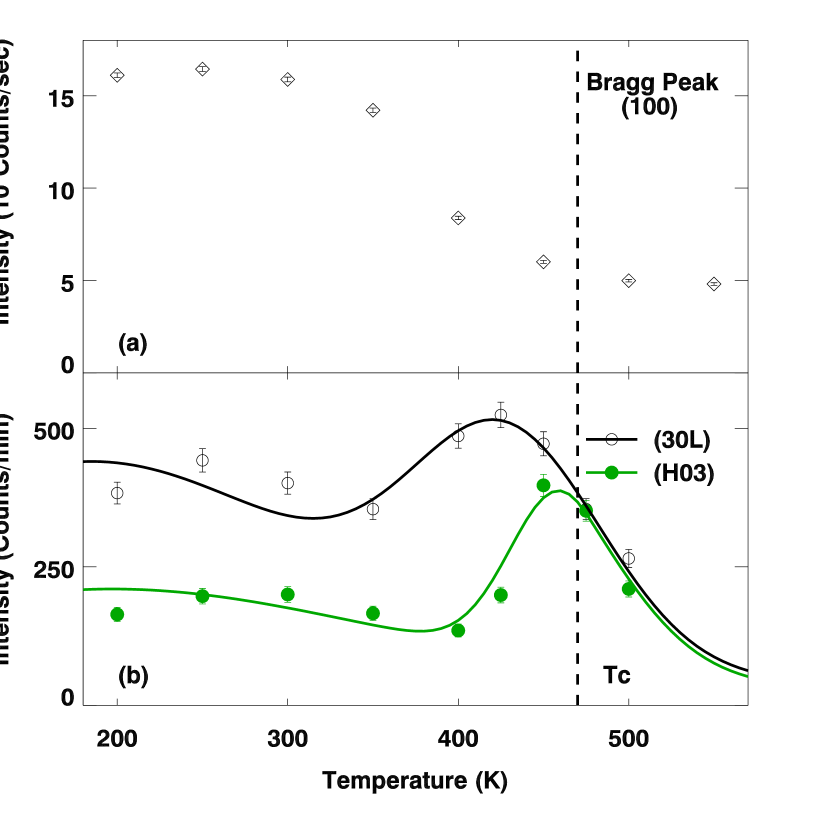
The sample used in our experiment is a PZN-4.5%PT single crystal purchased from TRS ceramics. The crystal is rectangular with {100} cut surfaces and dimensions of 10103 mm3. The sample has a cubic lattice spacing of Å at 300 K; thus 1 rlu (reciprocal lattice unit) equals Å-1. Cr/Au electrodes were sputtered onto the two largest opposing crystal surfaces. The Curie temperature of this compound K, which is accompanied by a strong release of extinction that is visible at the (100) Bragg peak and shown in panel (a) of Fig. 2. Neutron diffuse scattering measurements were performed on the BT-9 triple-axis spectrometer located at the NIST Center for Neutron Research (NCNR). We used horizontal beam collimations of 40′-47′-sample-40′-80′ and a fixed final neutron energy of 14.7 meV (Å). Two pyrolytic graphite filters were placed before and after the sample to minimize the presence of neutrons with higher-order wavelengths. An external electric field kV/cm was applied along [001] above 550 K during all of the field-cooled (FC) measurements.
Neutron spin-echo measurements were performed on the NG-5 NSE spectrometer, also located at the NCNR. The experiment was performed at the scattering vector =(0.05,0,1) ( Å-1) and at a neutron wavelength Å for all time scales. The instrumental resolution was measured with the sample cooled to 40 K where all dynamical processes occurring on instrumentally accessible time scales are assumed to be frozen.
III Results and Discussion
III.1 Evidence of the T1-diffuse scattering component
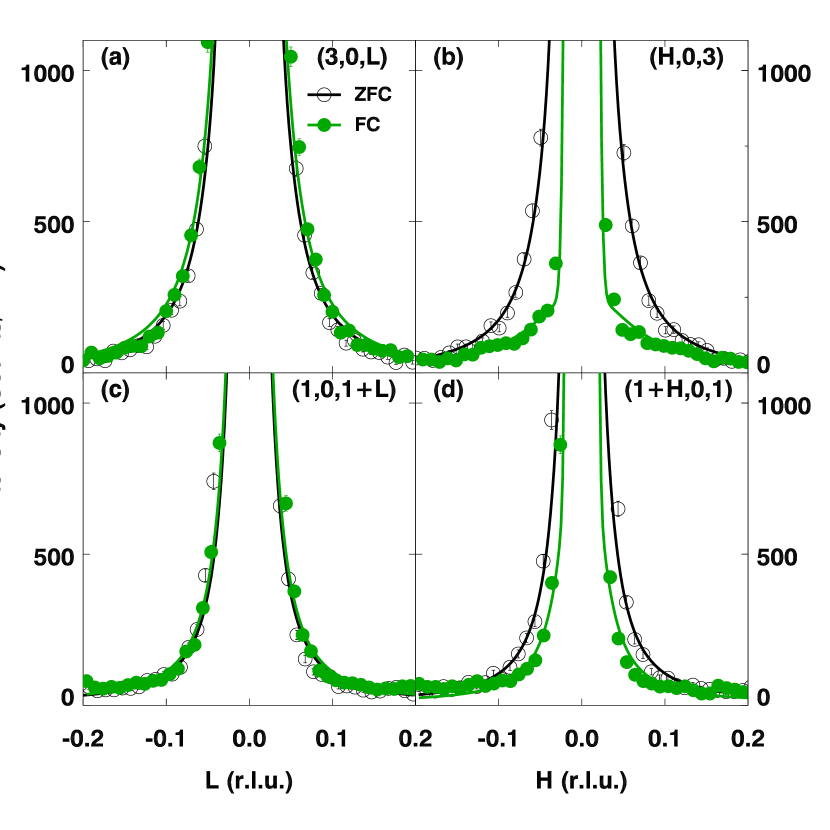
Our study of the T1-diffuse scattering was conducted by performing a series of linear -scans, represented by the dashed arrows drawn in panel (c) of Fig. 1, under both field-cooled (FC) and zero-field-cooled (ZFC) conditions around the (300), (003), (202), and (101) Bragg peaks. Diffuse scattering intensities measured at (3,0,0.06) and (-0.06,0,3) are plotted in panel (b) of Fig. 2. The temperature dependence similar to that reported for the T2-diffuse scattering in that the diffuse scattering increases with cooling and saturates at low temperature. The peak observed near is most likely the result of the critical scattering that appears near the structural phase transition; similar behavior was observed by Stock et al. in PZN. Stock et al. (2004) Linear -scans of the diffuse scattering intensity measured at 400 K under both FC and ZFC conditions are plotted in Fig. 3. It is immediately clear that the diffuse scattering intensities are suppressed around (003) after field cooling whereas no such change occurs around (300); this effect is also evident in panel (b) of Fig. 2. These results are consistent with those obtained previously on PZN-8PT. Gehring et al. (2004) At this point it is important to recall that the neutron diffuse scattering cross section resulting from correlated ionic displacements is proportional to , where is a unit vector along the displacement direction (for a more detailed discussion see Section. III.3). Therefore measurements of the diffuse scattering intensity made near (300) are mainly sensitive to short-range ordered ionic displacements oriented along [100] while those made near (003) reflect the presence of ordered ionic displacements oriented along [001]. The data shown in Fig. 3 therefore suggests that the short-range ordered ionic displacements oriented along [001] are significantly suppressed by an external electric field applied along [001]. This scattering is what we refer to as T1-diffuse scattering.
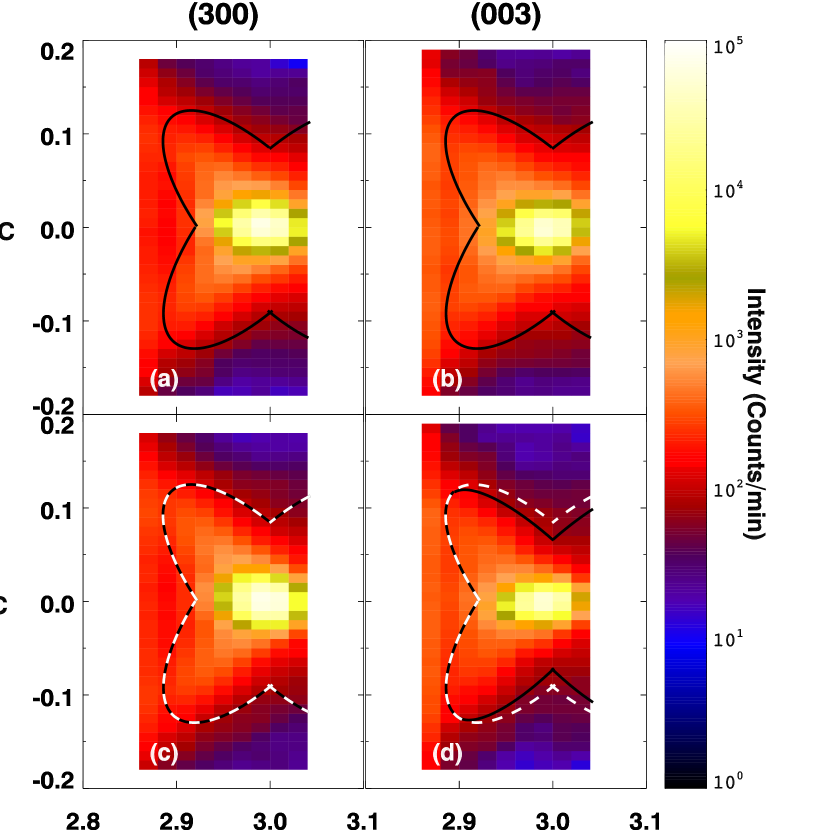
Mesh scans were also performed to map out the geometry of the diffuse scattering intensity distributions around various Bragg peaks under different conditions. The resulting intensity contours measured near (300) and (003) at 400 K are displayed in Fig. 4. The white, dashed lines shown in panels (c) and (d) of Fig. 4 are guides to the eye that describe the shape of constant diffuse scattering intensity contours (which include both T1 and T2 components) under ZFC conditions , as shown in panels (a) and (b). The corresponding intensity contour maps measured under FC conditions are shown in panels (c) and (d). Near (300), the FC mesh scan reveals a shape that is very similar to that obtained under ZFC conditions; however the one measured near (003) appears to be slightly narrower, but only in the direction transverse ([100]) to the scattering vector . This asymmetry is important because it implies that the T1-diffuse scattering associated with short-range ordered [001] ionic displacements is distributed primarily along the transverse direction ([100]) near (003) but not longitudinally (i.ẽ. not along [001]). This is why we call this scattering “T1-diffuse scattering”; both its polarization and distribution in -space resemble that of the T1 phonon mode. On the other hand, the butterfly-shaped T2-diffuse scattering, which is strongly affected by an electric field applied along [111], is not affected by an electric field applied along [001]. Apparently the T2-diffuse scattering dominates the diffuse scattering intensity measured at most values; the presence of the T1-diffuse scattering component only becomes evident through a change in its intensity once an external electric field is applied along [001].
Our measurements near (300) and (003) suggest that an [001]-oriented electric field can only reduce the diffuse scattering intensities associated with ionic displacements that are parallel to the field. To test this idea further, we studied the diffuse scattering intensity near (101) as well. Unlike the situation near (300) and (003), both [100] and [001]-oriented atomic displacements/polarizations will contribute to the overall neutron diffuse scattering cross section near (101) because then . Linear scans made along the ([001]) and ([100]) directions near (101) are shown in panels (c) and (d) of Figs. 3. As shown in panel (d) of Fig. 3, the field suppresses the diffuse scattering intensity distributed along , which must come from ionic displacements oriented along [001], as was the case for the T1-diffuse scattering measured near (003). By symmetry there must also be diffuse scattering associated with ionic displacements oriented along [100], which is distributed along q. However, as was the case near (300), this part of the T1-diffuse scattering is not affected by the external [001] field as is shown in panel (c) of Fig. 3.
The temperature dependence of the field-induced suppression of the T1-diffuse scattering is shown in Fig. 5. Transverse -scans across (300) and (003) were measured between 200 K and 500 K. These scans were fit to a resolution-limited Gaussian function of , used to describe the Bragg peak intensity, and a broad Lorentzian function of , which describes the diffuse scattering intensity. In Fig. 5 only the fitted diffuse scattering intensities are plotted versus temperature and and converted into color contour maps. There are only tiny differences between the ZFC (see panel (a)) and FC (see panel (c)) measurements made near (300); however the diffuse scattering intensities near (003) shown in panel (d) are strongly suppressed in the FC condition for compared to those measured under ZFC conditions (panel (b)). This suppression seems to be largest for temperatures between and K, and becomes less pronounced at lower temperatures. This can be understood if the PNR gradually freeze with cooling and become harder to be influenced by an external field.
III.2 Static versus dynamic origin of the T1-diffuse scattering component
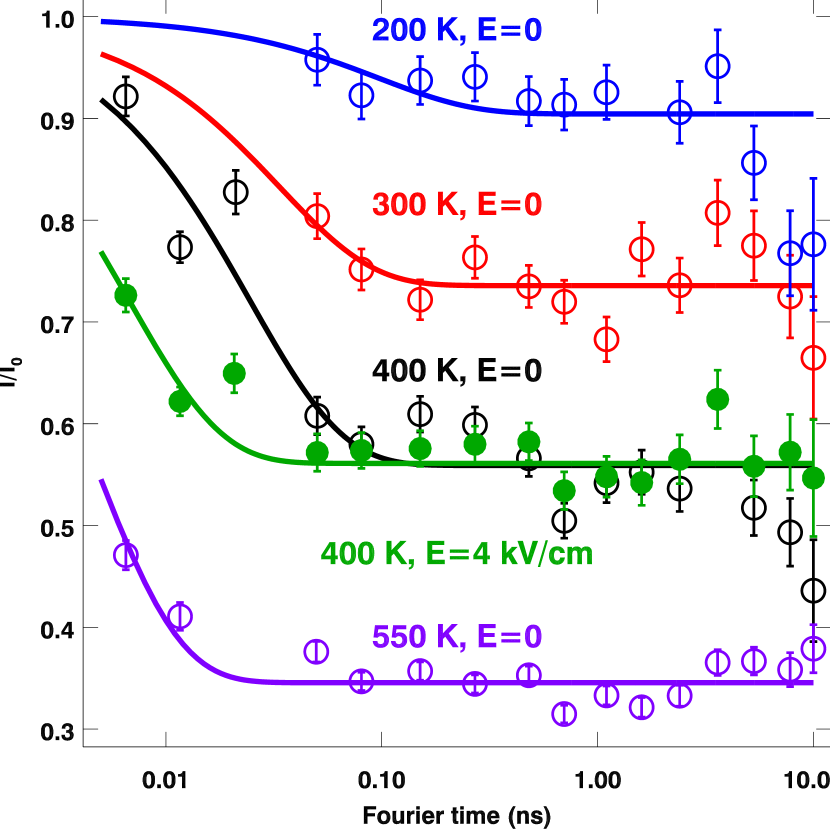
Another question that has yet to be answered is whether PNR have a static or dynamic origin. Previous work using cold neutron spectrometers, which provide significantly better energy resolution than do thermal neutron spectrometers, have shown that the onset of elastic (static) diffuse scattering occurs at much lower temperatures than previously believed, i. e. well below the Burns temperature . Hiraka et al. (2004); Rotaru et al. (2008); Gehring et al. (2009); Stock et al. (2010) These results imply that at high temperature the diffuse scattering is (at least partially) dynamic in nature. In order to better probe the energy/time scale of the diffuse scattering, we have performed spin-echo measurements on the same PZN-4.5%PT single crystal at the reciprocal lattice point (0.05,0,1.0) at different temperatures. The diffuse scattering intensities shown in Fig. 6 have been corrected for the instrumental resolution and plotted in the form of versus Fourier time . These intensity plots can in fact provide information on how much of the total diffuse scattering at this Q is static. One sees that at high temperature ( K), the diffuse scattering intensity decays to within ns. In other words, less than 40% of the diffuse scattering is static, while the rest of the intensity is dynamic in nature having a relaxation time less than ns (see Eqn. 1), which corresponds to an energy half width of meV. On cooling the relative size of the static diffuse scattering component increases, which is consistent with freezing of the PNR. At 200 K, the diffuse scattering is almost completely static (). These results are qualitatively similar to those obtained on pure PMN by Stock et al. Stock et al. (2010)
We have also studied the effect of an external field along [001] on the diffuse scattering measured at 400 K. At (0.05,0,1) we should be sensitive to the T1-diffuse scattering associated with [001] ionic displacements, which should be partially suppressed by the [001] field. We find that, although the overall diffuse scattering intensity is reduced by the field, the static ratio at large Fourier times is not affected. However, the dynamic component decays much faster when the sample is FC compared to ZFC. The lines through the data shown in Fig. 6 are based on fits to a one parameter decay function
| (1) |
In Table 1, we list the temperature dependence of these parameters, including the static fraction , and the relaxation time , as well as the energy half width at half maximum . At 400 K, ns under ZFC conditions and ns under FC conditions. These values correspond to energy widths of meV (ZFC) and meV (FC), respectively.
| 550 K | FC 400 K | ZFC 400 K | 300 K | 200 K | |
|---|---|---|---|---|---|
| Static fraction (S/) | 35 | 56 | 56 | 74 | 90 |
| Relaxation time (/ns) | 0.0042 | 0.0068 | 0.025 | 0.033 | 0.097 |
| Energy width (E/meV) | 0.16 | 0.1 | 0.027 | 0.02 | 0.007 |
Although we have obtained the relative fraction of the static portion of the diffuse scattering intensity in PZN-4.5%PT, it is clear that these spin-echo measurements do not provide the best time/energy scale to probe the relaxation time of the dynamic component of the diffuse scattering. To get better results one would need to perform measurements with energy resolution of about 20 eV. Future measurements using the neutron backscattering technique are being planned for this purpose.
III.3 Short-range correlated ionic displacements associated with the T1-diffuse scattering
In general, the diffuse scattering intensity coming from a single source at near the Bragg peak G can be approximately described by Xu et al. (2006b)
| (2) |
Here is a scale factor. is the Fourier transform of the real space shape of the PNR and describes the shape of the diffuse scattering intensity distribution around a Bragg peak. This term is in principle independent of Brillouin zone. is the diffuse scattering structure factor and is Brillouin zone dependent; it can be written as:
| (3) |
where , and are the ionic displacement vector, neutron scattering length, and the lattice position of the th atom in the unit cell, respectively, and is the Debye-Waller factor.
Many sources contribute to the total neutron diffuse scattering cross section in relaxors. In the case of PZN-4.5%PT these include six polarization directions and three polarization directions associated with the T2 and T1-diffuse scattering cross sections, respectively. It is very difficult to determine the absolute intensity of the T1-diffuse scattering directly because it coexists with the much stronger T2-diffuse scattering. However, we have shown that a [001]-oriented electric field can suppress portion of the T1-diffuse scattering intensity that is specifically associated with [001]-oriented ionic displacements while leaving that associated with [100] and [010] ionic displacements (and the T2-diffuse scattering) unaffected. One can then exploit this fact and measure the change in the T1-diffuse scattering cross section in different Brillouin zones to determine the corresponding structure factor and solve for the relative magnitudes of the ionic shifts that contribute to the T1-diffuse scattering. If one assumes that the Debye-Waller factor does not vary appreciably with Brillouin zone, then one can simplify Eqn. 3 to Xu et al. (2004a)
| (4) |
where, again, is the unit vector along the ionic displacement (polarization) direction.
As discussed in section III.1, the T1-diffuse scattering associated with short-range ordered, [001]-oriented, ionic displacements is distributed along [100] across each Bragg peak in the (H0L) plane. We therefore chose to measure T1-diffuse scattering intensities at the reciprocal lattice positions , , and . The differences between ZFC and FC measurements made at rlu, shown in Table. 2, are then used as the relative structure factors for the T1-diffuse scattering cross section. Here we have assumed that the electric field does not affect the structure factors. This is equivalent to the assumption that the electric field reduces the T1-diffuse scattering uniformly independent of Brillouin zone. Knowing at different Bragg peaks, one can solve for the average Pb, Zn/Nb/Ti, and O displacements in the unit cell that contribute to the T1-diffuse scattering. Similar to what was done in Ref. Xu et al., 2006b, we neglect any possible distortion or rotation of the oxygen octahedra and assume that all six oxygens in one unit cell move as a unit. The relative ionic shifts that contribute to the T1-diffuse scattering intensities are listed in Table. 3. In Table. 3 we have decomposed these ionic shifts into different components, i. e. one acoustic/strain component that corresponds to the uniform phase shift in which all atoms in the unit cell move together, Hirota et al. (2002) and two optic components that correspond to the Slater and Last modes Shirane et al. (1970); Xu et al. (2006b) where the atoms in the unit cell only move relative to each other with no change in the center of mass. Apparently, as was the case for the T2-diffuse scattering, the local ionic displacements that give rise to the T1-diffuse scattering also consist of both acoustic/strain and optic/polar components.
We have also examined the T2-diffuse scattering intensity by making measurements at reduced wavevectors offset from various Bragg peaks. The structure factors and ionic displacements contributing to the T2-diffuse scattering obtained from our PZN-4.5%PT sample are very similar to those obtained previously for PZN-8%PT (see Tables I and II in Ref. Xu et al., 2006b). We can therefore compare the local ionic structures that give rise to the T1-diffuse scattering to those that produce the T2-diffuse scattering. We find that the ionic displacements associated with the T1-diffuse scattering have a larger optic component; note that the shifts for the Zn/Nb/Ti site associated with the T1-diffuse scattering are larger than those associated with the T2-diffuse scattering in Ref. Xu et al., 2006b. Previous work has shown that the T2-diffuse scattering is coupled strongly to transverse acoustic phonons and strains in relaxor systems, Xu et al. (2008); Stock et al. (2005) but not with the soft transverse optic (TO) phonon. We expect that this situation could be different for the T1-diffuse scattering, which may in fact couple more strongly to the soft TO phonon because it has a larger optic component. This will of course need to be verified by future experiments.
| (300) | (202) | (101) | |
|---|---|---|---|
| 9 | 8 | 2 | |
| 500 K | 13 | 4 | 9 |
| 400 K | 320 | 72 | 115 |
| 300 K | 154 | 1 | 67 |
| 200 K | 193 | 0 | 75 |
| Shift | Slater | Last | ||||
|---|---|---|---|---|---|---|
| 500 K | 1.0 | 0.54 | -0.44 | 0.68 | -0.60 | -0.52 |
| 400 K | 1.0 | 0.22 | -0.33 | 0.63 | -0.34 | -0.62 |
| 300 K | 1.0 | 0.35 | -0.61 | 0.62 | -0.59 | -0.63 |
| 200 K | 1.0 | 0.30 | -0.65 | 0.60 | -0.58 | -0.65 |
IV Summary
Our neutron scattering measurements clearly show that in addition to the well-known butterfly-shaped diffuse scattering, a second, distinct, diffuse scattering component also exists in the PZN-PT relaxor system. This so-called T1-diffuse scattering can be differentiated from the butterfly-shaped T2-diffuse scattering through its dependence on an -oriented electric field. Quantitative analysis of the short-range ordered, -oriented, ionic displacements associated with the T1-diffuse scattering suggest that both acoustic/strain and optic/polar ionic displacements are present, a situation that is very similar to that for the T2-diffuse scattering. Spin-echo measurements also show that the diffuse scattering cross section exhibits a large dynamic component at high temperature paraelectric phase above and gradually freezes, becoming almost entirely static for temperatures well below in the ferroelectric phase.
The electric field dependence of the T1 and T2-diffuse scattering cross sections are quite different; this implies that they might originate from independent nano-scale polar structures. On the other hand, they are very similar in many other aspects: both exhibit strain/polar components and both freeze with cooling. This raises another scenario in which the two diffuse scattering components might be associated within different and components of the ionic displacements with the same nano-scale polar structure. The average local atomic shifts in these nano-scale structures could very well be along other directions, e.g., along directions as suggested by neutron Pair Distribution Function (PDF) measurements from PMN Jeong et al. (2005). The neutron diffuse scattering intensities that we observe here arise only from one or more components of these local displacements that become spatially short-range ordered. Any components of atomic displacements that are entirely disordered will only contribute to the overall background and will not affect the diffuse scattering intensities discussed in this work. Our data do not allow us to determine definitively which scenario is correct, thus more detailed studies are clearly required. However, our results do strongly suggest that when studying PNR in relaxor systems, the existence of complex nano-scale polar structures composed of both and -oriented ionic displacements will have to be carefully taken into consideration; indeed, these may affect the lifetimes of phonons propagating along these two sets of directions.
V Acknowledgments
We wish to thank W. Ratcliff, S. M. Shapiro, and S. B. Vakhrushev for useful discussions. Financial support from the US Department of Energy under contract No. DE-AC02-98CH10886 and the Natural Science and Engineering Research Council of Canada (NSERC) is also gratefully acknowledged. The identification of any commercial product or trade name does not imply endorsement or recommendation by the National Institute of Standards and Technology.
References
- Park and Shrout (1997) S. E. Park and T. R. Shrout, J. Appl. Phys. 82, 1804 (1997).
- Uchino (1996) K. Uchino, Piezoelectric actuators and ultrasonic motors (1996).
- Service (1997) R. F. Service, Science 275, 1878 (1997).
- Cross (1987) L. E. Cross, Ferroelectrics 76, 241 (1987).
- Burton et al. (2006) B. P. Burton, E. Cockayne, S. Tinte, and U. V. Waghmare, Phase Transitions: A Multinational Journal 79, 91 (2006).
- Kuwata et al. (1981) J. Kuwata, K. Uchino, and S. Nomura, Ferroelectrics 37, 579 (1981).
- Burns and Dacol (1983) G. Burns and F. H. Dacol, Phys. Rev. B 28, 2527 (1983).
- Gehring et al. (2009) P. M. Gehring, H. Hiraka, C. Stock, S. H. Lee, W. Chen, Z. G. Ye, S. B. Vakhrushev, and Z. Chowdhuri, Phys. Rev. B 79, 224109 (2009).
- Matsuura et al. (2006) M. Matsuura, K. Hirota, P. M. Gehring, Z.-G. Ye, W. Chen, and G. Shirane, Phys. Rev. B 74, 144107 (2006).
- Xu et al. (2008) G. Xu, J. Wen, C. Stock, and P. M. Gehring, Nature Mater 7, 562 (2008).
- Colla et al. (1998) E. V. Colla, N. K. Yushin, and D. Viehland, J. Appl. Phys. 83, 3298 (1998).
- Welsch et al. (2009) A. M. Welsch, B. Mihailova, M. Gospodinov, R. Stosch, B. Guttler, and U. Bismayer, J. Phys.: Condens. Matter 21, 235901 (2009).
- Ohwa et al. (1998) H. Ohwa, M. Iwata, N. Yasuda, and Y. Ishibashi, Jpn. J. Appl. Phys. 37, 5410 (1998).
- Ohwa et al. (1999) H. Ohwa, M. Iwata, N. Yasuda, and Y. Ishibashi, Ferroelectrics 229, 147 (1999).
- Siny et al. (2000) I. G. Siny, E. Husson, J. M. Beny, S. G. Lushnikov, E. A. Rogacheva, and P. P. Syrnikov, Ferroelectrics 248, 57 (2000).
- Lehnen et al. (2001) P. Lehnen, W. Kleemann, T. Woike, and R. Pankrath, Phys. Rev. B 64, 224109 (2001).
- Shvartsman and Kholkin (2004) V. V. Shvartsman and A. L. Kholkin, Phys. Rev. B 69, 014102 (2004).
- Xu (2010) G. Xu, J. Phys. Soc. Jpn. 79, 011011 (2010).
- Xu et al. (2004a) G. Xu, Z. Zhong, Y. Bing, Z.-G. Ye, C. Stock, and G. Shirane, Phys. Rev. B 70, 064107 (2004a).
- Vakhrushev et al. (1995) S. B. Vakhrushev, A. A. Naberezhnov, N. M. Okuneva, and B. N. Savenko, Phys. Solid State 37, 1993 (1995).
- Hirota et al. (2002) K. Hirota, Z. G. Ye, S. Wakimoto, P. M. Gehring, and G. Shirane, Phys. Rev. B 65, 104105 (2002).
- Hiraka et al. (2004) H. Hiraka, S. H. Lee, P. M. Gehring, G. Xu, and G. Shirane, Phys. Rev. B 70, 184105 (2004).
- Hlinka et al. (2003) J. Hlinka, S. Kamba, J. Petzelt, J. Kulda, C. A. Randall, and S. J. Zhang, J. Phys. Condens. Matter 15, 4249 (2003).
- Gvasaliya et al. (2004) S. N. Gvasaliya, S. G. Lushnikov, and B. Roessli, Phys. Rev. B 69, 092105 (2004).
- La-Orauttapong et al. (2003) D. La-Orauttapong, J. Toulouse, Z.-G. Ye, W. Chen, R. Erwin, and J. L. Roberston, Phys. Rev. B 67, 134110 (2003).
- Dkhil et al. (2001) B. Dkhil, J. M. Kiat, G. Calvarin, G. Baldinozzi, S. B. Vakhrushev, and E. Suard, Phys. Rev. B 65, 024104 (2001).
- Jeong et al. (2005) I. K. Jeong, T. W. Darling, J. K. Lee, T. Proffen, R. H. Heffner, J. S. Park, K. S. Hong, W. Dmowski, and T. Egami, Phys. Rev. Lett. 94, 147602 (2005).
- You and Zhang (1997) H. You and Q. M. Zhang, Phys. Rev. Lett. 79, 3950 (1997).
- Takesue et al. (2001) N. Takesue, Y. Fujii, and H. You, Phys. Rev. B 64, 184112 (2001).
- Xu et al. (2006a) G. Xu, Z. Zhong, Y. Bing, Z. G. Ye, and G. Shirane, Nature Mater 5, 134 (2006a).
- Xu et al. (2004b) G. Xu, Z. Zhong, H. Hiraka, and G. Shirane, Phys. Rev. B 70, 174109 (2004b).
- Stock et al. (2005) C. Stock, H. Luo, D. Viehland, J. F. Li, I. P. Swainson, R. J. Birgeneau, and G. Shirane, J. Phys. Soc. Jpn. 74, 3002 (2005).
- Xu et al. (2006b) G. Xu, P. M. Gehring, and G. Shirane, Phys. Rev. B 74, 104110 (2006b).
- Wen et al. (2008) J. Wen, G. Xu, C. Stock, and P. M. Gehring, Appl. Phys. Lett. 93, 082901 (2008).
- Gehring et al. (2004) P. M. Gehring, K. Ohwada, and G. Shirane, Phys. Rev. B 70, 014110 (2004).
- Stock et al. (2004) C. Stock, R. J. Birgeneau, S. Wakimoto, J. S. Gardner, W. Chen, Z. G. Ye, and G. Shirane, Phys. Rev. B 69, 094104 (2004).
- Rotaru et al. (2008) G.-M. Rotaru, S. N. Gvasaliya, B. Roessli, S. Kojima, S. G. Lushnikov, and P. Gunter, Appl. Phys. Lett. 93, 032903 (2008).
- Stock et al. (2010) C. Stock, L. V. Eijck, P. Fouquet, M. Maccarini, P. Gehring, G. Xu, H. Luo, X. Zhao, J.-F. Li, and D. Viehland, arXiv:1002.0716v1 (2010).
- Shirane et al. (1970) G. Shirane, J. D. Axe, and J. Harada, Phys. Rev. B 2, 155 (1970).