Hot Gas Halos in Early-Type Field Galaxies
Abstract
We use Chandra and XMM-Newton to study the hot gas content in a sample of field early-type galaxies. We find that the LX–LK relationship is steeper for field galaxies than for comparable galaxies in groups and clusters. The low hot gas content of field galaxies with L suggests that internal processes such as supernovae driven winds or AGN feedback expel hot gas from low mass galaxies. Such mechanisms may be less effective in groups and clusters where the presence of an intragroup or intracluster medium can confine outflowing material. In addition, galaxies in groups and clusters may be able to accrete gas from the ambient medium. While there is a population of L galaxies in groups and clusters that retain hot gas halos, some galaxies in these rich environments, including brighter galaxies, are largely devoid of hot gas. In these cases, the hot gas halos have likely been removed via ram pressure stripping. This suggests a very complex interplay between the intragroup/intracluster medium and hot gas halos of galaxies in rich environments with the ambient medium helping to confine or even enhance the halos in some cases and acting to remove gas in others. In contrast, the hot gas content of more isolated galaxies is largely a function of the mass of the galaxy, with more massive galaxies able to maintain their halos, while in lower mass systems the hot gas escapes in outflowing winds.
1 Introduction
It has been known since the mid-1980’s that hot gas halos are common in early-type galaxies (Forman et al., 1985). From the earliest studies with Einstein, it was apparent that the X-ray luminosity of early-type galaxies is correlated with the stellar luminosity (Forman et al., 1985; Trinchieri & Fabbiano, 1985; Canizares et al., 1987). The correlation between these two quantities suggests that the origin of the hot gas must be related to the stellar content of the galaxy. It is generally believed that the hot gas originates from stellar mass lost from evolved stars and planetary nebula (Mathews, 1990; Mathews & Brighenti, 2003; Bregman & Parriott, 2009). However, the scatter in the LX-LB relationship is very large. Since the B band can be strongly affected by both recent star formation and dust, it may not be a good measure of the true stellar content of a galaxy in some cases. The large scatter in the relationship remains, however, when LK is used as a proxy for stellar light (Ellis & O’Sullivan, 2006), suggesting the scatter is dominated by variations in the X-ray properties of galaxies. The large range in X-ray luminosity for a given stellar luminosity could be due to either intrinsic differences in galaxy properties or environmental effects.
There has been considerable effort by the astronomical community to understand the scatter in the LX-LB and LX-LK relationships with different authors often reaching opposing conclusions. For example, some authors have found evidence for the X-ray luminosities of early-type galaxies to vary with environment (White & Sarazin, 1991; Brown & Bregman, 2000), while others find no such trend (O’Sullivan et al., 2001; Helsdon et al., 2001; Ellis & O’Sullivan, 2006). One problem that plagued these earlier studies was the inability to cleanly separate out the thermal emission in galaxies from other contributions to the X-ray emission. In particular, the contribution of X-ray binaries and an active galactic nucleus (AGN) can be substantial in some galaxies. The broader bandpasses and superior spatial resolution of Chandra and XMM-Newton allow a much cleaner measurement of the thermal gas component than was possible with earlier telescopes (Kim & Fabbiano, 2003; Diehl & Statler, 2007).
The superb spatial resolution of Chandra is also important because it allows one to separate out an individual galaxy’s hot gas halo from the more extended intragroup or cluster medium. Recent studies of early-type galaxies in groups and clusters indicate that a large fraction of such galaxies retain their hot gas halos even in these dense environments (Sun et al., 2007; Jeltema et al., 2008; Sun, 2009). The presence of hot gas halos in group and cluster galaxies has important consequences for galaxy evolution. In nearly all models of galaxy formation, the condensation of hot halo gas is a primary driver for the build up of massive galaxies (White & Frenk, 1991; Cole et al., 2000; Bower et al., 2006). Since the pioneering work of White & Frenk (1991), it has generally been assumed that a galaxy’s hot gas halo is stripped completely when a galaxy enters a group or cluster. With the hot gas halo removed, there is no new source for gas and the star formation rate quickly declines and the galaxy becomes red. The Chandra observations of hot gas halos in groups and clusters demonstrate that the assumption of complete stripping is overly simple. Some authors have started to incorporate more sophisticated stripping prescriptions in to the semi-analytic models and a more realistic treatment of the hot gas appears to alleviate some problems that were present in the earlier versions of the models (Kang & van den Bosch, 2008; McCarthy et al., 2008; Font et al., 2008).
To quantify the importance of stripping in groups and clusters, the properties of ellipticals in these rich environments must be compared to the properties of galaxies in environments where stripping is not important, i.e. the field. Jeltema et al. (2008) attempted to make this comparison and found that group and cluster galaxies appear to be X-ray-faint compared to field galaxies. However, this result was based on ROSAT observations of field galaxies, so the contribution of X-ray binaries and AGN had to be estimated. In this Letter, we use Chandra and XMM-Newton observations of field early-type galaxies to cleanly measure their hot gas content for the first time. We then compare the X-ray properties of these field galaxies to similar galaxies in groups and clusters to study how environment impacts hot halos in galaxies. We adopt H0=70 km s-1 Mpc-1, M = 0.3 and Λ= 0.7 throughout this Letter.
2 The Sample
Our goal is to study the hot gas content in a sample of early-type galaxies outside of rich groups and clusters. We derive our sample from published catalogs of nearby field early-type galaxies (Colbert et al., 2001; Reda et al., 2004; Ellis & O’Sullivan, 2006; Memola et al., 2009). To verify isolation, we used NED to eliminate galaxies that are in cataloged groups and clusters or in close pairs. We also examined the field around each galaxy using the POSS to verify that there were no luminous neighbors uncataloged in NED. Adopting these criteria guarantee that these galaxies lie in low density environments quite unlike the X-ray luminous groups and clusters used in earlier studies (Sun et al., 2007; Jeltema et al., 2008). To ensure that the targets would be bright enough for study with Chandra and XMM-Newton, we restricted our sample to galaxies with redshifts less than z=0.03. Finally, we restrict our analysis to galaxies more luminous than Log LK = 10.5 to allow a direct comparison to the previously studied group and cluster samples. Applying these criteria results in a sample of 74 nearby field early-type galaxies. We observed five of these galaxies with Chandra and four with XMM-Newton. An additional eighteen galaxies have observations available in the Chandra and XMM-Newton archives. Several of the XMM-Newton observations suffered from severe flaring resulting in very short effective exposure times. Removing these objects results in a final sample of 23 galaxies with sufficient X-ray observations for our purposes (Table 1)
The Chandra data were prepared using standard reduction processing in CIAO 4.1.2 and CALDB 4.1.4 following the method described in Jeltema et al. (2008), while the XMM-Newton data were reduced using SAS 8.0.0 following the methods outlined in Jeltema et al. (2006). For both the Chandra and XMM-Newton data, we extract radial profiles to determine the extent of the X-ray emission. All of the galaxies in our sample are detected as extended sources. Spectra were then extracted using a circular aperture with radius equal to the maximum extent of the X-ray emission. Separate spectra were extracted for each of the three XMM-Newton EPIC cameras. A local background was determined in each case from a nearby source-free region.
All of the galaxies in our sample have enough counts to allow us to extract an X-ray spectrum. The spectral analysis was performed using XSPEC 12.5.1. We use an identical fitting procedure to that used in Jeltema et al. (2008) to allow a direct comparison between the properties of the hot gas in our field sample and their group sample. The method adopted by Jeltema et al. (2008) is virtually identical to the technique used by Sun et al. (2007) for rich clusters. The spectra were fit in the 0.5–7 keV band to allow a better determination of the contribution of X-ray binaries or a potential AGN component. For the spectral fits we adopt a two component spectral model consisting of a thermal MEKAL model and a powerlaw. The column density was fixed at the Galactic value and the gas metallicity fixed at a value of 0.8 solar. For sources with sufficient counts, we allow both the temperature and the photon index to vary. In cases where both components could not be constrained, we fix the photon index at 1.7. To compare with previous work, we report the luminosity of any detected thermal component in the 0.5-2 keV band. Errors on the luminosity were determined using Monte Carlo Markov chains. For a few galaxies, a single powerlaw with index 1.7 provides an adequate fit to the X-ray spectrum. In these cases, we derive an upper limit on any thermal component by first fitting the source spectrum to a power-law model and then adding a thermal component with the temperature fixed at 0.7 keV. The upper limit on the luminosity is set to the 3 upper limit of this thermal component.
3 The L Relationship for Field Galaxies
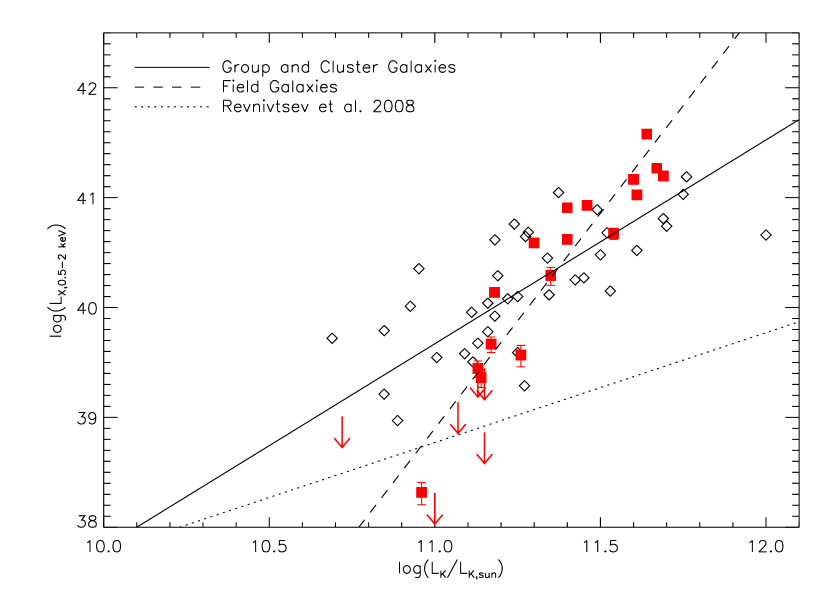
As we are able to extract a spectrum for every galaxy in our sample, we are able to measure the luminosity of the thermal component or calculate an upper limit for the thermal gas in each case. Figure 1 shows the L relation for our sample, where the LX measurement is for the thermal gas only. For comparison, we plot the same quantities for early-type galaxies from the cluster sample of Sun et al. (2007) and the group sample of Jeltema et al. (2008). We do not plot the upper limits for the group and cluster sample because in many cases the measurements represent the upper limit on the total X-ray luminosity and not the thermal component only. Using the bisector modification to the BCES method in Akritas & Bershady (1996), we derive the best-fit to the field galaxy L relation:
log(L0.5-2keV) = 38.90 + 3.92 log(LK/1011LK,⊙).
The upper limits have not been used in the fit. Including the upper limits results in a slightly steeper relationship. The best fit to the field galaxies is given by the dashed line in Figure 1, while the best fit to the combined group and cluster sample is shown by the solid line.
As can be seen from the Figure, a thermal component is detected in all field galaxies with K-band luminosities greater than Log LK 11.2. The X-ray luminosities of these galaxies are comparable to or slightly more luminous than their counterparts in groups and clusters. However, for galaxies with K-band luminosities less than Log LK 11.2, the field galaxies appear to deviate from the relationship found for the detected galaxies in groups and clusters. In particular, most of the field galaxies have lower thermal luminosities than galaxies detected in groups and clusters. The general behavior described above leads to a much steeper L relationship for field galaxies than for comparable galaxies in richer environments. For comparison, the slope of the L relationship for group and cluster galaxies is (Jeltema et al., 2008), which is different than the slope we derive for the field galaxies at greater than 5 significance. Therefore, our study appears to confirm that environment contributes significantly to the scatter seen in the L and L relationships. It is interesting to note that the stellar luminosity where the field galaxies transition from having detected hot halos to having little or no hot gas (Log LK 11.2) is close to the K-band value of L⋆ (LK⋆ = 1011.08 LK,⊙ Kochanek et al. (2001)). Therefore, even fairly massive field galaxies do not have significant hot gas halos.
The field galaxy L relation presented here based on Chandra and XMM-Newton data differs significantly from previous relationships based on ROSAT data, where all of the detected X-ray emission was assumed to be thermal (Ellis & O’Sullivan, 2006; Jeltema et al., 2008), having both a lower normalization and a steeper slope. This difference highlights the importance of separating out the different contributions to the X-ray emission. While there is little doubt that including a power law component in the spectral fits helps account for the contribution of X-ray binaries, there may still be some contribution to the X-ray emission from other stellar sources. In particular, the contribution of cataclysmic variables (CVs) and coronally active binaries (ABs) could be significant in the lower luminosity sources and it is difficult to spectrally separate this emission since its spectrum can be approximated by the combination of a thermal plasma and a powerlaw (Trinchieri et al., 2008; Revnivtsev et al., 2008). To estimate the importance of this effect, we have plotted the expected X-ray luminosity for these stellar populations as a function of the K-band luminosity in Figure 1 using the relationship derived by Revnivtsev et al. (2008) for early-type galaxies. As can be seen from Figure 1, the contribution of these stars can potentially account for all of the X-ray emission attributed to thermal gas in the lowest luminosity field galaxy we detect, NGC 3115. For the rest of the detected field galaxies, the contribution of CVs and ABs is unlikely to be significant. Given that the NGC 3115 thermal measurement may not be secure, we fit the L relationship with this galaxy removed. The resulting slope (3.54) is still significantly steeper than the group and cluster relationship.
4 Discussion
In the previous section we show that the L relation is steeper for field galaxies than for galaxies in groups and clusters. This result has important implications for the role of environment on the hot gas halos of galaxies. In particular, our study suggests there is a population of early-type galaxies with LK L⋆ in groups and clusters that retain substantial hot gas reservoirs, while their counterparts in the field are mostly devoid of gas.
The lack of a substantial hot gas component in field galaxies with LK L⋆ could reflect a fundamental difference in the global properties of field and group/cluster early-type galaxies. For example, previous studies of early-type galaxies have suggested a possible trend between the X-ray luminosity and the age of a galaxy estimated from dynamical or spectroscopic indicators (O’Sullivan et al., 2001), with luminous X-ray emission apparently restricted to galaxies with ages greater than a few Gyrs. These observations are consistent with a scenario where hot gas is initially removed during major mergers and the hot gas halos take several gigayears to build up (Cox et al., 2006). The difference between the field galaxies and those in richer environments could therefore reflect a difference in age. In fact, there is some indication from simulations that isolated ellipticals should be on average younger than their counterparts in groups and clusters (Niemi et al., 2010). However, Reda et al. (2004) have studied the stellar populations in several of the field galaxies in our sample and found that the bulk of the stars in these galaxies are very old. In fact, for the galaxies they studied, Reda et al. (2004) found that the formation epoch of field and cluster ellipticals appears similar. This suggests that age differences are unlikely to be the explanation for the observed differences in the hot gas content.
Another possibility is that field galaxies lack substantial dark matter halos and are therefore unable to keep X-ray halos (O’Sullivan & Ponman, 2004). Minimal dark matter halos have been implied for some elliptical galaxies from kinematic studies of planetary nebula at large radii (Romanowsky et al., 2003; Douglas et al., 2007). However, the low velocity dispersions derived from the planetary nebula could be due to halo stars on radial orbits and not small dark matter halos (Dekel et al., 2005). To explain the observed X-ray/optical relationships, dark matter halos of low LK ellipticals in groups and clusters would need to be more substantial than their counterparts in the field. However, one might naively expect the dark matter halos of ellipticals in groups and clusters to be reduced relative to those in the field since tidal stripping is much more likely in these denser environments. Thus, the differences in the scaling relations of field and group/cluster galaxies most likely do not reflect differences in the dark matter halos.
In addition to potential intrinsic differences between field and group/cluster early-types, environmental processes could be important. However, environmental processes that remove gas from galaxies (such as ram pressure stripping) are likely only important in richer environments, where there is a substantial intragroup or intracluster medium (Kawata & Mulchaey, 2008; Bekki, 2009). This suggests that internal processes must be responsible for removing hot gas from low mass field galaxies. Most likely gas has been expelled from these galaxies by stellar winds or AGN feedback. Detailed studies of low X-ray luminosity ellipticals have concluded that winds sustained by Type 1a supernovae are likely the dominant mechanism by which galaxies lose their hot gas, although AGN outbursts may also be important in some cases (David et al., 2006; Pellegrini et al., 2007; Trinchieri et al., 2008). In our field sample, there is little evidence for significant AGN activity. Approximately half of our sample galaxies are detected in radio continuum in the NVSS (Condon et al., 1998), but in nearly all cases the emission is very weak. However, the weak radio emission in our field sample does not necessarily mean that AGN feedback is not important in these systems, since there is little correlation between 1.4 GHz radio luminosity and disturbed X-ray morphologies (i.e. cavities) in many nearby ellipticals (Dong et al., 2010).
While supernovae or AGN driven outflows can explain the low hot gas content of field galaxies, such mechanisms may be less effective in groups and clusters where the presence of an ambient medium may stifle such winds (Babul & Rees, 1992; Murakami & Babul, 1999; Brown & Bregman, 1998, 2000). In addition, early-type galaxies in groups and clusters may be able to accrete gas from the intragroup or intracluster medium (Brighenti & Mathews, 1998, 1999; Brown & Bregman, 2000). The combination of these two effects likely accounts for the population of low LK group and cluster galaxies that still contain significant amounts of hot gas. There are several observations that could help test the relative importance of gas accretion from the ambient medium versus the suffocation of outflowing winds. If accretion of gas is the dominant mechanism by which low LK cluster galaxies maintain halos, we might expect the metallicity of the gas to be lower than if the gas is produced internally in the galaxies. Deeper X-ray observations of low LK group and cluster galaxies with halos should allow this test to be performed.
We note that the L relationships shown in Figure 1 were derived for galaxies with a detected hot gas halo. Given that it is more difficult to detect individual hot halos in groups and clusters (because of the higher “background” from the intragroup/intracluster medium), we likely could not detect the very low LX halos in these richer environments that we detect in the field. In fact, there are many galaxies in groups and clusters where a thermal component has not been detected (see Sun et al., 2007; Jeltema et al., 2008) and in some cases the limits on the hot gas luminosity would place these galaxies well-below the group/cluster L relationship shown in Figure 1. This suggests that although there is a population of low LK galaxies in groups and clusters that retain hot gas halos, there are other galaxies, including brighter galaxies, in these rich environments that have likely lost their hot gas halos to ram pressure stripping. Our study therefore suggests a very complex interplay between the intragroup/intracluster medium and the hot gas halos of galaxies in rich environments: the presence of an ambient medium can act to maintain or even enhance a hot halo in some galaxies and remove halo gas in other cases. In contrast, the hot gas content of more isolated galaxies is largely a function of the mass of the galaxy, with more massive galaxies able to maintain their halos, while the hot gas is expelled in lower mass systems. To better understand the importance of the various environmental processes at play in groups and clusters, studies of how the properties of hot gas halos vary spatially in groups and clusters would be valuable.
References
- Akritas & Bershady (1996) Akritas, M. G., & Bershady, M. A. 1996, ApJ, 470, 706
- Babul & Rees (1992) Babul, A., & Rees, M. J. 1992, MNRAS, 255, 346
- Bekki (2009) Bekki, K. 2009, MNRAS, 399, 2221
- Bower et al. (2006) Bower, R. G., Benson, A. J., Malbon, R., Helly, J. C., Frenk, C. S., Baugh, C. M., Cole, S., & Lacey, C. G. 2006, MNRAS, 370, 645
- Bregman & Parriott (2009) Bregman, J. N., & Parriott, J. R. 2009, ApJ, 699, 923
- Brighenti & Mathews (1998) Brighenti, F., & Mathews, W. G. 1998, ApJ, 495, 239
- Brighenti & Mathews (1999) Brighenti, F., & Mathews, W. G. 1999, ApJ, 512, 65
- Brown & Bregman (1998) Brown, B. A., & Bregman, J. N. 1998, ApJ, 495, L75
- Brown & Bregman (2000) Brown, B. A., & Bregman, J. N. 2000, ApJ, 539, 592
- Canizares et al. (1987) Canizares, C. R., Fabbiano, G., & Trinchieri, G. 1987, ApJ, 312, 503
- Colbert et al. (2001) Colbert, J. W., Mulchaey, J. S., & Zabludoff, A. I. 2001, AJ, 121, 808
- Cole et al. (2000) Cole, S., Lacey, C. G., Baugh, C. M., & Frenk, C. S. 2000, MNRAS, 319, 168
- Condon et al. (1998) Condon, J. J., Cotton, W. D., Greisen, E. W., Yin, Q. F., Perley, R. A., Taylor, G. B., & Broderick, J. J. 1998, AJ, 115, 1693
- Cox et al. (2006) Cox, T. J., Di Matteo, T., Hernquist, L., Hopkins, P. F., Robertson, B., & Springel, V. 2006, ApJ, 643, 692
- David et al. (2006) David, L. P., Jones, C., Forman, W., Vargas, I. M., & Nulsen, P. 2006, ApJ, 653, 207
- Dekel et al. (2005) Dekel, A., Stoehr, F., Mamon, G. A., Cox, T. J., Novak, G. S., & Primack, J. R. 2005, Nature, 437, 707
- Diehl & Statler (2007) Diehl, S., & Statler, T. S. 2007, ApJ, 668, 150
- Dong et al. (2010) Dong, R., Rasmussen, J., & Mulchaey, J. S. 2010, ApJ, 712, 883
- Douglas et al. (2007) Douglas, N. G., et al. 2007, ApJ, 664, 257
- Ellis & O’Sullivan (2006) Ellis, S. C., & O’Sullivan, E. 2006, MNRAS, 367, 627
- Font et al. (2008) Font, A. S., et al. 2008, MNRAS, 389, 1619
- Forman et al. (1985) Forman, W., Jones, C., & Tucker, W. 1985, ApJ, 293, 102
- Helsdon et al. (2001) Helsdon, S. F., Ponman, T. J., O’Sullivan, E., & Forbes, D. A. 2001, MNRAS, 325, 693
- Jeltema et al. (2008) Jeltema, T. E., Binder, B., & Mulchaey, J. S. 2008, ApJ, 679, 1162
- Jeltema et al. (2006) Jeltema, T. E., Mulchaey, J. S., Lubin, L. M., Rosati, P., Böhringer, H. 2006, ApJ, 649, 649
- Kang & van den Bosch (2008) Kang, X., & van den Bosch, F. C. 2008, ApJ, 676, L101
- Kawata & Mulchaey (2008) Kawata, D., & Mulchaey, J. S. 2008, ApJ, 672, L103
- Kim & Fabbiano (2003) Kim, D.-W., & Fabbiano, G. 2003, ApJ, 586, 826
- Kochanek et al. (2001) Kochanek, C. S., et al. 2001, ApJ, 560, 566
- Mathews (1990) Mathews, W. G. 1990, ApJ, 354, 468
- Mathews & Brighenti (2003) Mathews, W. G., & Brighenti, F. 2003, ARA&A, 41, 191
- McCarthy et al. (2008) McCarthy, I. G., Frenk, C. S., Font, A. S., Lacey, C. G., Bower, R. G., Mitchell, N. L., Balogh, M. L., & Theuns, T. 2008, MNRAS, 383, 593
- Memola et al. (2009) Memola, E., Trinchieri, G., Wolter, A., Focardi, P., & Kelm, B. 2009, A&A, 497, 359
- Niemi et al. (2010) Niemi, S.-M., Heinämäki, P., Nurmi, P., & Saar, E. 2010, arXiv:1002.0847
- O’Sullivan et al. (2001) O’Sullivan, E., Forbes, D. A., & Ponman, T. J. 2001, MNRAS, 328, 461
- O’Sullivan & Ponman (2004) O’Sullivan, E., & Ponman, T. J. 2004, MNRAS, 349, 535
- Murakami & Babul (1999) Murakami, I., & Babul, A. 1999, MNRAS, 309, 161
- Pellegrini et al. (2007) Pellegrini, S., Baldi, A., Kim, D. W., Fabbiano, G., Soria, R., Siemiginowska, A., & Elvis, M. 2007, ApJ, 667, 731
- Reda et al. (2004) Reda, F. M., Forbes, D. A., Beasley, M. A., O’Sullivan, E. J., & Goudfrooij, P. 2004, MNRAS, 354, 851
- Revnivtsev et al. (2008) Revnivtsev, M., Churazov, E., Sazonov, S., Forman, W., & Jones, C. 2008, A&A, 490, 37
- Romanowsky et al. (2003) Romanowsky, A. J., Douglas, N. G., Arnaboldi, M., Kuijken, K., Merrifield, M. R., Napolitano, N. R., Capaccioli, M., & Freeman, K. C. 2003, Science, 301, 1696
- Skrutskie et al. (2006) Skrutskie, M. F., et al. 2006, AJ, 131, 116
- Sun (2009) Sun, M. 2009, ApJ, 704, 1586
- Sun et al. (2007) Sun, M., Jones, C., Forman, W., Vikhlinin, A., Donahue, M., & Voit, M. 2007, ApJ, 657, 197
- Trinchieri & Fabbiano (1985) Trinchieri, G., & Fabbiano, G. 1985, ApJ, 296, 447
- Trinchieri et al. (2008) Trinchieri, G., et al. 2008, ApJ, 688, 1000
- White & Sarazin (1991) White, R. E., III, & Sarazin, C. L. 1991, ApJ, 367, 476
- White & Frenk (1991) White, S. D. M., & Frenk, C. S. 1991, ApJ, 379, 52
| Galaxy | z | log (L | Sample | Telescope | log LX,0.5-2keV |
|---|---|---|---|---|---|
| NGC57 | 0.018146 | 11.69 | E006 | Chandra/XMM | 41.19 |
| NGC766 | 0.027032 | 11.61 | CMZ01 | Chandra | 41.03 |
| NGC821 | 0.005787 | 11.00 | R04/EO06 | Chandra | 38.31 |
| NGC2325 | 0.007062 | 11.18 | EO06 | XMM | 40.14 |
| NGC2865 | 0.008763 | 11.14 | R04/EO06 | Chandra | 39.36 |
| NGC2954 | 0.012745 | 11.07 | M09 | XMM | 39.14 |
| NGC2986 | 0.007679 | 11.35 | EO06 | Chandra | 40.29 |
| NGC3115 | 0.002212 | 10.96 | EO06 | Chandra | 38.32 |
| NGC3209 | 0.020751 | 11.54 | CMZ01 | Chandra | 40.67 |
| NGC3962 | 0.006054 | 11.13 | EO06 | XMM | 39.47 |
| IC2980 | 0.006978 | 10.72 | CMZ01 | XMM | 39.00 |
| NGC4555 | 0.022292 | 11.67 | R04 | Chandra | 41.27 |
| NGC4915 | 0.010117 | 11.13 | EO06 | Chandra | 39.35 |
| NGC6127 | 0.016114 | 11.40 | EO06 | Chandra | 40.91 |
| NGC6703 | 0.008209 | 11.17 | EO06 | Chandra | 39.67 |
| IC4889 | 0.008586 | 11.26 | EO06 | XMM | 39.57 |
| NGC7010 | 0.028306 | 11.64 | CMZ01 | XMM | 41.58 |
| NGC7029 | 0.009323 | 11.15 | EO06 | XMM | 38.86 |
| NGC7052 | 0.015584 | 11.60 | M09 | Chandra | 41.17 |
| NGC7196 | 0.009737 | 11.30 | EO06 | Chandra/XMM | 40.59 |
| NGC7507 | 0.005224 | 11.15 | EO06 | XMM | 39.44 |
| NGC7785 | 0.012702 | 11.46 | M09 | XMM | 40.93 |
| NGC7796 | 0.010974 | 11.40 | R04/EO06 | Chandra | 40.62 |
Note. — All redshifts are taken from NED. LK values have been calculated from total Kshort magnitudes derived from the Two Micron All Sky Survey (2MASS; Skrutskie et al. (2006)). The LX values quoted are for the thermal component only.
References. — CMZ01=Colbert, Mulchaey & Zabludoff (2001); R04=Reda et al. (2004); EO06=Ellis & O’Sullivan (2006); M09=Memola et al. (2009).