Mid-Infrared Properties of the Swift Burst Alert Telescope Active Galactic Nuclei Sample of the Local Universe. I. Emission-Line Diagnostics
Abstract
We compare mid-infrared emission-line properties, from high-resolution Spitzer spectra of a hard X-ray (14 – 195 keV) selected sample of nearby (z ) AGN detected by the Burst Alert Telescope (BAT) aboard Swift. The luminosity distribution for the mid-infrared emission-lines, [O IV] 25.89 m, [Ne II] 12.81 m, [Ne III] 15.56 m and [Ne V] 14.32/24.32 m, and hard X-ray continuum show no differences between Seyfert 1 and Seyfert 2 populations, however six newly discovered BAT AGNs are under-luminous in [O IV], most likely the result of dust extinction in the host galaxy. The overall tightness of the mid-infrared correlations and BAT fluxes and luminosities suggests that the emission lines primarily arise in gas ionized by the AGN. We also compare the mid-infrared emission-lines in the BAT AGNs with those from published studies of ULIRGs, PG QSOs, star-forming galaxies and LINERs. We find that the BAT AGN sample fall into a distinctive region when comparing the [Ne III]/[Ne II] and the [O IV]/[Ne III] ratios. These line ratios are lower in sources that have been previously classified in the mid-infrared/optical as AGN than those found for the BAT AGN, suggesting that, in our X-ray selected sample, the AGN represents the main contribution to the observed line emission. These ratios represent a new emission line diagnostic for distinguishing between AGN and star forming galaxies.
1 Introduction
Active galactic nuclei (AGN) span over seven orders of magnitude in bolometric luminosity () (Koratkar & Blaes, 1999) and yet are all believed to be powered by the same physical mechanism: accretion of matter onto supermassive black holes (e.g., Rees, 1984; Peterson et al., 2004). One way to approach the study of AGN is to concentrate on those in the local Universe (e.g. ), which permits us, among other things, to determine the properties of the host galaxy. Such studies tend to focus on Seyfert galaxies, which are modest luminosity AGN ( erg s-1), but bright enough, due to their proximity, to be studied across the full electromagnetic spectrum.
Although Seyfert galaxies and other AGN have been traditionally defined in terms of their optical properties (e.g., classification into Type I and Type II, Khachikian & Weedman, 1974), sample selection of AGN via a single waveband can lead to observational bias (e.g., Mulchaey et al., 1994). For example, most AGN are obscured from our line of sight by dust and gas (Matt, 2000) and any selection based on optical (or UV) properties would miss many objects or could highly skew a sample towards unobscured objects (e.g., Barger et al., 2005). The soft X-ray properties of Seyfert galaxies generally follow the same dichotomy as their optical properties. The X-ray continuum source in Seyfert 1s can be observed directly (e.g., George et al., 1998), while the central X-ray source is sometimes undetectable in Seyfert 2s, due to material with 1022.5 cm-2 along our line of sight. There is additionally a wide range of effective IR colors (Kuraszkiewicz et al., 2003; Lutz et al., 2005) which can introduce selection bias. A comparison of infrared and X-ray data (Franceschini et al., 2005) shows a factor of 30 range in the IR 24 to 4 keV X-ray flux ratio for X-ray selected AGN, suggesting a range of geometries and optical depths for dust reprocessing, and probably variance in the intrinsic power law AGN continuum. Obscuration and star formation in the host galaxy can also dominate and introduce confusion in the IR (e.g., Lutz et al., 2004; Barmby et al., 2006). In fact, virtually all surveys for AGN based purely on IR, optical, UV or soft X-ray data have been biased (Mushotzky, 2004). Even Sloan surveys (Heckman et al., 2004) or IR surveys (Franceschini et al., 2005) have required indirect AGN indicators which are known to be not necessarily robust (Meléndez et al., 2008a).
To understand the intrinsic properties of AGN as a class, it is critical to start with a survey where we can be as certain as possible that we are viewing the AGN-only parts of these galaxies. At X-ray energies of E keV, the obscuring material is relatively optically thin for column densities less than cm-2 (Compton-thin objects). Even if an AGN is well buried within its host galaxy there is an unaffected view of the central power source. A hard X-ray survey should thus find all Compton thin AGN in a uniform fashion and is the most representative, since at present, there are very few, if any, known X-ray “quiet” AGN. Such a hard X-ray survey is now available from the Swift Burst Alert Telescope (BAT). The Swift BAT is sensitive over 85% of the sky to a flux threshold of in the 14195 keV band (Markwardt et al., 2005). The BAT data are about 10 times more sensitive than the previous hard X-ray all sky survey (Levine et al., 1984). The BAT detects all bright AGN, whether they are obscured or not. Moreover, several of the BAT sources are newly discovered AGN or have been poorly studied, if at all, at other wavelengths (Winter et al., 2008; Tueller et al., 2008, 2010).
Nevertheless, although all of the BAT-detected objects are true AGN, in order to fully explore the properties of these AGN one needs to take a multi-wavelength approach. For example, studying the IR properties of the BAT AGN will provide insight into the IR/X-ray scatter and thus determine the true distribution of IR properties. There have been a large number of studies of the mid-infrared emission line properties of active galaxies using both Infrared Space Observatory (Kessler et al., 1996) and Spitzer Space Telescope (Werner et al., 2004). The ratios of high- and low-ionization mid-infrared emission lines have been widely used to separate the relative contribution of the AGN and star formation (e.g., Genzel et al., 1998; Sturm et al., 2002; Dale et al., 2006; Armus et al., 2007; Farrah et al., 2007; Meléndez et al., 2008b; Baum et al., 2010). More recently, Hao et al. (2009) (H09) used new high-resolution Spitzer spectroscopy to probe the utility of mid-infrared emission line diagnostics as a way to separate active galaxies from star forming galaxies. In our first study of mid-infrared properties of the BAT AGNs (Meléndez et al., 2008a), we found the [O IV]25.89m to be an accurate indicator of the AGN luminosity, with an uncertainty of 0.3 dex; this result has been confirmed using larger samples (Rigby et al., 2009; Diamond-Stanic et al., 2009). Using a complete, volume-limited, sample of galaxies Goulding & Alexander (2009) (GA09) demonstrated the utility of high-ionization mid-infrared emission lines, such as [Ne V]14.32m, to identify AGN including those that were not identified as AGN in optical studies (see also, Landi et al., 2007; Abel & Satyapal, 2008; Dudik et al., 2009; Satyapal et al., 2009). Similar results have been found by Bernard-Salas et al. (2009) (B09) in their study of starburst galaxies.
This paper is the first in a series seeking to understand the nature of the observed mid-infrared luminosities in AGN and their wide variety of spectral forms. Here we report results from the portion of our sample that have high-resolution Spitzer spectra. This work complements the extensive optical imaging and spectroscopy of the AGN population (Koss, accepted in ApJL; Winter et al., 2010) and the detailed analysis of the X-ray properties of the BAT AGN sample (e.g., Winter et al., 2008, 2009a, 2009b). In following papers we will report on the results from our analysis of the low-resolution Spitzer spectra which will include the study of polycyclic aromatic hydrocarbon (PAH) features, silicate absorption and mid-infrared continuum properties of the BAT AGN sample. In order to calculate the luminosities presented in this work we assumed a flat universe with a Hubble constant , and , with redshift values taken from NASA’s ExtraGalactic Database (NED), except for sources with redshift values of were distances are take from The Extragalactic Distance Database (EDD) (Tully, 1988; Tully et al., 2009).
2 Observations and Analysis
2.1 X-ray data and AGN sample selection
Our sample was selected from the first unbiased local AGN sample obtained with the Swift Burst Alert Telescope (BAT) survey. The X-ray positions have positional uncertainties and we are highly confident of the positions and the optical identifications. Source identifications are based primarily on the X-ray imaging data and a correlation with optical images and catalogs. In some cases the identifications are based on positional coincidences with previously known AGN.
The median redshift of the BAT objects is 0.025. Our selection criteria are , and a hard X-ray BAT flux of erg cm-2 s-1. The flux limit provides sufficient S/N to be sure that the sources are statistically robust. Our total BAT sample contains 130 objects above a significance threshold of 5.0 . We obtained from the Infrared Spectrograph (IRS) (Houck et al., 2004) on board Spitzer high and low resolution spectra for sixty of these objects, while seventy previously had Spitzer IRS spectra from other observing programs. There are published BAT AGN catalogs from two surveys, the 9-month survey (Tueller et al., 2008) and an updated 22-month catalog (Tueller et al., 2010). Here we use the 22-month fluxes from Tueller et al. (2010) as the 22-month survey is the most sensitive. However, in our sample, four of the AGN in the 9-month survey were not detected in the 22-month survey, therefore we will use the fluxes from the 9-month survey as upper-limits (see footnote in Table 1).
2.2 Spitzer Observations and Data Analysis
In this work we discuss only the high-resolution Spitzer spectroscopy of our total sample, which result on a subsample of 79 BAT AGN. The galaxies in our sample were observed with IRS in the Short-High (SH, = 9.9 - 19.6 m, 4.7′′ 11.3′′,) and Long-High (LH, = 18.7 - 37.2 m, 11.1′′ 22.3′′, ) IRS order in staring mode. Science targets in staring mode are placed at two node position along the IRS slit. This sample includes fluxes found in the literature (Weedman et al., 2005; Armus et al., 2006; Tommasin et al., 2008) and from our analysis of unpublished archival spectra observed with IRS, including observations collected with the Spitzer Cycle 3 and Cycle 5 GTO program “Spitzer Observations to Complete the First Unbiased AGN Sample of the Local Universe” (P30745 and P50588, PI: K. Weaver). This high-resolution sample includes 38 Seyfert 1’s, 33 Seyfert 2’s, 6 previously unknown or poorly-studied AGNs and two LINERs. High resolution spectroscopy allow us to easily separate blended features such as, [O IV]-[Fe II] 25.99m and [Ne V] 14.32m-[Cl II] 14.37m. Moreover, the subsample presented in this work spans the same range on 14-195 keV luminosities as the 22-month BAT AGN sample and is large enough to be statistically representative of the whole sample of 130 AGN. Furthermore, the Kolmogorov-Smirnov (K-S) test probabilities for Seyfert 1 and Seyfert 2 galaxies between the subsample presented in this work and the whole sample of 130 sources are, and 111A probability value of less than 5 represents a high level of significance that two samples drawn from the same parent population would differ this much 5 of the time, i.e., that they are different. A strong level of significance is obtained for values smaller than 1 (e.g., Press et al., 1992; Bevington & Robinson, 2003), respectively, meaning that there are no differences in their X-ray luminosities. Finally, our sample also has the same range in mid-infrared emission line luminosities as complete samples such as the 12 (Tommasin et al., 2010) and the revised Shapley-Ames sample (Rigby et al., 2009).
For the analysis of Spitzer data we used the basic calibrated data files preprocessed using the S17.2 IRS pipeline. This include ramp fitting, dark sky subtraction, drop correction, linearity correction and wavelength and flux calibrations 222See the IRS Pipeline Handbook, http://ssc.spitzer.caltech.edu/irs/dh/irsPDDmar30.pdf. Many of the sources in our sample have dedicated off-source observations to do sky subtraction, which can alleviate the effect of rogue pixels and variable background. Off-source images were averaged for each node position and order to obtain a final background image. Then, we subtract the sky background from our spectrum. The full slit spectra were extracted from the IRS data using the Spectroscopy Modeling Analysis and Reduction Tool (SMART) v6.4.0 (Higdon et al., 2004). For the extraction we used the “Full Aperture” extraction method for high-resolution observations of point sources. We created median basic calibrated data files from each node and then the spectra from each node position for SH/LH were averaged using 2.5- clipping to reject outliers. Finally, we trimmed the edges of the orders to obtain a clean spectrum. For sources without dedicated off-source observations we did not perform any background subtraction because we only required emission-line fluxes, furthermore, our hard X-ray selected sample is characterized by bright nuclear sources which fill the high-resolution slit resulting in a minimal background correction. We performed the line fit with SMART using a polynomial to fit the continuum and a Gaussian for the line profile. In Table 1 we report the line fluxes, together with their 1- statistical error for the whole high-resolution sample. The typical 1- statistical errors for the mission lines presented in this work are, on average, 9, 10, 5, 12 and 8 for the [Ne II]12.81m, [Ne V]14.32m, [Ne III]15.56m, [Ne V]24.32m and [O IV] emission lines, respectively. From this and for the sake of simplicity we did not plot error bars on individual objects in the different comparisons presented in this work, as the errors are comparable to the symbol size uses in the figures. For non-detections we quote the 3- upper limits as defined for emission-lines with a S/N less than 3. Finally, the emission line fluxes are presented here without reddening corrections.
Each of the galaxies in our sample has clearly detected [O IV], [Ne II] and [Ne III] emission. However, [Ne V] 14.32m and 24.32m were not detected in 10 and 15 of the sources, respectively. Similar results are obtained for the [Ne V] 14.32m and 24.32m in the Spitzer high-resolution spectroscopy of the 12m Seyfert galaxies (Tommasin et al., 2008, 2010). The importance of [O IV] and the neon emission lines is that they are sufficient to distinguish between stellar and AGN activity. For example, the [Ne III]/[Ne II] and [O IV]/[Ne II] ratios are good discriminators of star formation and AGN emission (Genzel et al., 1998; Sturm et al., 2002; Satyapal et al., 2004; Meléndez et al., 2008b), while the strengths of [O IV] (Meléndez et al., 2008a; Rigby et al., 2009) and [Ne V] (e.g., Satyapal et al., 2007; Dudik et al., 2007; Abel & Satyapal, 2008) scale with the luminosity of the AGN. Moreover, the neon line ratios are also tracers that are insensitive to abundance. It should be noted, however, that [O IV] and [Ne V] can be weak in some classical AGN (Weedman et al., 2005), notably ultraluminous infrared galaxies, possibly due to the shielding of the narrow line region by optically thick, dusty gas close to the AGN (e.g., Armus et al., 2007).
3 Mid-Infrared properties of the BAT sample
3.1 Comparison of the IR Emission-Line and BAT Luminosities
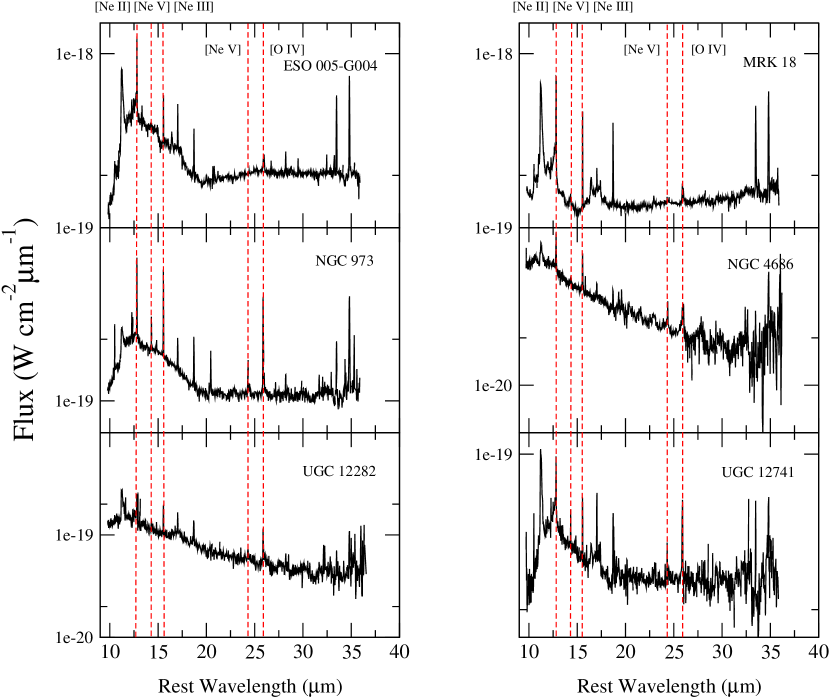
As noted above, via the hard X-ray band we can detect AGN that may have been missed in optical surveys due to the extinction of their optical emission lines. Among the 79 targets present here (BAT AGN), we have found six poorly studied or previously unknown AGN (“new BAT-detected AGN”): ESO 005-G004, MRK 18, NGC 973, NGC 4686, UGC 12282, and UGC 12741. There have been attempts to classify some of these galaxies. Of these, ESO 005-G004 has been classified as a Seyfert 2, based on its X-ray properties although no optical AGN signature has been detected (Landi et al., 2007; Ueda et al., 2007). Based on follow-up observations in the optical, MRK 18 has an ambiguous classification with HII/LINER properties (Winter et al., 2010) and NGC 973 has been classified as a narrow emission line AGN with Sy2/LINER properties (Masetti et al., 2008). UGC 12282 has been classified as a Sy 1.9 based on its optical spectra (Véron-Cetty & Véron, 2006). Finally, to the best of our knowledge, there is no assigned classification for NGC 4686 and UGC 12741. The Spitzer IRS spectra of these objects are shown in Figure 1.
In Figures 2 – 7 we compare the mid-infrared emission lines and the BAT luminosities (and fluxes), correlations between the emission lines, and emission line ratios. The statistical analysis for these plots is listed in Table 2, which includes the Spearman rank order correlation coefficient with its associated null probability, the generalized Kendall’s correlation coefficient for censored data and the Kendall’s coefficient for partial correlation with censored data. One should note that, due to redshift effects, luminosity-luminosity plots will almost always show some correlation. Thus, we are primarily interested in the dispersion of the correlations or the slopes. Furthermore, caution must be taken when applying statistical analysis to data sets that contain non-detections (upper limits), or “censored” data points. To deal with these problems we have used Astronomy SURVival analysis (ASURV) Rev 1.2 (Isobe & Feigelson, 1990), which implement the methods presented in Isobe et al. (1986). We also used a test for partial correlation with censored data (Akritas & Siebert, 1996) in order to exclude the redshift effect in the correlations.
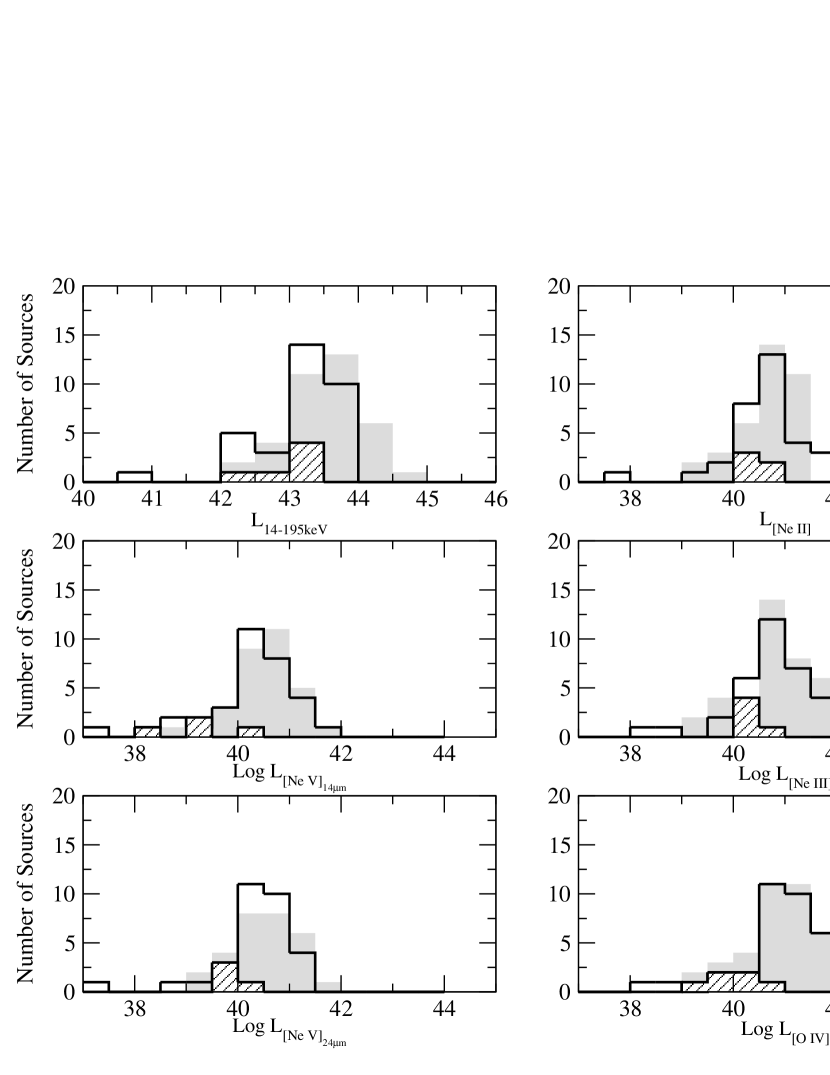
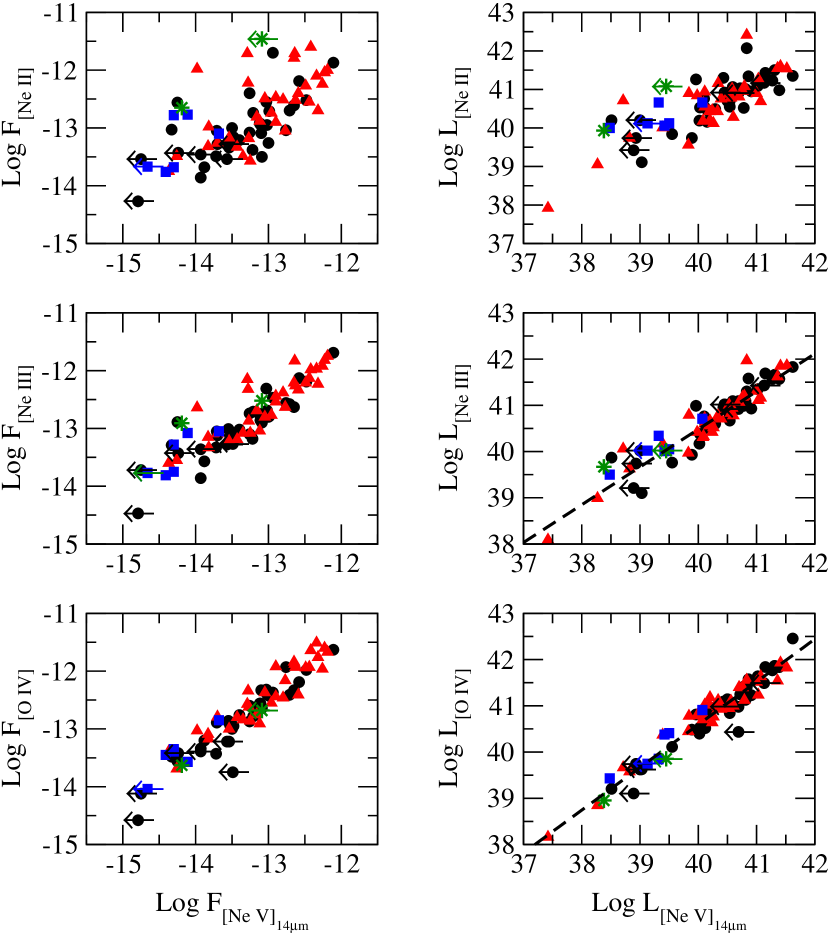
In Figure 2 we show the distribution of the observed [Ne II], [Ne III], [Ne V], [O IV] and BAT luminosities () for our sample. The results of the K-S tests, comparing Seyfert 1s and 2s, for these quantities are listed in Table 3. This table also includes information about the numbers of Seyfert 1 and Seyfert 2 galaxies, median values and standard deviations of the mean for the measured quantities. As is apparent from both the histograms and the K-S results, the two Seyfert types are statistically indistinguishable, i.e., there are essentially no differences between Seyfert 1s and 2s when we directly compare the BAT luminosities or any of the IR line strengths. These results are in agreement with the similar optical luminosities found for broad and narrow line sources, with optical Seyfert classifications, in the most recent study on the optical spectral properties of the BAT AGN (Winter et al., 2010). The smallest null-test probability is for , which, as we will discuss below, is evidence that Seyfert 2s suffer more from Compton scattering in the BAT band. Although there were too few of the “new BAT AGN” to separate them for a K-S on these quantities, the histograms indicate that they are relatively weaker in their observed mid-infrared emission line luminosities, compared to their BAT luminosities.
As mentioned before, a detailed statistical analysis for the different correlations between the BAT and mid-infrared luminosities is presented in Table 2. From this analysis the weaker correlation found in the [Ne II] - BAT relationship could be the result of active star formation contributing to the [Ne II] emission line in some of the AGN (e.g., Sturm et al., 2002; Schweitzer et al., 2006; Ho & Keto, 2007; Meléndez et al., 2008b). On the other hand, stronger correlations are found between [Ne III], [Ne V] and [O IV] luminosities when compared to , suggesting that, on average, there is no strong enhancement due to star formation in the [Ne III] and [O IV] emission in the BAT sample.
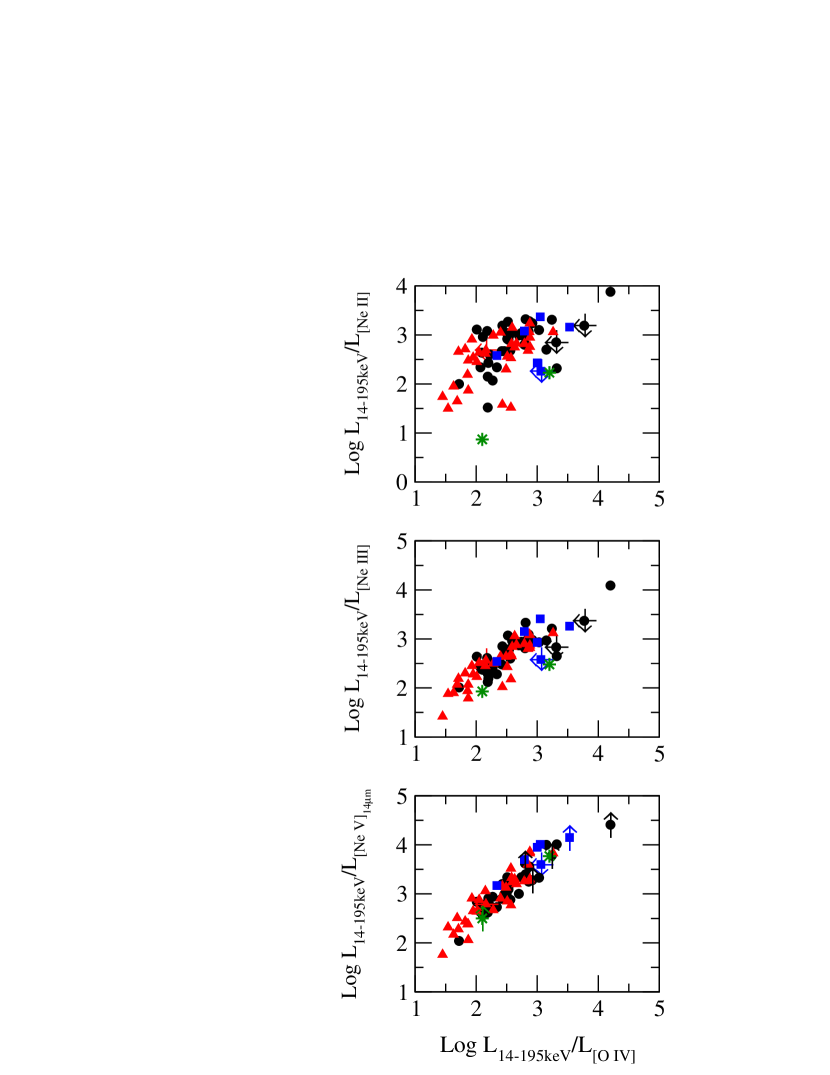
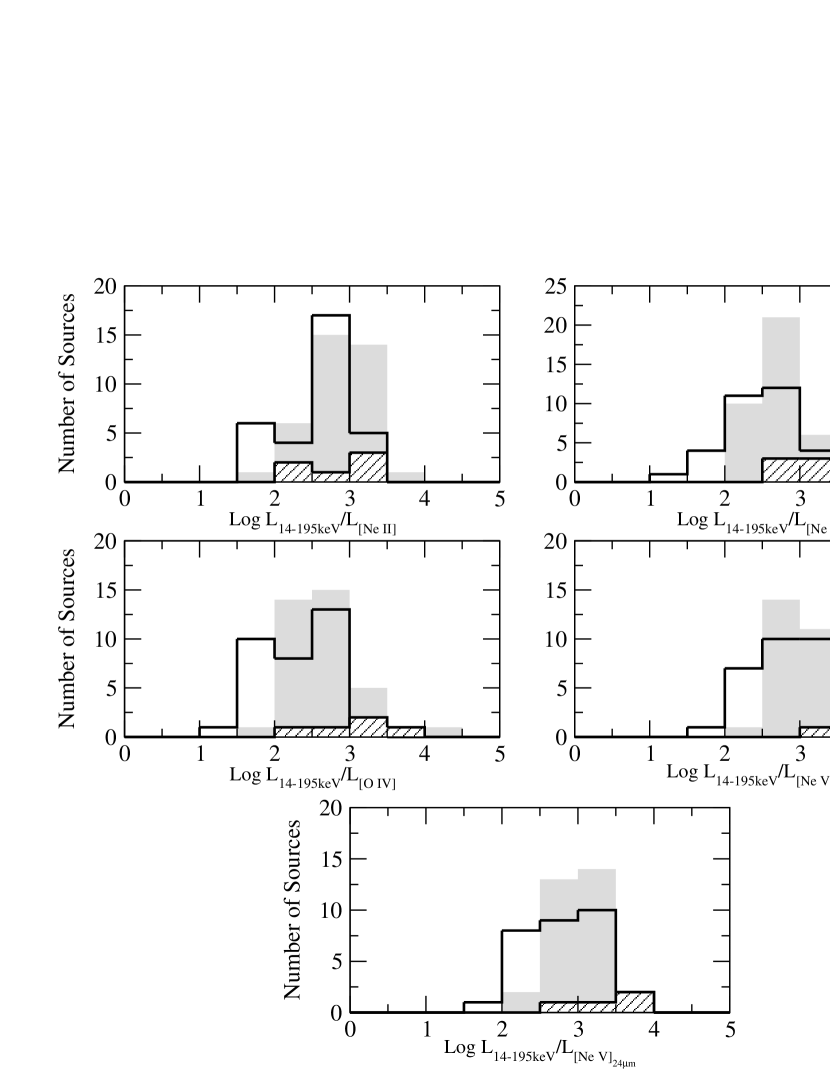
In Table 4 we present the linear regression fits for all correlations. The somewhat steeper slopes for the Seyfert 2s are consistent with the decrement in the observed X-ray emission in the BAT band due to the effect of Compton scatter. The strong similarities between Seyfert types lessen when we compare the ratios of mid-infrared line strengths and the X-ray continuum strength. In Figure 3, we show the ratios of and [Ne II], [Ne III], and [Ne V] 14.32 m compared to /[O IV]. The histograms for the ratios of and [Ne II], [Ne III], [Ne V] 14.32/24.32 m and [O IV] are presented in Figure 4. Of particular interest in these comparisons is that below there are only two Seyfert 1 galaxies but thirteen Seyfert 2 galaxies ( of the Seyfert 2 population in our sample). Therefore, in these plots, one can see that the Seyfert 2s have lower ratios of to the emission lines compared to the Seyfert 1s, which is, we believe is due to the effect of Compton scattering in the BAT band in some Seyfert 2 galaxies. This result is in agreement with the K-S test null probability for this ratio (see Table 3). Similarly, there is only one Seyfert 2 galaxy, NGC 4138, with .
From the ratios, the lowest values, likely due to the effects of Compton scattering in the BAT band are: NGC 1365, NGC 2992, NGC 3281, NGC 7582, MRK 3 and MCG-03-34-064. Note that NGC 2992 and NGC 1365 are very variable in the X-ray, which can contribute to their low and ratios (see, Gilli et al., 2000; Risaliti et al., 2000b). In the BAT spectra (Mushotzky et al. 2010, in preparation), MRK 3 shows a flat spectrum with a photoelectric cutoff, consistent with a high column density, but not a Compton thick absorber. On the other hand, NGC 1365, NGC 3281 and NGC 7582 are most probably Compton thick sources and the BAT data for NGC 2992 and MCG-03-34-064 has a low S/N which makes it difficult to constrain the spectrum well. These results suggest that the low BAT to [O IV] ratio is a marker for very high column densities towards the X-ray source, in agreement with previous studies (Meléndez et al., 2008a; Rigby et al., 2009; La Massa et al., 2009). These results argue in favor of the unified model of active galaxies, where the amount of X-ray emission suppressed, relative to an isotropic indicator for the AGN power, is related to the absorbing column density towards the X-ray source (see also Bassani et al., 1999; Heckman et al., 2005; Netzer et al., 2006). Given the high ionization potential for Ne+4 (97 eV), the mid-infrared [Ne V] emission lines are claimed to be an unambiguous signatures of an AGN (e.g., Satyapal et al., 2007, 2009). Therefore, the very tight correlation between the and 14.32m ratio confirm that [O IV] is AGN-driven in this sample.
In Figure 5 we plot both the flux and luminosity of [Ne II], [Ne III] and [O IV] against those of [Ne V] 14.32m. The very tight correlation between [Ne V] and [O IV] suggest that both of these lines are produced by the same physical process, i.e. photoionization by the AGN continuum (see also, Meléndez et al., 2008a, b). This is also true for the tight correlation between [Ne V] and [Ne III] found in our sample. While there is some scatter for [Ne III], which may also be due to star formation (Ho & Keto, 2007), the tightness of the correlation suggests that [Ne III] is primarily produced by the AGN in these objects (see also Gorjian et al., 2007; Goulding & Alexander, 2009), in agreement with the good correlation found between the [Ne III] and BAT luminosity. Furthermore, the tightness of these correlations, specially in flux-flux, suggests that the constant mid-infrared ratios observed are not dominated by aperture effects. The extraction aperture for the [O IV] is bigger than that for the [Ne III] and [Ne V]14m, implying that the emitting regions where these lines originate are well within the central kpc of these sources, in agreement with our previous photoionization studies (e.g., Meléndez et al., 2008a, b). We found that none of the correlations presented, e.g., between the mid-infrared lines and the BAT luminosities, are driven by distances effects, as shown by the partial correlation analysis (see Table 2) and in agreement with the tightness of the flux–flux correlations. Finally, the largest scatter occurs for [Ne II], which is consistent with the interpretation that this line may contains a significant contribution from stellar processes, resulting in the enhancement of this emission line, as also evident in Figure 3. As we discussed before, the [Ne V] emission lines are good indicators for the AGN power, therefore, the good correlation found between [Ne II] and [Ne V] (see Table 2) suggest that, on average, the observed [Ne II] emission in the BAT sample is still dominated by the AGN.
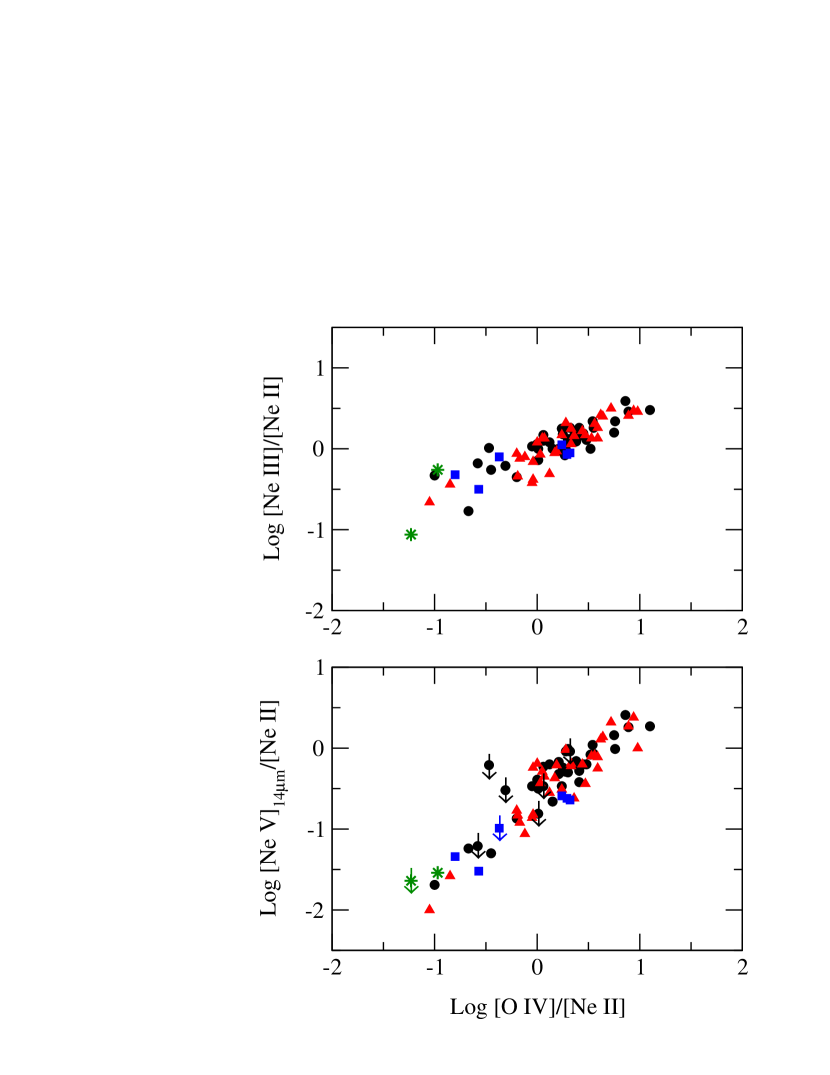
As we mentioned before, the ratios of high-ionization lines to low-ionization lines can reveal the relative contributions of the AGN and star formation. In Figure 6, we show the ratios of [Ne III]/[Ne II] and [Ne V]14m/[Ne II] compared to [O IV]/[Ne II] for the BAT sample. One result, which was also discussed in Meléndez et al. (2008b), is that and of our AGN have [Ne III]/[Ne II] and [O IV]/[Ne II] ratios, respectively, greater than unity. This suggests, again, that in the BAT targets, the mid-infrared emission lines are dominated by the AGN. These results are also in agreement with the high-resolution Spitzer analysis of the 12m sample by Tommasin et al. (2008, 2010) where they found the same range for the [Ne III]/[Ne II] and [O IV]/[Ne II] ratios. However, the K-S test for the [Ne III]/[Ne II] ratio between the 12µm sample and the BAT sample returns a probability of the null hypothesis, meaning that these samples are statistically different in their stellar content, with galaxies in the 12µm sample having slightly smaller ratios on average, 1.10.9 , than that found for the BAT sample, 1.30.8. On the other hand, the K-S test for the [O IV]/[Ne III] ratio between the the 12µm sample and the BAT sample returns a probability of the null hypothesis. These results suggest that even the 12µm sample could be subject to recent star formation contamination, as mapped through the [Ne II] enhancement, in agreement with previous considerations (Hunt & Malkan, 1999). This mild contamination due to star formation becomes noticeable when comparing the 12µm sample with the 14–195 keV sample, the latter of which is less biased towards star-forming systems. Nonetheless, the similarity on their [O IV]/[Ne III] ratios suggest that both samples have a strong AGN contribution to their observed narrow line emission.
The tight correlation between [O IV] and [Ne V], evident in Figure 5, is seen here as well. The [Ne V]/[Ne II] versus [O IV]/[Ne II] plot shows a number of sources, including several of the newly BAT-detected AGN and the two LINERs in the sample, with relatively weak high-ionization lines, which can result from a weak AGN (e.g., Netzer et al., 2004), strong nuclear star formation (e.g., Meléndez et al., 2008b), extinction towards the NLR region (e.g., Netzer et al., 2006), or shielding of the NLR from the ionizing continuum (e.g., Armus et al., 2007). Comparing the [Ne III]/[Ne II] to the [Ne V]14.32/[Ne II] we found the same overall trend, however, the slope of the former flattens towards lower ratios of [O IV]/[Ne II] possible due to the contribution of star formation to the [Ne III]. Interestingly, all these ratios are log normal distributed with a standard deviation of only dex, except for the with a standard deviation of dex. The [O IV]/[Ne II] emission line ratio was also compared with the redshift () in order to check if our previous results are been affected by aperture affects, in other words, if our results are biased toward small [Ne III]/[Ne II] and [O IV]/[Ne II] ratios at higher redshifts. We found that the Spearman rank, ; , and Kendall test, ;, did not show any correlation with . A similar result was obtained for the [O IV]/[Ne III] ratios and the redshift where we found no correlation, with a Spearman rank, ; , and Kendall test, ;.
3.2 Extinction in the Mid-Infrared
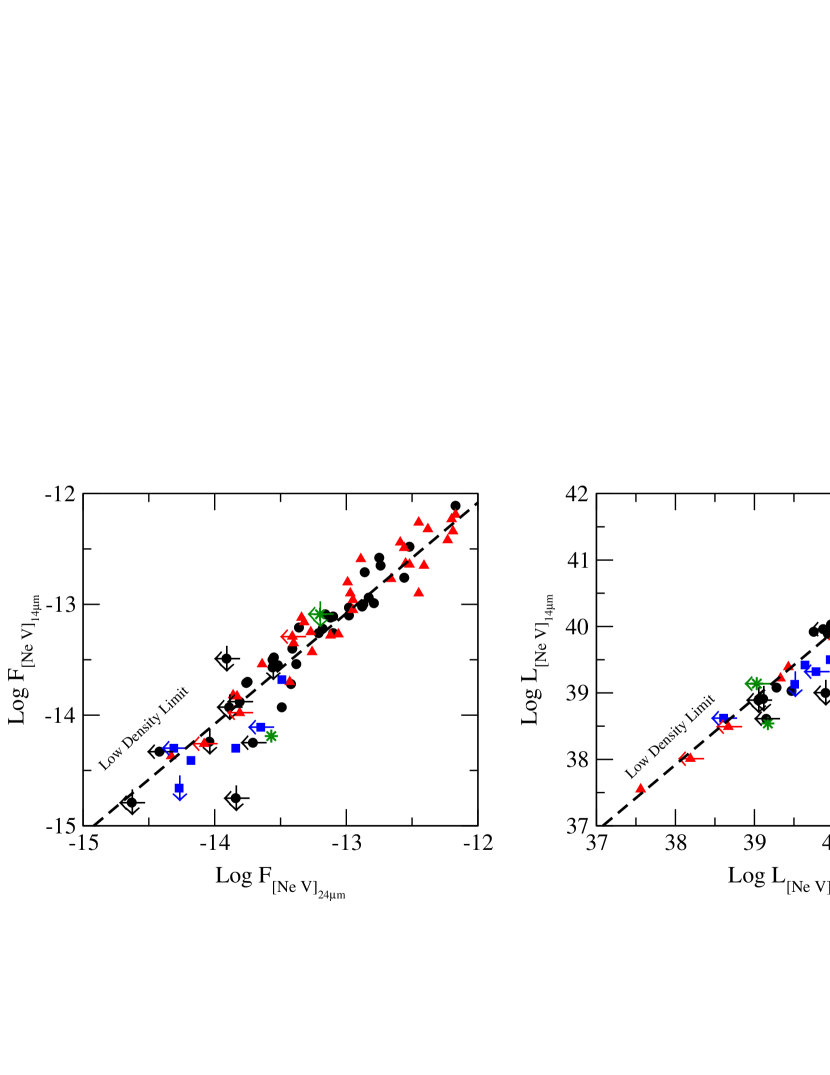
If wavelength-dependent extinction is important in the mid-infrared, it should be evident when comparing the strengths of [Ne V] 14.32m and [Ne V] 24.32m. Dudik et al. (2007) calculated the theoretical values of this ratio as a function of density and electron temperature (see their Figure 1). As density increases, the 24.32m line is suppressed relative to the 14.32m line, hence the most likely way in which the ratio can fall below the theoretical low density limit is extinction, suggesting that it should be stronger for the shorter-wavelength line. In Figure 7, we show the correlation between the two [Ne V] lines for the BAT sample, with the theoretical low density limit over-plotted. We note that the correlation between the [Ne V] emission lines is strong and is similar in both flux and luminosities, meaning that there is a true linear correlation (see Table 4).
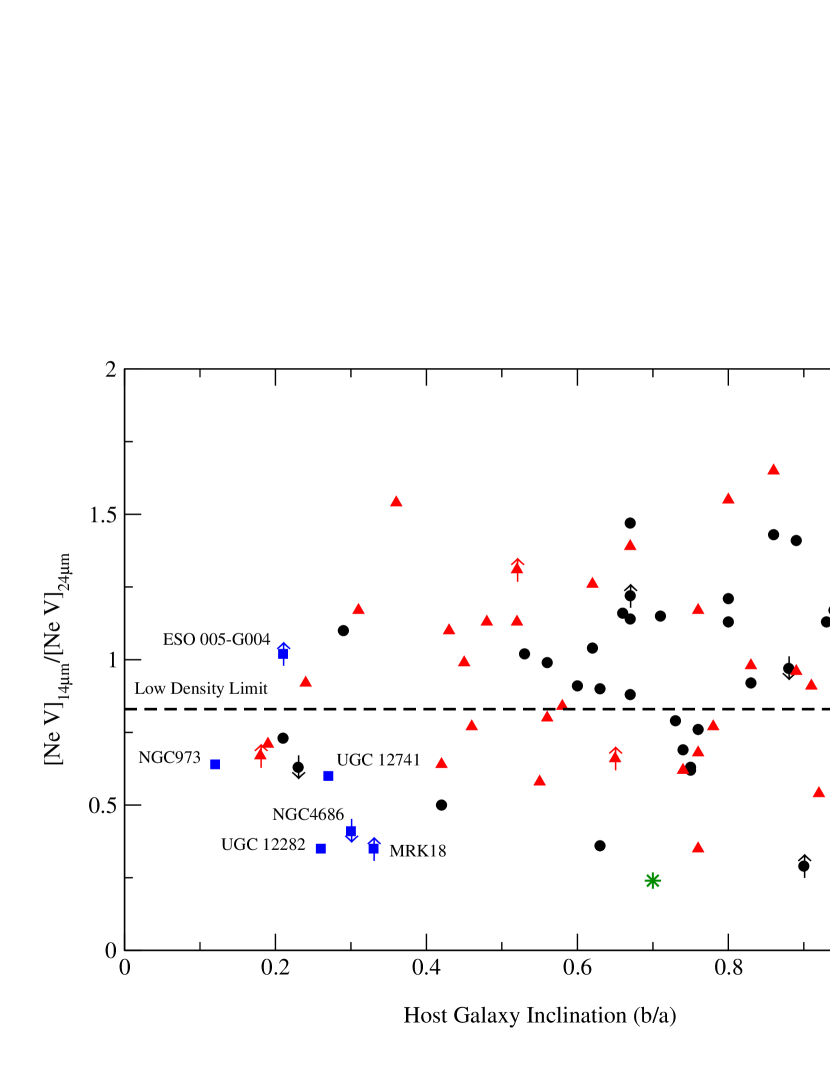
For the BAT sample the average [Ne V]14.32µm/[Ne V]24.32µm ratio is above the low density limit and similar for Seyfert 1 and Seyfert 2 galaxies, and , respectively. The K-S test for this ratio returns a probability of the null hypothesis, i.e., that there is no difference between Seyfert 1 and Seyfert 2 galaxies, however, Seyfert 2 galaxies show a bigger dispersion. For a gas temperature of K, these results suggest an electron density of cm-3, in agreement with previous studies (e.g., Sturm et al., 2002; Dudik et al., 2007; Tommasin et al., 2008). On the other hand, five out of six of the newly BAT-detected AGN have ratios below the low density limit, with an average of , indicating possible dust extinction. In Figure 8, we compared the [Ne V] line ratio to the host galaxy inclination333The values for the major and minor diameter of the host galaxy, a and b respectively, were taken from NED. All of the newly BAT-detected AGN are found in inclined host galaxies which argues in favor of an scenario where the optical signatures of the AGN may have been missed in this group, in part, due to extinction in the plane of the host galaxy; as suggested by Kirhakos & Steiner (1990) and Simcoe et al. (1997) and more recently by GA09. However, one must note from Figure 8, that there is no correlation between the [Ne V] line ratio and the value of the host galaxy inclination. Hence, host galaxy inclination cannot be solely responsible for the observed mid-infrared extinction in our sample.
In addition to providing some insight into the nature of the newly BAT-detected AGN, these plots show that of Seyfert 1 galaxies and of Seyfert 2 galaxies have [Ne V] ratios below the low density limit, in good agreement with the percentage of Seyfert galaxies that fall below the low density limit for the neon ratio from the high-resolution spectroscopy of the 12m sample (Tommasin et al., 2010). If extinction at shorter wavelengths were responsible for the neon ratio below the low density limit, it is plausible that the tightness of the [Ne III] – correlation may be due to the combined effects of mid-infrared extinction and X-ray decrement due to Compton scatter in the BAT band (e.g., Meléndez et al., 2008a). Similarly, the larger scatter for [O IV] – may be due, in part, to the lower extinction for [O IV], compared to [Ne III], hence the variations in the observed X-ray, due to different column densities toward the nuclear region, become the dominant effect. One must note that the mid-infrared extinction curved by Weingartner & Draine (2001) and Li & Draine (2001) (e.g, see Figure 16 in Li & Draine, 2001), fails to predict the required dust extinction at and to explain the observed [Ne V] ratios below the low density limit. Other possibilities to explain the observed neon ratios below the low density limit must be consider, such as, aperture effects and/or adopted atomic data for neon, however, these possibilities have also failed to fully explain the observed ratios below the low density limit (e.g., Dudik et al., 2007; Tommasin et al., 2010).
4 Comparison between BAT AGN and other Sources
Following the mid-infrared properties for the BAT AGN sample we investigated the relationship between different types of galaxies. For comparison we searched the literature for the most recent Spitzer high-resolution IRS spectroscopy, from this we used the volume-limited sample of bolometrically luminous galaxies () to a distance of Mpc of GA09 which includes H II galaxies, LINERS, optically classified AGN and optically unclassified galaxies. We also used the recent atlas of starburst galaxies by B09 that includes starburst galaxies with and without evidence of an AGN. Finally, we used a sample of extreme starburst galaxies which includes blue compact dwarfs (BCD) from H09. When a source was present in more than one compilation we gave priority to the data analysis and extraction presented in GA09, followed by B09 and H09.
Using [Ne V] 14.32m, GA09 identified AGN activity in sources that were previously not classified by their optical spectra as AGN. While theoretical models predict that some fraction of [Ne V] can be produce by energetic starbursts (e.g., Abel & Satyapal, 2008), H09 did not detect [Ne V] emission in their sample of extreme starburst galaxies. However, some problems arise when looking at the [Ne V] emission in AGN. As we mentioned before, [Ne V] 14.32m and 24.32m were not detected in all the sources in our sample of BAT AGN. This suggests that because of dust extinction and instrumental sensitivity, [Ne V] emission could go undetected even in intrinsically luminous AGN. On the other hand, [Ne II], [Ne III] and [O IV] are present in AGN, BCD, starburst, H II galaxies and have a wide range of ionization potentials and critical densities which allow us to study the connection between the active nucleus and star formation. One must note that H09 found that the most likely contributor to the [O IV] emission in starburst and BCD galaxies is Wolf-Rayet stars. In this regard, and despite the fact that [O IV] emission traces the AGN intrinsic luminosity in pre-selected AGN (Meléndez et al., 2008a), [O IV] cannot be solely associated with the power of the AGN.
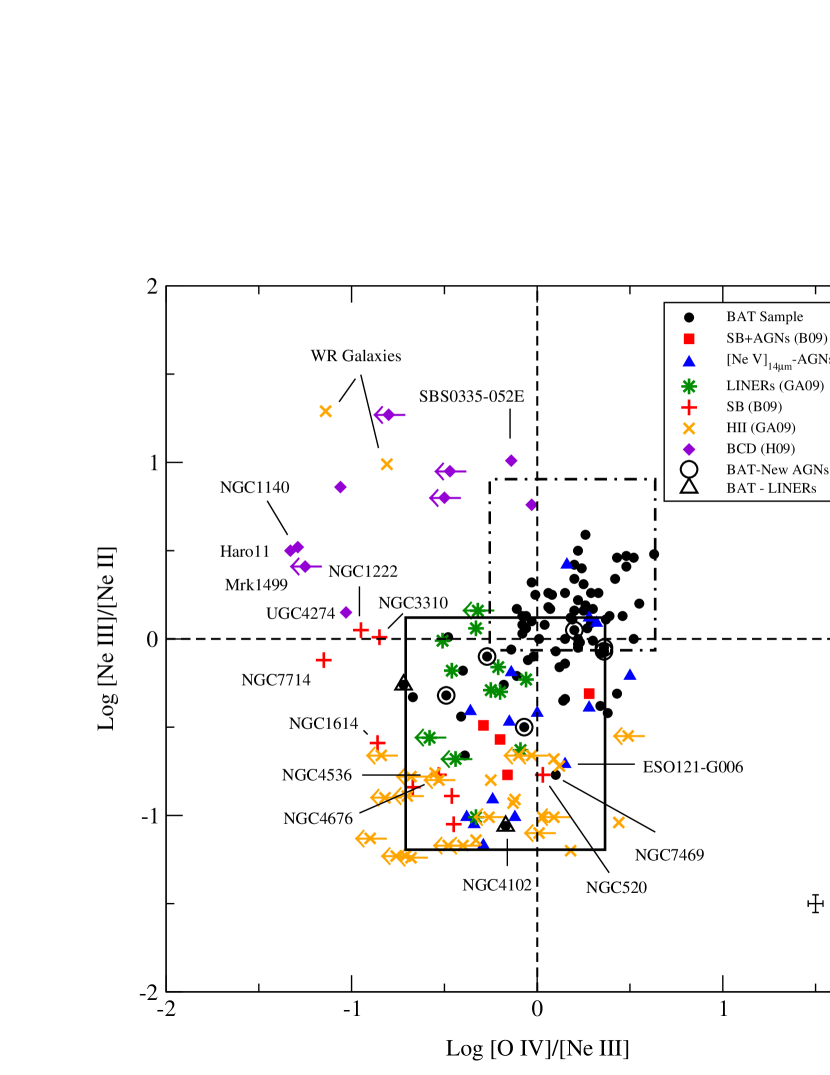
In Figure 9 we compare the [Ne III]/[Ne II] versus [O IV]/[Ne III] ratios. From this comparison there are four distinctive regions to note: 1) the BAT AGN branch; 2) below the BAT AGN are the starburst (SB) and HII galaxies which have an apparent [Ne II] excess; 3) above and to the left of the BAT AGN are the BCD and two WR galaxies from GA09 (II Zw40 and NGC 1569), and 4) LINERs, which seem to follow a connecting path between AGN and SB/HII galaxies but are mainly found in the lower-luminosity region of the BAT AGN branch. Despite the fact that [O IV] has been detected in BCD, SB and HII galaxies, WR and BCD galaxies cannot produce [O IV] as effectively as [Ne III], unlike in AGN, making these sources have relative low [O IV]/[Ne III] ratios. On the other hand, the hardness of the photoionizing continuum from WR stars and other energetics phenomena, such as ULXs, can ionize into resulting in relatively weak [Ne II] (e.g., Berghea et al., 2010), thus the high [Ne III]/[Ne II] ratios observed in some BCD/SB galaxies.
There is also a small “merge” region, at the lower ionization end of the BAT AGN branch, that comprises LINERs and starburst galaxies with evidence for an AGN. This region exemplify the different properties of LINERs, e.g., IR-luminous and -faint LINERs, with the latter having similar SED than that found in starburst galaxies (Sturm et al., 2006). Moreover, in this region we found five of the [Ne V] AGN from GA09, some of which don’t have optical signatures for an AGN. Among these [Ne V] AGN, NGC 660 and NGC 3628 have shown some evidence to harbor a LINER (Filho et al., 2004; Dudik et al., 2005; Flohic et al., 2006). Also, based on this diagnostic, we found that NGC 520, NGC 1614, NGC 4536, NGC 4676 could harbor an AGN, although these starburst galaxies don’t show optical evidence of such (B09;GA09). Of these, there is X-ray evidence for a Compton thick AGN in NGC 1614 (Risaliti et al., 2000a), [Ne V] 14.31µm emission detected in NGC 4536 (Satyapal et al., 2008) and NGC 4676 appears in the multi-wavelength LINER catalogue compiled by Carrillo et al. (1999). Interestingly, these possible AGN are found in interacting systems or mergers with strong star formation. Perhaps, interacting or merger systems may provide enough fuel to the nuclear regions of the galaxy to trigger both the nuclear star formation and the AGN.
We also over plot in Figure 9 the sample of 74 ultraluminous infrared galaxies (ULIRGs) and 34 Palomar-Green quasars (PG QSOs), observed with the IRS Spitzer, from Veilleux et al. (2009). From this comparison its clear that ULIRGs show a wide range of AGN and SB contribution to their mid-infrared emission lines, filling the gap between the BAT AGN and the SB/HII branch and overlapping the small “merge” region defined above, in agreement with the idea that ULIRGs are composite systems mainly powered by stellar activity (Armus et al., 2007; Veilleux et al., 2009). On the other hand, PG QSOs overlap with the BAT AGN branch, in agreement with the high, typically larger than , AGN contribution to their bolometric luminosities (Veilleux et al., 2009). One must note that there are no ULIRGs detected in the Swift-BAT catalog (Tueller et al., 2010; Cusumano et al., 2010), except for the composite system NGC 6240 (Armus et al., 2006).
Moreover, most of the non-BAT AGNs presented in this work, e.g., the SB+AGN sources from B09 and [Ne V] 14.32m-AGN (GA09), in other words, AGN that have been selected because their optical and mid-infrared emission line properties, have smaller mid-infrared ratios than that found for the BAT AGN. In fact, half of the BAT sample can be uniquely distinguished from SB/HII/BCD galaxies by having both [Ne III]/[Ne II] and [O IV]/[Ne III] ratios greater than unity. This result suggests that the BAT sample represents a unique opportunity to study high ionization AGN, i.e., sources in which their optical/mid-infrared emission signatures are dominated by the AGN. Figure 9 shows that the [Ne III]/[Ne II] ratio as a stand alone diagnostic may overestimate the fraction of AGN because Wolf-Rayet stars or another energetic phenomena could produce [Ne III]/[Ne II] ratios even higher than those found on the BAT AGN. However, by further constraining this ratio by using [O IV] we were able to separate AGN from energetic starbursts and other sources.
As we mentioned before, caution must be taken when comparing fluxes between Spitzer high-resolution orders because of the differences in aperture size. However, given the similarities between the ionization potentials for [Ne III] and [O IV], it is likely that both lines originate in similar regions, thus introducing less uncertainty in the use of the [O IV]/[Ne III] ratio. Nevertheless, in HII/SB/BCD galaxies we could be underestimating the amount of [Ne III] that is associated with the same physical conditions that produce [O IV], e.g., WR stars. This will cause this ratio, when derived from equal apertures extractions, to be displaced toward even smaller values thus, enhancing the differences between these sources and our sample of hard X-ray selected AGN.
5 Conclusions
Using high-resolution Spitzer IRS spectra, we have examined the mid-infrared emission-line properties of a sample of hard X-ray selected AGN, detected by Swift/BAT. Our principle conclusions are as follows.
1. The luminosity distribution for the mid-infrared emission lines and BAT continuum luminosities show no differences between Seyfert 1 and Seyfert 2 populations for the BAT sample. The correlations between all the mid-infrared emission lines and BAT in both flux–flux and luminosity–luminosity are statistically significant, even when factoring the distance effect in luminosity-luminosity correlations. The dispersion/tightness in these correlations is due to differences in the X-ray absorbing column densities, dust extinction and/or nuclear star formation activity. Moreover, the tight correlation found in the [Ne III]-BAT relationship suggests that, on average, there is no strong enhancement due to star formation in the [Ne III] emission in the BAT sample. Also, the slopes for the [Ne III],[Ne V] and [O IV] versus BAT luminosities relationships are smaller in Seyfert 1 galaxies than in Seyfert 2s (which are around unity), which suggests that, while the amount of extinction towards the NLR is similar in both types, the X-ray absorbing columns are large enough in Seyfert 2s to affect the hard X-ray band, confirming the results of Meléndez et al. (2008a) and Rigby et al. (2009). This result is in agreement with the fact that the BAT/[O IV] ratio statistically separates Seyfert 1s and Seyfert 2s.
2. Although all of the correlations among the mid-infrared emission lines are strong, the worst correlations are for [Ne V]-[Ne II] and [O IV]-[Ne II], because of enhancement of the [Ne II] from nuclear stellar activity (see also Meléndez et al., 2008b). While the tightness of these mid-infrared correlations suggests that dust extinction is not the driving physical process behind the mid-infrared relationships, approximately 40 (including upper limits) of the sample have values for the ratio of the [Ne V] emission lines below the low-density theoretical limit, suggesting dust extinction as the physical process responsible. Exploring this, we found that all of the newly discovered BAT AGNs in our sample, which are under-luminous in [O IV] and [Ne V]14/24m, are found on inclined host galaxies, and all but one have [Ne V] ratios below the critical density limit. Hence, it is likely that the newly found BAT AGN in our sample lack optical AGN signatures because of host galaxy extinction towards their NLRs. However the lack of correlation between host galaxy inclination and the neon ratios suggest that extinction along the plane of the host galaxy cannot be responsible for the observed extinction in all the BAT AGN sample.
3. We compared the BAT AGNs with different starburst and H II galaxies, so-called [Ne V] active galaxies, and LINERs (Goulding & Alexander, 2009; Bernard-Salas et al., 2009; Hao et al., 2009). We found that the BAT AGN fall into a distinctive region based on the [Ne III]/[Ne II] and [O IV]/[Ne III] ratios. Using [Ne III] and [O IV] emission, previously connected with AGN power (e.g., Gorjian et al., 2007; Meléndez et al., 2008a), does not unambiguously identify AGNs as an stand alone diagnostic because Wolf-Rayet stars or another energetic phenomena (perhaps ULXs) could enhance the observed emission. While it is likely that detection of [Ne V] indicates the presence of an AGN, the strongest of the [Ne V] lines have 1/3 less flux than [O IV] an thus will be more difficult to detect in weak or faint AGN. Therefore, our composite method using the [Ne II], [Ne III] and [O IV], represents a strong and simple diagnostic by using only three emission lines to identify an AGN. Based on this, we found that NGC 520, NGC 1614, NGC 4536, NGC 4676 could harbor an AGN, although these starburst galaxies don’t show optical evidence of such (B09;GA09). Of these, there is X-ray evidence for a Compton thick AGN in NGC 1614 (Risaliti et al., 2000a), [Ne V] 14.31µm emission detected in NGC 4536 (Satyapal et al., 2008) and NGC 4676 appears in the multi-wavelength LINER catalogue compiled by Carrillo et al. (1999). Such line diagnostic will be particularly useful to analyze spectra from new IR missions, such as the James Webb Space Telescope (Gardner et al., 2006).
We also found that ULIRGs and PG QSOs occupy two distinctive regions in our emission line diagnostic. Most ULIRGs fall into the gap between the BAT AGN and the SB/HII branch, in agreement with the idea that ULIRGs are composite systems mainly powered by stellar activity (Armus et al., 2007; Veilleux et al., 2009). On the other hand, PG QSOs overlap with the BAT AGN branch, in agreement with the high, typically larger than , AGN contribution to their bolometric luminosities (Veilleux et al., 2009).
Finally, most of the non-BAT AGNs presented in our study, AGN that have been selected because their optical and mid-infrared emission line properties, have smaller mid-infrared ratios than that found for the BAT AGN. In this regard, half of the BAT sample can be uniquely distinguished from SB/HII/BCD galaxies by having both [Ne III]/[Ne II] and [O IV]/[Ne III] ratios greater than unity. Moreover, when comparing the 12µm and our BAT selected AGN we found that the [Ne III]/[Ne II] ratio distribution between the samples is statistically different with sources in the 12µm sample having on average lower ratios than that found in the BAT AGN, or alternatively higher recent stellar activity. This mild contamination due to star formation becomes noticeable when comparing the 12µm sample with the 14–195 keV sample, the latter of which is less biased towards star-forming systems. Despite the fact that both samples have a strong AGN contribution to their observed narrow line emission, this result suggests that the BAT sample represents a unique opportunity to study high ionization AGN, sources in which their optical/mid-infrared emission signatures are dominated by the AGN, thus, providing the most representative sample in terms of galaxy population and stellar content.
References
- Abel & Satyapal (2008) Abel, N. P., & Satyapal, S. 2008, ApJ, 678, 686
- Akritas & Siebert (1996) Akritas, M. G., & Siebert, J. 1996, MNRAS, 278, 919
- Armus et al. (2006) Armus, L., Bernard-Salas, J., Spoon, H. W. W., Marshall, J. A., Charmandaris, V., Higdon, S. J. U., Desai, V., Hao, L., Teplitz, H. I., Devost, D., Brandl, B. R., Soifer, B. T., & Houck, J. R. 2006, ApJ, 640, 204
- Armus et al. (2007) Armus, L., Charmandaris, V., Bernard-Salas, J., Spoon, H. W. W., Marshall, J. A., Higdon, S. J. U., Desai, V., Teplitz, H. I., Hao, L., Devost, D., Brandl, B. R., Wu, Y., Sloan, G. C., Soifer, B. T., Houck, J. R., & Herter, T. L. 2007, ApJ, 656, 148
- Barger et al. (2005) Barger, A. J., Cowie, L. L., Mushotzky, R. F., Yang, Y., Wang, W., Steffen, A. T., & Capak, P. 2005, AJ, 129, 578
- Barmby et al. (2006) Barmby, P., Alonso-Herrero, A., Donley, J. L., Egami, E., Fazio, G. G., Georgakakis, A., Huang, J., Laird, E. S., Miyazaki, S., Nandra, K., Park, S. Q., Pérez-González, P. G., Rieke, G. H., Rigby, J. R., & Willner, S. P. 2006, ApJ, 642, 126
- Bassani et al. (1999) Bassani, L., Dadina, M., Maiolino, R., Salvati, M., Risaliti, G., della Ceca, R., Matt, G., & Zamorani, G. 1999, ApJS, 121, 473
- Baum et al. (2010) Baum, S. A., Gallimore, J. F., O’Dea, C. P., Buchanan, C. L., Noel-Storr, J., Axon, D. J., Robinson, A., Elitzur, M., Dorn, M., & Staudaher, S. 2010, ApJ, 710, 289
- Berghea et al. (2010) Berghea, C. T., Dudik, R. P., Weaver, K. A., & Kallman, T. R. 2010, ApJ, 708, 354
- Bernard-Salas et al. (2009) Bernard-Salas, J., Spoon, H. W. W., Charmandaris, V., Lebouteiller, V., Farrah, D., Devost, D., Brandl, B. R., Wu, Y., Armus, L., Hao, L., Sloan, G. C., Weedman, D., & Houck, J. R. 2009, ApJS, 184, 230
- Bevington & Robinson (2003) Bevington, P. R., & Robinson, D. K. 2003, Data reduction and error analysis for the physical sciences, ed. P. R. Bevington & D. K. Robinson
- Carrillo et al. (1999) Carrillo, R., Masegosa, J., Dultzin-Hacyan, D., & Ordoñez, R. 1999, Revista Mexicana de Astronomia y Astrofisica, 35, 187
- Cusumano et al. (2010) Cusumano, G., La Parola, V., Segreto, A., Mangano, V., Ferrigno, C., Maselli, A., Romano, P., Mineo, T., Sbarufatti, B., Campana, S., Chincarini, G., Giommi, P., Masetti, N., Moretti, A., & Tagliaferri, G. 2010, A&A, 510, A48+
- Dale et al. (2006) Dale, D. A., Smith, J. D. T., Armus, L., Buckalew, B. A., Helou, G., Kennicutt, Jr., R. C., Moustakas, J., Roussel, H., Sheth, K., Bendo, G. J., Calzetti, D., Draine, B. T., Engelbracht, C. W., Gordon, K. D., Hollenbach, D. J., Jarrett, T. H., Kewley, L. J., Leitherer, C., Li, A., Malhotra, S., Murphy, E. J., & Walter, F. 2006, ApJ, 646, 161
- Diamond-Stanic et al. (2009) Diamond-Stanic, A. M., Rieke, G. H., & Rigby, J. R. 2009, ApJ, 698, 623
- Dudik et al. (2005) Dudik, R. P., Satyapal, S., Gliozzi, M., & Sambruna, R. M. 2005, ApJ, 620, 113
- Dudik et al. (2009) Dudik, R. P., Satyapal, S., & Marcu, D. 2009, ApJ, 691, 1501
- Dudik et al. (2007) Dudik, R. P., Weingartner, J. C., Satyapal, S., Fischer, J., Dudley, C. C., & O’Halloran, B. 2007, ApJ, 664, 71
- Farrah et al. (2007) Farrah, D., Bernard-Salas, J., Spoon, H. W. W., Soifer, B. T., Armus, L., Brandl, B., Charmandaris, V., Desai, V., Higdon, S., Devost, D., & Houck, J. 2007, ApJ, 667, 149
- Filho et al. (2004) Filho, M. E., Fraternali, F., Markoff, S., Nagar, N. M., Barthel, P. D., Ho, L. C., & Yuan, F. 2004, A&A, 418, 429
- Flohic et al. (2006) Flohic, H. M. L. G., Eracleous, M., Chartas, G., Shields, J. C., & Moran, E. C. 2006, ApJ, 647, 140
- Franceschini et al. (2005) Franceschini, A., Manners, J., Polletta, M. d. C., Lonsdale, C., Gonzalez-Solares, E., Surace, J., Shupe, D., Fang, F., Xu, C. K., Farrah, D., Berta, S., Rodighiero, G., Perez-Fournon, I., Hatziminaoglou, E., Smith, H. E., Siana, B., Rowan-Robinson, M., Nandra, K., Babbedge, T., Vaccari, M., Oliver, S., Wilkes, B., Owen, F., Padgett, D., Frayer, D., Jarrett, T., Masci, F., Stacey, G., Almaini, O., McMahon, R., Johnson, O., Lawrence, A., & Willott, C. 2005, AJ, 129, 2074
- Gardner et al. (2006) Gardner, J. P., Mather, J. C., Clampin, M., Doyon, R., Greenhouse, M. A., Hammel, H. B., Hutchings, J. B., Jakobsen, P., Lilly, S. J., Long, K. S., Lunine, J. I., McCaughrean, M. J., Mountain, M., Nella, J., Rieke, G. H., Rieke, M. J., Rix, H., Smith, E. P., Sonneborn, G., Stiavelli, M., Stockman, H. S., Windhorst, R. A., & Wright, G. S. 2006, Space Science Reviews, 123, 485
- Genzel et al. (1998) Genzel, R., Lutz, D., Sturm, E., Egami, E., Kunze, D., Moorwood, A. F. M., Rigopoulou, D., Spoon, H. W. W., Sternberg, A., Tacconi-Garman, L. E., Tacconi, L., & Thatte, N. 1998, ApJ, 498, 579
- George et al. (1998) George, I. M., Turner, T. J., Netzer, H., Nandra, K., Mushotzky, R. F., & Yaqoob, T. 1998, ApJS, 114, 73
- Gilli et al. (2000) Gilli, R., Maiolino, R., Marconi, A., Risaliti, G., Dadina, M., Weaver, K. A., & Colbert, E. J. M. 2000, A&A, 355, 485
- Gorjian et al. (2007) Gorjian, V., Cleary, K., Werner, M. W., & Lawrence, C. R. 2007, ApJ, 655, L73
- Goulding & Alexander (2009) Goulding, A. D., & Alexander, D. M. 2009, MNRAS, 398, 1165
- Hao et al. (2009) Hao, L., Wu, Y., Charmandaris, V., Spoon, H. W. W., Bernard-Salas, J., Devost, D., Lebouteiller, V., & Houck, J. R. 2009, ApJ, 704, 1159
- Heckman et al. (2004) Heckman, T. M., Kauffmann, G., Brinchmann, J., Charlot, S., Tremonti, C., & White, S. D. M. 2004, ApJ, 613, 109
- Heckman et al. (2005) Heckman, T. M., Ptak, A., Hornschemeier, A., & Kauffmann, G. 2005, ApJ, 634, 161
- Higdon et al. (2004) Higdon, S. J. U., Devost, D., Higdon, J. L., Brandl, B. R., Houck, J. R., Hall, P., Barry, D., Charmandaris, V., Smith, J. D. T., Sloan, G. C., & Green, J. 2004, PASP, 116, 975
- Ho & Keto (2007) Ho, L. C., & Keto, E. 2007, ApJ, 658, 314
- Houck et al. (2004) Houck, J. R., Roellig, T. L., van Cleve, J., Forrest, W. J., Herter, T., Lawrence, C. R., Matthews, K., Reitsema, H. J., Soifer, B. T., Watson, D. M., Weedman, D., Huisjen, M., Troeltzsch, J., Barry, D. J., Bernard-Salas, J., Blacken, C. E., Brandl, B. R., Charmandaris, V., Devost, D., Gull, G. E., Hall, P., Henderson, C. P., Higdon, S. J. U., Pirger, B. E., Schoenwald, J., Sloan, G. C., Uchida, K. I., Appleton, P. N., Armus, L., Burgdorf, M. J., Fajardo-Acosta, S. B., Grillmair, C. J., Ingalls, J. G., Morris, P. W., & Teplitz, H. I. 2004, ApJS, 154, 18
- Hunt & Malkan (1999) Hunt, L. K., & Malkan, M. A. 1999, ApJ, 516, 660
- Isobe & Feigelson (1990) Isobe, T., & Feigelson, E. D. 1990, in Bulletin of the American Astronomical Society, Vol. 22, Bulletin of the American Astronomical Society, 917–918
- Isobe et al. (1990) Isobe, T., Feigelson, E. D., Akritas, M. G., & Babu, G. J. 1990, ApJ, 364, 104
- Isobe et al. (1986) Isobe, T., Feigelson, E. D., & Nelson, P. I. 1986, ApJ, 306, 490
- Kessler et al. (1996) Kessler, M. F., Steinz, J. A., Anderegg, M. E., Clavel, J., Drechsel, G., Estaria, P., Faelker, J., Riedinger, J. R., Robson, A., Taylor, B. G., & Ximénez de Ferrán, S. 1996, A&A, 315, L27
- Khachikian & Weedman (1974) Khachikian, E. Y., & Weedman, D. W. 1974, ApJ, 192, 581
- Kirhakos & Steiner (1990) Kirhakos, S. D., & Steiner, J. E. 1990, AJ, 99, 1722
- Koratkar & Blaes (1999) Koratkar, A., & Blaes, O. 1999, PASP, 111, 1
- Kuraszkiewicz et al. (2003) Kuraszkiewicz, J. K., Wilkes, B. J., Hooper, E. J., McLeod, K. K., Wood, K., Bjorkman, J., Delain, K. M., Hughes, D. H., Elvis, M. S., Impey, C. D., Lonsdale, C. J., Malkan, M. A., McDowell, J. C., & Whitney, B. 2003, ApJ, 590, 128
- La Massa et al. (2009) La Massa, S. M., Heckman, T. M., Ptak, A., Hornschemeier, A., Martins, L., Sonnentrucker, P., & Tremonti, C. 2009, ApJ, 705, 568
- Landi et al. (2007) Landi, R., Masetti, N., Morelli, L., Palazzi, E., Bassani, L., Malizia, A., Bazzano, A., Bird, A. J., Dean, A. J., Galaz, G., Minniti, D., & Ubertini, P. 2007, ApJ, 669, 109
- Levine et al. (1984) Levine, A. M., Lang, F. L., Lewin, W. H. G., Primini, F. A., Dobson, C. A., Doty, J. P., Hoffman, J. A., Howe, S. K., Scheepmaker, A., Wheaton, W. A., Matteson, J. L., Baity, W. A., Gruber, D. E., Knight, F. K., Nolan, P. L., Pelling, R. M., Rothschild, R. E., & Peterson, L. E. 1984, ApJS, 54, 581
- Li & Draine (2001) Li, A., & Draine, B. T. 2001, ApJ, 554, 778
- Lutz et al. (2004) Lutz, D., Maiolino, R., Spoon, H. W. W., & Moorwood, A. F. M. 2004, A&A, 418, 465
- Lutz et al. (2005) Lutz, D., Yan, L., Armus, L., Helou, G., Tacconi, L. J., Genzel, R., & Baker, A. J. 2005, ApJ, 632, L13
- Markwardt et al. (2005) Markwardt, C. B., Tueller, J., Skinner, G. K., Gehrels, N., Barthelmy, S. D., & Mushotzky, R. F. 2005, ApJ, 633, L77
- Masetti et al. (2008) Masetti, N., Mason, E., Morelli, L., Cellone, S. A., McBride, V. A., Palazzi, E., Bassani, L., Bazzano, A., Bird, A. J., Charles, P. A., Dean, A. J., Galaz, G., Gehrels, N., Landi, R., Malizia, A., Minniti, D., Panessa, F., Romero, G. E., Stephen, J. B., Ubertini, P., & Walter, R. 2008, A&A, 482, 113
- Matt (2000) Matt, G. 2000, A&A, 355, L31
- Meléndez et al. (2008a) Meléndez, M., Kraemer, S. B., Armentrout, B. K., Deo, R. P., Crenshaw, D. M., Schmitt, H. R., Mushotzky, R. F., Tueller, J., Markwardt, C. B., & Winter, L. 2008a, ApJ, 682, 94
- Meléndez et al. (2008b) Meléndez, M., Kraemer, S. B., Schmitt, H. R., Crenshaw, D. M., Deo, R. P., Mushotzky, R. F., & Bruhweiler, F. C. 2008b, ApJ, 689, 95
- Mulchaey et al. (1994) Mulchaey, J. S., Koratkar, A., Ward, M. J., Wilson, A. S., Whittle, M., Antonucci, R. R. J., Kinney, A. L., & Hurt, T. 1994, ApJ, 436, 586
- Mushotzky (2004) Mushotzky, R. 2004, in Astrophysics and Space Science Library, Vol. 308, Supermassive Black Holes in the Distant Universe, ed. A. J. Barger, 53–+
- Netzer et al. (2006) Netzer, H., Mainieri, V., Rosati, P., & Trakhtenbrot, B. 2006, A&A, 453, 525
- Netzer et al. (2004) Netzer, H., Shemmer, O., Maiolino, R., Oliva, E., Croom, S., Corbett, E., & di Fabrizio, L. 2004, ApJ, 614, 558
- Peterson et al. (2004) Peterson, B. M., Ferrarese, L., Gilbert, K. M., Kaspi, S., Malkan, M. A., Maoz, D., Merritt, D., Netzer, H., Onken, C. A., Pogge, R. W., Vestergaard, M., & Wandel, A. 2004, ApJ, 613, 682
- Press et al. (1992) Press, W. H., Teukolsky, S. A., Vetterling, W. T., & Flannery, B. P. 1992, Numerical recipes in FORTRAN. The art of scientific computing, ed. T. S. A. V. W. T. . F. B. P. Press, W. H.
- Rees (1984) Rees, M. J. 1984, ARA&A, 22, 471
- Rigby et al. (2009) Rigby, J. R., Diamond-Stanic, A. M., & Aniano, G. 2009, ApJ, 700, 1878
- Risaliti et al. (2000a) Risaliti, G., Gilli, R., Maiolino, R., & Salvati, M. 2000a, A&A, 357, 13
- Risaliti et al. (2000b) Risaliti, G., Maiolino, R., & Bassani, L. 2000b, A&A, 356, 33
- Satyapal et al. (2009) Satyapal, S., Böker, T., Mcalpine, W., Gliozzi, M., Abel, N. P., & Heckman, T. 2009, ApJ, 704, 439
- Satyapal et al. (2004) Satyapal, S., Sambruna, R. M., & Dudik, R. P. 2004, A&A, 414, 825
- Satyapal et al. (2008) Satyapal, S., Vega, D., Dudik, R. P., Abel, N. P., & Heckman, T. 2008, ApJ, 677, 926
- Satyapal et al. (2007) Satyapal, S., Vega, D., Heckman, T., O’Halloran, B., & Dudik, R. 2007, ApJ, 663, L9
- Schweitzer et al. (2006) Schweitzer, M., Lutz, D., Sturm, E., Contursi, A., Tacconi, L. J., Lehnert, M. D., Dasyra, K. M., Genzel, R., Veilleux, S., Rupke, D., Kim, D., Baker, A. J., Netzer, H., Sternberg, A., Mazzarella, J., & Lord, S. 2006, ApJ, 649, 79
- Simcoe et al. (1997) Simcoe, R., McLeod, K. K., Schachter, J., & Elvis, M. 1997, ApJ, 489, 615
- Sturm et al. (2002) Sturm, E., Lutz, D., Verma, A., Netzer, H., Sternberg, A., Moorwood, A. F. M., Oliva, E., & Genzel, R. 2002, A&A, 393, 821
- Sturm et al. (2006) Sturm, E., Rupke, D., Contursi, A., Kim, D., Lutz, D., Netzer, H., Veilleux, S., Genzel, R., Lehnert, M., Tacconi, L. J., Maoz, D., Mazzarella, J., Lord, S., Sanders, D., & Sternberg, A. 2006, ApJ, 653, L13
- Tommasin et al. (2010) Tommasin, S., Spinoglio, L., Malkan, M. A., & Fazio, G. 2010, ApJ, 709, 1257
- Tommasin et al. (2008) Tommasin, S., Spinoglio, L., Malkan, M. A., Smith, H., González-Alfonso, E., & Charmandaris, V. 2008, ApJ, 676, 836
- Tueller et al. (2010) Tueller, J., Baumgartner, W. H., Markwardt, C. B., Skinner, G. K., Mushotzky, R. F., Ajello, M., Barthelmy, S., Beardmore, A., Brandt, W. N., Burrows, D., Chincarini, G., Campana, S., Cummings, J., Cusumano, G., Evans, P., Fenimore, E., Gehrels, N., Godet, O., Grupe, D., Holland, S., Kennea, J., Krimm, H. A., Koss, M., Moretti, A., Mukai, K., Osborne, J. P., Okajima, T., Pagani, C., Page, K., Palmer, D., Parsons, A., Schneider, D. P., Sakamoto, T., Sambruna, R., Sato, G., Stamatikos, M., Stroh, M., Ukwata, T., & Winter, L. 2010, ApJS, 186, 378
- Tueller et al. (2008) Tueller, J., Mushotzky, R. F., Barthelmy, S., Cannizzo, J. K., Gehrels, N., Markwardt, C. B., Skinner, G. K., & Winter, L. M. 2008, ApJ, 681, 113
- Tully (1988) Tully, R. B. 1988, Nearby galaxies catalog, ed. Tully, R. B.
- Tully et al. (2009) Tully, R. B., Rizzi, L., Shaya, E. J., Courtois, H. M., Makarov, D. I., & Jacobs, B. A. 2009, AJ, 138, 323
- Ueda et al. (2007) Ueda, Y., Eguchi, S., Terashima, Y., Mushotzky, R., Tueller, J., Markwardt, C., Gehrels, N., Hashimoto, Y., & Potter, S. 2007, ApJ, 664, L79
- Veilleux et al. (2009) Veilleux, S., Rupke, D. S. N., Kim, D., Genzel, R., Sturm, E., Lutz, D., Contursi, A., Schweitzer, M., Tacconi, L. J., Netzer, H., Sternberg, A., Mihos, J. C., Baker, A. J., Mazzarella, J. M., Lord, S., Sanders, D. B., Stockton, A., Joseph, R. D., & Barnes, J. E. 2009, ApJS, 182, 628
- Véron-Cetty & Véron (2006) Véron-Cetty, M., & Véron, P. 2006, A&A, 455, 773
- Weedman et al. (2005) Weedman, D. W., Hao, L., Higdon, S. J. U., Devost, D., Wu, Y., Charmandaris, V., Brandl, B., Bass, E., & Houck, J. R. 2005, ApJ, 633, 706
- Weingartner & Draine (2001) Weingartner, J. C., & Draine, B. T. 2001, ApJ, 548, 296
- Werner et al. (2004) Werner, M. W., Roellig, T. L., Low, F. J., Rieke, G. H., Rieke, M., Hoffmann, W. F., Young, E., Houck, J. R., Brandl, B., Fazio, G. G., Hora, J. L., Gehrz, R. D., Helou, G., Soifer, B. T., Stauffer, J., Keene, J., Eisenhardt, P., Gallagher, D., Gautier, T. N., Irace, W., Lawrence, C. R., Simmons, L., Van Cleve, J. E., Jura, M., Wright, E. L., & Cruikshank, D. P. 2004, ApJS, 154, 1
- Winter et al. (2010) Winter, L. M., Lewis, K. T., Koss, M., Veilleux, S., Keeney, B., & Mushotzky, R. F. 2010, ApJ, 710, 503
- Winter et al. (2009a) Winter, L. M., Mushotzky, R. F., Reynolds, C. S., & Tueller, J. 2009a, ApJ, 690, 1322
- Winter et al. (2009b) Winter, L. M., Mushotzky, R. F., Terashima, Y., & Ueda, Y. 2009b, ApJ, 701, 1644
- Winter et al. (2008) Winter, L. M., Mushotzky, R. F., Tueller, J., & Markwardt, C. 2008, ApJ, 674, 686
| Name | Distance | TypeaaAGN types are taken from NED. | BATbbThe BAT flux is presented in units of . | [Ne II] | [Ne V] | [Ne III] | [Ne V] | [O IV] |
|---|---|---|---|---|---|---|---|---|
| (Mpc) | (12.81m) | (14.32m) | (15.56m) | (24.32m) | (25.89m) | |||
| Integrated Line Fluxes () | ||||||||
| 2MASX J05580206-3820043 | 146.8 | 1 | 3.99 0.37 | 3.20 0.89 | 1.89 0.13 | 4.72 0.14 | 3.80 0.51 | 3.69 0.45 |
| 3C120 | 143.0 | 1 | 11.89 0.63 | 9.19 0.66 | 17.21 0.28 | 27.43 0.92 | 27.63 8.92 | 116.68 1.22 |
| Ark 120 | 141.7 | 1 | 7.08 0.57 | 3.47 0.91 | 1.18 | 4.33 0.79 | 1.29 | 4.03 0.38 |
| Cen Ac,gc,gfootnotemark: | 4.9 | 2 | 92.62 0.71 | 193.00 | 23.16 | 147.65 | 29.92 | 131.24 |
| ESO 005-G004ggDistances are taken from EDD | 22.4 | 4.48 0.60 | 16.64 1.19 | 0.50 0.12 | 5.29 0.34 | 0.49 | 4.49 0.19 | |
| ESO 033- G002 | 77.5 | 2 | 2.61 0.45 | 2.67 0.18 | 5.57 0.56 | 8.34 0.56 | 5.37 0.51 | 13.85 0.73 |
| ESO 103-G035 | 56.7 | 2 | 11.14 0.59 | 30.92 2.07 | 15.85 3.49 | 41.62 1.78 | 10.31 0.87 | 34.40 0.75 |
| ESO 140-G043 | 60.5 | 1 | 4.57 0.66 | 11.41 0.26 | 7.83 0.70 | 13.93 0.32 | 7.95 0.44 | 27.46 0.35 |
| ESO 323-G077 | 64.2 | 1.2 | 4.70 0.66 | 40.16 1.41 | 5.44 1.61 | 18.07 1.07 | 6.19 0.14 | 25.11 0.62 |
| ESO 362-G018 | 53.1 | 1.5 | 6.22 0.52 | 9.94 0.23 | 3.15 0.37 | 7.16 0.18 | 2.75 0.20 | 10.11 0.37 |
| ESO 417- G006 | 69.7 | 2 | 3.06 0.46 | 1.77 0.14 | 0.42 0.10 | 2.54 0.07 | 0.47 0.16 | 4.04 0.18 |
| F9 | 205.9 | 1 | 5.07 0.45 | 2.91 0.68 | 2.66 | 5.31 0.37 | 2.74 0.37 | 6.08 0.26 |
| F49 | 86.2 | 2 | 2.93 0.54 | 39.55 2.93 | 25.50 2.96 | 47.12 2.43 | 12.74 0.36 | 39.22 2.37 |
| IC 486 | 114.8 | 1 | 3.22 0.70 | 6.86 0.05 | 3.30 0.20 | 6.79 0.21 | 2.84 0.01 | 11.19 0.29 |
| IC 1816 | 72.5 | 1 | 2.58 0.48 | 18.36 1.51 | 6.21 0.61 | 19.64 1.17 | 4.34 0.30 | 16.52 1.81 |
| IC 4329A | 68.7 | 1.2 | 33.08 0.62 | 30.19 2.76 | 32.79 6.01 | 65.30 0.95 | 29.90 1.74 | 103.58 3.24 |
| IC 5063 | 48.3 | 2 | 8.59 0.72 | 28.22 3.34 | 35.97 1.58 | 73.67 4.61 | 25.86 1.20 | 117.21 11.13 |
| MCG-01-13-025ffFrom the 9-month BAT survey (Tueller et al., 2008) | 68.0 | 1.2 | 4.5 | 2.87 0.18 | 0.18 | 1.90 0.05 | 1.44 | 0.76 0.18 |
| MCG-05-23-016 | 36.1 | 2 | 20.77 0.56 | 18.13 0.42 | 11.06 0.50 | 16.96 0.93 | 11.19 0.26 | 27.95 7.61 |
| MCG-01-24-012 | 84.2 | 2 | 4.58 0.51 | 6.74 0.41 | 2.90 0.27 | 6.07 0.36 | 2.30 0.58 | 10.07 0.77 |
| MCG-02-58-22 | 205.1 | 1.5 | 10.17 0.57 | 5.29 0.39 | 2.80 0.34 | 9.71 0.16 | 3.05 0.39 | 13.74 1.74 |
| MCG-03-34-064 | 70.8 | 1.8 | 3.15 0.45 | 57.83 7.29 | 54.98 5.26 | 120.13 6.88 | 35.46 1.92 | 110.83 9.35 |
| MCG-06-30-015 | 32.9 | 1.2 | 7.82 0.57 | 4.20 0.12 | 6.05 0.76 | 6.62 0.33 | 6.62 0.05 | 23.49 0.81 |
| MRK 3ccWeedman et al. (2005) | 57.7 | 2 | 15.65 0.61 | 100.00 | 64.50 | 179.00 | 67.50 | 214.00 |
| MRK 6ddTommasin et al. (2008) | 80.6 | 1.5 | 7.61 0.55 | 28.00 0.23 | 9.39 0.19 | 49.34 0.32 | 10.43 0.21 | 48.24 0.27 |
| MRK 18ffFrom the 9-month BAT survey (Tueller et al., 2008) | 47.2 | 3.1 | 17.04 0.71 | 0.78 0.01 | 8.24 0.24 | 2.25 | 2.69 0.14 | |
| MRK 79 | 95.3 | 1.2 | 4.89 0.52 | 11.29 3.71 | 9.62 1.07 | 20.43 0.50 | 13.16 1.10 | 39.99 2.68 |
| MRK 335 | 111.1 | 1.2 | 2.47 0.41 | 2.10 0.31 | 1.31 0.11 | 2.70 0.15 | 1.55 | 6.31 0.17 |
| MRK 348 | 64.2 | 2 | 13.66 0.56 | 15.34 0.74 | 6.90 0.36 | 20.60 0.79 | 4.75 0.27 | 17.87 0.23 |
| MRK 352 | 63.5 | 1 | 4.16 0.50 | 0.54 0.08 | 0.16 | 0.34 0.02 | 0.23 | 0.26 0.04 |
| MRK 509 | 149.2 | 1.2 | 9.44 0.68 | 11.98 1.06 | 7.61 1.74 | 17.32 3.29 | 7.60 0.10 | 27.54 0.42 |
| MRK 590ffFrom the 9-month BAT survey (Tueller et al., 2008) | 112.7 | 1.2 | 3.7 | 5.26 0.46 | 3.22 | 5.42 0.12 | 1.23 | 1.79 0.26 |
| MRK 766 | 55.2 | 1.5 | 2.42 0.29 | 24.27 0.94 | 22.14 0.23 | 23.52 1.41 | 18.32 1.60 | 46.47 0.84 |
| MRK 817 | 136.1 | 1.5 | 2.21 0.36 | 4.57 0.88 | 2.88 0.48 | 5.51 0.77 | 4.22 0.73 | 6.06 0.23 |
| MRK 841 | 158.2 | 1.5 | 2.93 0.37 | 3.18 0.18 | 8.12 0.31 | 12.46 0.73 | 6.96 0.33 | 22.91 1.08 |
| NGC 454ffFrom the 9-month BAT survey (Tueller et al., 2008) | 51.8 | 2 | 2.3 | 4.70 0.40 | 3.73 0.14 | 6.40 0.17 | 5.54 0.31 | 15.80 0.85 |
| NGC 513 | 83.8 | 2 | 2.06 0.43 | 10.38 1.78 | 1.52 0.23 | 4.71 0.32 | 1.38 0.21 | 6.69 0.41 |
| NGC 788 | 58.1 | 2 | 9.33 0.57 | 6.59 0.11 | 5.35 0.34 | 13.60 0.50 | 8.68 1.28 | 24.14 0.36 |
| NGC 931 | 71.2 | 1.5 | 6.56 0.50 | 5.50 0.59 | 9.91 2.31 | 15.94 0.52 | 13.52 0.58 | 42.90 0.63 |
| NGC 973 | 69.3 | 3.09 0.58 | 8.03 0.09 | 2.07 0.18 | 8.92 0.38 | 3.21 0.27 | 14.11 2.64 | |
| NGC 1052ggDistances are taken from EDD | 17.8 | LINER | 3.75 0.67 | 22.22 0.94 | 0.64 0.03 | 12.31 0.48 | 2.69 1.33 | 2.37 0.10 |
| NGC 1194 | 58.0 | 1.9 | 3.64 0.60 | 3.27 0.34 | 4.48 0.12 | 8.27 0.41 | 3.98 0.32 | 14.39 0.10 |
| NGC 1365ggDistances are taken from EDD | 18.9 | 1.8 | 7.19 0.44 | 161.67 17.48 | 22.35 1.97 | 61.06 0.90 | 38.53 1.50 | 145.38 8.89 |
| NGC 2110 | 33.1 | 2 | 35.01 0.70 | 60.19 5.34 | 5.22 0.82 | 47.40 0.71 | 7.65 0.63 | 45.71 3.41 |
| NGC 2992ggDistances are taken from EDD | 30.5 | 2 | 4.82 0.63 | 53.65 3.66 | 32.62 5.38 | 61.06 1.98 | 27.81 0.20 | 114.22 6.44 |
| NGC 3079c,gc,gfootnotemark: | 20.4 | 2 | 3.44 0.44 | 104.00 | 1.04 | 22.88 | 1.56 | 9.26 |
| NGC 3081ggDistances are taken from EDD | 32.5 | 2 | 10.24 0.67 | 12.62 1.16 | 12.62 0.81 | 36.46 1.25 | 35.79 0.05 | 119.73 8.42 |
| NGC 3227ggDistances are taken from EDD | 20.6 | 1.5 | 14.13 0.50 | 65.05 6.91 | 26.23 1.23 | 74.62 2.00 | 17.82 0.99 | 64.91 2.31 |
| NGC 3281 | 45.5 | 2 | 9.01 0.66 | 19.94 2.16 | 47.51 2.75 | 58.35 2.48 | 42.15 3.24 | 174.65 13.25 |
| NGC 3516d,gd,gfootnotemark: | 38.9 | 1.5 | 12.54 0.45 | 8.07 0.25 | 7.88 0.50 | 17.72 0.33 | 10.39 0.33 | 46.92 0.35 |
| NGC 3783ggDistances are taken from EDD | 38.5 | 1 | 19.45 0.66 | 19.82 0.79 | 19.54 3.44 | 26.18 0.57 | 13.82 0.29 | 39.25 0.07 |
| NGC 4051ggDistances are taken from EDD | 17.1 | 1.5 | 4.34 0.35 | 19.69 0.92 | 10.17 0.65 | 16.35 0.44 | 16.19 2.53 | 36.95 2.05 |
| NGC 4102ggDistances are taken from EDD | 17.0 | LINER | 2.58 0.38 | 349.81 39.88 | 8.10 | 30.44 1.12 | 6.29 | 20.66 7.69 |
| NGC 4138ggDistances are taken from EDD | 17.0 | 1.9 | 3.69 0.45 | 3.23 0.52 | 0.54 0.10 | 2.82 0.37 | 0.83 | 2.03 0.18 |
| NGC 4151c,gc,gfootnotemark: | 20.3 | 1.5 | 62.23 0.46 | 134.00 | 77.72 | 204.35 | 67.67 | 236.51 |
| NGC 4235ggDistances are taken from EDD | 35.1 | 1 | 2.40 0.55 | 3.69 0.65 | 0.58 | 3.70 0.54 | 0.92 0.19 | 3.77 0.77 |
| NGC 4388ggDistances are taken from EDD | 16.8 | 2 | 34.64 0.52 | 79.74 4.76 | 45.35 0.84 | 108.18 1.56 | 64.10 0.12 | 311.42 25.79 |
| NGC 4395ggDistances are taken from EDD | 3.9 | 1.8 | 3.12 0.41 | 4.74 0.25 | 1.47 0.13 | 7.02 0.58 | 1.49 0.62 | 8.16 0.26 |
| NGC 4507 | 50.3 | 2 | 22.51 0.68 | 33.73 2.63 | 12.50 1.39 | 28.63 2.36 | 10.72 1.96 | 36.33 4.14 |
| NGC 4593ggDistances are taken from EDD | 39.5 | 1 | 9.79 0.62 | 8.31 0.30 | 5.56 1.27 | 7.89 0.59 | 8.02 1.96 | 13.39 2.00 |
| NGC 4686 | 71.6 | 3.08 0.45 | 2.13 0.16 | 0.22 | 1.71 0.13 | 0.53 0.09 | 0.91 0.30 | |
| NGC 526A | 81.9 | 1.5 | 5.96 0.51 | 6.22 1.61 | 3.94 0.47 | 9.59 1.10 | 3.87 0.86 | 17.34 0.84 |
| NGC 5506ggDistances are taken from EDD | 28.7 | 1.9 | 25.64 0.50 | 91.75 3.31 | 58.28 3.34 | 152.13 9.13 | 63.25 2.40 | 252.82 2.29 |
| NGC 5548 | 73.5 | 1.5 | 8.08 0.50 | 8.93 0.70 | 1.95 0.10 | 8.99 0.97 | 1.73 0.75 | 12.75 0.80 |
| NGC 5728ggDistances are taken from EDD | 42.2 | 2 | 10.54 0.71 | 30.44 1.81 | 23.56 0.77 | 54.76 0.51 | 28.15 0.56 | 118.40 7.61 |
| NGC 5995 | 108.5 | 2 | 4.51 0.61 | 13.32 1.91 | 7.60 1.42 | 9.19 0.59 | 4.61 0.84 | 12.20 0.80 |
| NGC 6240eeArmus et al. (2006) | 105.4 | 2 | 7.30 0.62 | 193.10 3.70 | 5.10 0.90 | 70.40 2.40 | 3.90 | 27.20 0.70 |
| NGC 6860 | 63.6 | 1 | 6.50 0.73 | 5.88 0.11 | 2.95 0.94 | 7.50 0.53 | 2.84 0.21 | 11.70 0.39 |
| NGC 7172ggDistances are taken from EDD | 33.9 | 2 | 18.11 0.70 | 32.03 2.44 | 8.99 0.80 | 15.71 0.69 | 11.26 0.95 | 42.60 3.44 |
| NGC 7213ggDistances are taken from EDD | 22.0 | 1.5 | 5.75 0.67 | 27.47 1.33 | 0.56 0.01 | 12.77 0.66 | 1.94 | 2.75 0.59 |
| NGC 7314ggDistances are taken from EDD | 18.3 | 1.9 | 4.63 0.59 | 8.97 0.74 | 16.84 0.60 | 23.28 0.41 | 21.92 0.40 | 69.62 7.82 |
| NGC 7469ccWeedman et al. (2005) | 69.8 | 1.2 | 6.66 0.44 | 200.00 | 11.60 | 34.00 | 14.70 | 43.00 |
| NGC 7582ggDistances are taken from EDD | 22.0 | 2 | 7.92 0.55 | 250.94 3.53 | 38.02 3.86 | 104.99 4.37 | 59.54 6.39 | 227.65 10.88 |
| NGC 7603 | 127.6 | 1.5 | 4.70 0.51 | 9.32 0.72 | 0.47 0.01 | 5.07 0.49 | 0.38 | 3.34 0.18 |
| NGC 7682 | 73.4 | 2 | 2.27 | 5.46 0.25 | 1.98 0.19 | 8.07 0.15 | 3.69 1.46 | 16.21 0.66 |
| UGC 03601 | 73.3 | 1.5 | 4.38 0.67 | 5.26 0.53 | 2.01 0.12 | 7.60 0.13 | 1.79 0.44 | 13.45 0.65 |
| UGC 06728 | 27.7 | 1.2 | 2.95 0.37 | 1.40 0.36 | 1.16 0.10 | 1.38 0.05 | 3.24 0.03 | 4.61 0.81 |
| UGC 12282 | 72.7 | 2.49 0.50 | 2.08 0.28 | 0.50 0.01 | 1.76 0.05 | 1.44 0.20 | 4.07 0.37 | |
| UGC 12741 | 74.7 | 4.00 0.59 | 1.72 0.07 | 0.39 0.06 | 1.55 0.05 | 0.65 0.06 | 3.58 0.38 | |
| Variables | |||||||
|---|---|---|---|---|---|---|---|
| All Sample | |||||||
| BAT – [Ne II] | 0.66 | 0.49 | 0.37 | 0.07 | |||
| BAT – [Ne III] | 0.76 | 0.58 | 0.45 | 0.06 | |||
| BAT – [O IV] | 0.65 | 0.48 | 0.36 | 0.06 | |||
| BAT – [Ne V]14µm | 0.63 | 0.50 | 0.38 | 0.07 | |||
| [NeIII] – [NeII] | 0.89 | 0.74 | 0.68 | 0.06 | |||
| [O IV] – [Ne II] | 0.80 | 0.60 | 0.54 | 0.06 | |||
| [O IV] – [Ne III] | 0.94 | 0.80 | 0.76 | 0.06 | |||
| [Ne V]14µm – [Ne II] | 0.77 | 0.59 | 0.53 | 0.06 | |||
| [Ne V]14µm – [Ne III] | 0.91 | 0.79 | 0.75 | 0.06 | |||
| [Ne V]14µm – [O IV] | 0.94 | 0.80 | 0.77 | 0.06 | |||
| [Ne V]24µm – [Ne V]14 | 0.93 | 0.80 | 0.77 | 0.06 | |||
| Seyfert 1 Galaxies | |||||||
| BAT – [Ne II] | 0.75 | 0.60 | 0.37 | 0.11 | |||
| BAT – [Ne III] | 0.82 | 0.66 | 0.41 | 0.12 | |||
| BAT – [O IV] | 0.72 | 0.56 | 0.33 | 0.11 | |||
| BAT – [Ne V] | 0.61 | 0.52 | 0.32 | 0.12 | |||
| [O IV] – [Ne II] | 0.84 | 0.66 | 0.54 | 0.09 | |||
| [O IV] – [Ne III] | 0.93 | 0.79 | 0.71 | 0.08 | |||
| [Ne V]14µm – [Ne II] | 0.77 | 0.61 | 0.49 | 0.08 | |||
| [Ne V]14µm – [Ne III] | 0.86 | 0.75 | 0.67 | 0.08 | |||
| [Ne V]14µm – [O IV] | 0.92 | 0.78 | 0.72 | 0.08 | |||
| [Ne V]24µm – [Ne V]14 | 0.92 | 0.81 | 0.77 | 0.08 | |||
| Seyfert 2 Galaxies | |||||||
| BAT – [Ne II] | 0.63 | 0.48 | 0.40 | 0.11 | |||
| BAT – [Ne III] | 0.71 | 0.55 | 0.45 | 0.10 | |||
| BAT – [O IV] | 0.56 | 0.42 | 0.33 | 0.10 | |||
| BAT – [Ne V] | 0.65 | 0.49 | 0.38 | 0.11 | |||
| [O IV] – [Ne II] | 0.76 | 0.59 | 0.54 | 0.09 | |||
| [O IV] – [Ne III] | 0.94 | 0.81 | 0.79 | 0.08 | |||
| [Ne V]14µm – [Ne II] | 0.73 | 0.58 | 0.52 | 0.09 | |||
| [Ne V]14µm – [Ne III] | 0.94 | 0.83 | 0.80 | 0.10 | |||
| [Ne V]14µm – [O IV] | 0.94 | 0.80 | 0.78 | 0.09 | |||
| [Ne V]24µm – [Ne V]14 | 0.92 | 0.80 | 0.78 | 0.09 |
Note. — is the Spearman rank order correlation coefficient with its associated null probability, . represents the generalized Kendall’s correlation coefficient for censored data and is the Kendall’s coefficient for partial correlation with censored data. and are the null probabilities for the generalized and partial Kendall’s correlation test, respectively. We also present the calculated variance, , for Kendall . We have used a partial correlation test to exclude the effect of redshift (distance) in the Luminosity-Luminosity correlations.
| Seyfert 1 | Seyfert 2 | ||||||
|---|---|---|---|---|---|---|---|
| Measurements | Standard | Measurements | Standard | ||||
| Available | Median | Deviation | Available | Median | Deviation | (%) | |
| 38 | 2.5 | 0.5 | 33 | 2.4 | 0.5 | 2.4 | |
| 38 | 2.8 | 0.4 | 33 | 2.5 | 0.4 | 9.0 | |
| 32 | 3.0 | 0.4 | 33 | 2.9 | 0.5 | 26.1 | |
| 31 | 3.0 | 0.5 | 30 | 2.8 | 0.3 | 9.5 | |
| 38 | 2.9 | 0.4 | 33 | 2.7 | 0.5 | 2.8 | |
| 38 | 1.2 | 0.1 | 33 | 1.4 | 0.1 | 54.8 | |
| 38 | 1.8 | 0.4 | 33 | 1.7 | 0.4 | 84.5 | |
| 38 | 1.5 | 0.1 | 33 | 1.7 | 0.1 | 91.4 | |
| 29 | 1.0 | 0.3 | 30 | 1.0 | 0.4 | 94.0 | |
| 38 | 43.55 | 0.573 | 33 | 43.28 | 0.657 | 6.3 | |
| 38 | 40.79 | 0.613 | 33 | 40.76 | 0.799 | 82.6 | |
| 32 | 40.54 | 0.659 | 33 | 40.33 | 0.886 | 69.8 | |
| 38 | 40.92 | 0.668 | 33 | 40.74 | 0.776 | 50.9 | |
| 31 | 40.52 | 0.623 | 30 | 40.44 | 0.746 | 28.6 | |
| 38 | 40.98 | 0.744 | 33 | 41.00 | 0.793 | 98.1 | |
Note. — The last column, , represents the Kolmogorov-Smirnov (K-S) test null probability. Upper limits for the [Ne V] fluxes are not included. This table also includes information about the numbers of Seyfert 1 and Seyfert 2 galaxies, median values and standard deviations of the mean for the measured quantities.
| Log X - Log Y | Y=aX+b | |
|---|---|---|
| a | b | |
| All Sample | ||
| BAT – [Ne II] | 0.72 0.11 | 9.60 4.85 |
| BAT – [Ne III] | 0.88 0.06 | 2.58 2.70 |
| BAT – [O IV] | 0.93 0.08 | 0.42 3.32 |
| BAT – [Ne V]14µm | 1.00 0.10 | -3.28 4.51 |
| [O IV] – [Ne II] | 0.85 0.07 | 5.83 2.67 |
| [O IV] – [Ne III] | 0.90 0.04 | 3.96 1.65 |
| [Ne III] – [Ne II] | 0.94 0.04 | 2.22 1.80 |
| [Ne V]14µm – [Ne II] | 0.67 0.06 | 13.46 2.35 |
| [Ne V]14µm – [Ne III] | 0.82 0.04 | 7.80 1.43 |
| [Ne V]14µm – [O IV] | 0.93 0.03 | 3.59 1.20 |
| [Ne V]24µm – [Ne V]14µm | 0.89 0.05 | 4.52 2.20 |
| Seyfert 1 Galaxies | ||
| BAT – [Ne II] | 0.77 0.08 | 7.08 3.69 |
| BAT – [Ne III] | 0.93 0.08 | 0.43 3.68 |
| BAT – [O IV] | 0.93 0.11 | 0.37 5.00 |
| BAT – [Ne V]14µm | 0.91 0.15 | 0.79 6.65 |
| [O IV] – [Ne II] | 0.84 0.10 | 6.21 3.91 |
| [O IV] – [Ne III] | 0.91 0.07 | 3.57 2.78 |
| [Ne III] – [Ne II] | 0.92 0.06 | 3.03 2.56 |
| [Ne V]14µm – [Ne II] | 0.74 0.09 | 10.65 3.76 |
| [Ne V]14µm – [Ne III] | 0.90 0.06 | 4.44 2.53 |
| [Ne V]14µm – [O IV] | 1.00 0.05 | 0.62 2.16 |
| [Ne V]24µm – [Ne V]14µm | 1.02 0.05 | -0.69 1.50 |
| Seyfert 2 Galaxies | ||
| BAT – [Ne II] | 0.94 0.15 | 0.15 6.56 |
| BAT – [Ne III] | 0.99 0.10 | -1.82 4.42 |
| BAT – [O IV] | 1.00 0.13 | -2.17 5.72 |
| BAT – [Ne V]14µm | 1.10 0.12 | -7.10 5.28 |
| [O IV] – [Ne II] | 0.98 0.10 | 0.48 3.89 |
| [O IV] – [Ne III] | 0.96 0.05 | 1.47 2.14 |
| [Ne III] – [Ne II] | 1.02 0.05 | -1.01 2.18 |
| [Ne V]14µm – [Ne II] | 0.89 0.09 | 4.78 3.62 |
| [Ne V]14µm – [Ne III] | 0.87 0.05 | 5.73 2.11 |
| [Ne V]14µm – [O IV] | 0.90 0.04 | 4.45 1.50 |
| [Ne V]24µm – [Ne V]14µm | 1.07 0.04 | -2.97 1.48 |
Note. — and represent the independent and dependent variables, respectively. a and b represent the regression coefficient (slope) and regression constant (intercept) respectively. For the relationship between the 14-195 keV and mid-infrared luminosities we used the ordinary least-square regression of the dependent variable, Y, against the independent variable X, OLS(). For the relationship between the mid-infrared emission line luminosities we used the OLS bisector method which treat the variables symmetrically (see Isobe et al., 1990, for a review). When censored data was present we used the EM and the Buckley-James (BJ) method, if censored data was present in both variables (e.g., the relationship) the Schmitt’s binned method was used (Isobe et al., 1986; Isobe & Feigelson, 1990). The results from the EM and BJ methods agree within their estimated errors, therefore, for the sake of simplicity, we present only the values from the EM regression.