2 University of Alberta, Department of Physics, Centre for Particle Physics, Edmonton, AB T6G 2G7, Canada
3 Ankara University(a), Faculty of Sciences, Department of Physics, TR 061000 Tandogan, Ankara; Dumlupinar University(b), Faculty of Arts and Sciences, Department of Physics, Kutahya; Gazi University(c), Faculty of Arts and Sciences, Department of Physics, 06500, Teknikokullar, Ankara; TOBB University of Economics and Technology(d), Faculty of Arts and Sciences, Division of Physics, 06560, Sogutozu, Ankara; Turkish Atomic Energy Authority(e), 06530, Lodumlu, Ankara, Turkey
4 LAPP, Université de Savoie, CNRS/IN2P3, Annecy-le-Vieux, France
5 Argonne National Laboratory, High Energy Physics Division, 9700 S. Cass Avenue, Argonne IL 60439, United States of America
6 University of Arizona, Department of Physics, Tucson, AZ 85721, United States of America
7 The University of Texas at Arlington, Department of Physics, Box 19059, Arlington, TX 76019, United States of America
8 University of Athens, Nuclear & Particle Physics, Department of Physics, Panepistimiopouli, Zografou, GR 15771 Athens, Greece
9 National Technical University of Athens, Physics Department, 9-Iroon Polytechniou, GR 15780 Zografou, Greece
10 Institute of Physics, Azerbaijan Academy of Sciences, H. Javid Avenue 33, AZ 143 Baku, Azerbaijan
11 Institut de Física d’Altes Energies, IFAE, Edifici Cn, Universitat Autònoma de Barcelona, ES - 08193 Bellaterra (Barcelona), Spain
12 University of Belgrade(a), Institute of Physics, P.O. Box 57, 11001 Belgrade; Vinca Institute of Nuclear Sciences(b), Mihajla Petrovica Alasa 12-14, 11001 Belgrade, Serbia
13 University of Bergen, Department for Physics and Technology, Allegaten 55, NO - 5007 Bergen, Norway
14 Lawrence Berkeley National Laboratory and University of California, Physics Division, MS50B-6227, 1 Cyclotron Road, Berkeley, CA 94720, United States of America
15 Humboldt University, Institute of Physics, Berlin, Newtonstr. 15, D-12489 Berlin, Germany
16 University of Bern, Albert Einstein Center for Fundamental Physics, Laboratory for High Energy Physics, Sidlerstrasse 5, CH - 3012 Bern, Switzerland
17 University of Birmingham, School of Physics and Astronomy, Edgbaston, Birmingham B15 2TT, United Kingdom
18 Bogazici University(a), Faculty of Sciences, Department of Physics, TR - 80815 Bebek-Istanbul; Dogus University(b), Faculty of Arts and Sciences, Department of Physics, 34722, Kadikoy, Istanbul; (c)Gaziantep University, Faculty of Engineering, Department of Physics Engineering, 27310, Sehitkamil, Gaziantep, Turkey; Istanbul Technical University(d), Faculty of Arts and Sciences, Department of Physics, 34469, Maslak, Istanbul, Turkey
19 INFN Sezione di Bologna(a); Università di Bologna, Dipartimento di Fisica(b), viale C. Berti Pichat, 6/2, IT - 40127 Bologna, Italy
20 University of Bonn, Physikalisches Institut, Nussallee 12, D - 53115 Bonn, Germany
21 Boston University, Department of Physics, 590 Commonwealth Avenue, Boston, MA 02215, United States of America
22 Brandeis University, Department of Physics, MS057, 415 South Street, Waltham, MA 02454, United States of America
23 Universidade Federal do Rio De Janeiro, COPPE/EE/IF (a), Caixa Postal 68528, Ilha do Fundao, BR - 21945-970 Rio de Janeiro; (b)Universidade de Sao Paulo, Instituto de Fisica, R.do Matao Trav. R.187, Sao Paulo - SP, 05508 - 900, Brazil
24 Brookhaven National Laboratory, Physics Department, Bldg. 510A, Upton, NY 11973, United States of America
25 National Institute of Physics and Nuclear Engineering(a), Bucharest-Magurele, Str. Atomistilor 407, P.O. Box MG-6, R-077125, Romania; University Politehnica Bucharest(b), Rectorat - AN 001, 313 Splaiul Independentei, sector 6, 060042 Bucuresti; West University(c) in Timisoara, Bd. Vasile Parvan 4, Timisoara, Romania
26 Universidad de Buenos Aires, FCEyN, Dto. Fisica, Pab I - C. Universitaria, 1428 Buenos Aires, Argentina
27 University of Cambridge, Cavendish Laboratory, J J Thomson Avenue, Cambridge CB3 0HE, United Kingdom
28 Carleton University, Department of Physics, 1125 Colonel By Drive, Ottawa ON K1S 5B6, Canada
29 CERN, CH - 1211 Geneva 23, Switzerland
30 University of Chicago, Enrico Fermi Institute, 5640 S. Ellis Avenue, Chicago, IL 60637, United States of America
31 Pontificia Universidad Católica de Chile, Facultad de Fisica, Departamento de Fisica(a), Avda. Vicuna Mackenna 4860, San Joaquin, Santiago; Universidad Técnica Federico Santa María, Departamento de Física(b), Avda. Espãna 1680, Casilla 110-V, Valparaíso, Chile
32 Institute of High Energy Physics, Chinese Academy of Sciences(a), P.O. Box 918, 19 Yuquan Road, Shijing Shan District, CN - Beijing 100049; University of Science & Technology of China (USTC), Department of Modern Physics(b), Hefei, CN - Anhui 230026; Nanjing University, Department of Physics(c), 22 Hankou Road, Nanjing, 210093; Shandong University, High Energy Physics Group(d), Jinan, CN - Shandong 250100, China
33 Laboratoire de Physique Corpusculaire, Clermont Université, Université Blaise Pascal, CNRS/IN2P3, FR - 63177 Aubiere Cedex, France
34 Columbia University, Nevis Laboratory, 136 So. Broadway, Irvington, NY 10533, United States of America
35 University of Copenhagen, Niels Bohr Institute, Blegdamsvej 17, DK - 2100 Kobenhavn 0, Denmark
36 INFN Gruppo Collegato di Cosenza(a); Università della Calabria, Dipartimento di Fisica(b), IT-87036 Arcavacata di Rende, Italy
37 Faculty of Physics and Applied Computer Science of the AGH-University of Science and Technology, (FPACS, AGH-UST), al. Mickiewicza 30, PL-30059 Cracow, Poland
38 The Henryk Niewodniczanski Institute of Nuclear Physics, Polish Academy of Sciences, ul. Radzikowskiego 152, PL - 31342 Krakow, Poland
39 Southern Methodist University, Physics Department, 106 Fondren Science Building, Dallas, TX 75275-0175, United States of America
40 University of Texas at Dallas, 800 West Campbell Road, Richardson, TX 75080-3021, United States of America
41 DESY, Notkestr. 85, D-22603 Hamburg and Platanenallee 6, D-15738 Zeuthen, Germany
42 TU Dortmund, Experimentelle Physik IV, DE - 44221 Dortmund, Germany
43 Technical University Dresden, Institut für Kern- und Teilchenphysik, Zellescher Weg 19, D-01069 Dresden, Germany
44 Duke University, Department of Physics, Durham, NC 27708, United States of America
45 University of Edinburgh, School of Physics & Astronomy, James Clerk Maxwell Building, The Kings Buildings, Mayfield Road, Edinburgh EH9 3JZ, United Kingdom
46 Fachhochschule Wiener Neustadt; Johannes Gutenbergstrasse 3 AT - 2700 Wiener Neustadt, Austria
47 INFN Laboratori Nazionali di Frascati, via Enrico Fermi 40, IT-00044 Frascati, Italy
48 Albert-Ludwigs-Universität, Fakultät für Mathematik und Physik, Hermann-Herder Str. 3, D - 79104 Freiburg i.Br., Germany
49 Université de Genève, Section de Physique, 24 rue Ernest Ansermet, CH - 1211 Geneve 4, Switzerland
50 INFN Sezione di Genova(a); Università di Genova, Dipartimento di Fisica(b), via Dodecaneso 33, IT - 16146 Genova, Italy
51 Institute of Physics of the Georgian Academy of Sciences, 6 Tamarashvili St., GE - 380077 Tbilisi; Tbilisi State University, HEP Institute, University St. 9, GE - 380086 Tbilisi, Georgia
52 Justus-Liebig-Universität Giessen, II Physikalisches Institut, Heinrich-Buff Ring 16, D-35392 Giessen, Germany
53 University of Glasgow, Department of Physics and Astronomy, Glasgow G12 8QQ, United Kingdom
54 Georg-August-Universität, II. Physikalisches Institut, Friedrich-Hund Platz 1, D-37077 Göttingen, Germany
55 Laboratoire de Physique Subatomique et de Cosmologie, CNRS/IN2P3, Université Joseph Fourier, INPG, 53 avenue des Martyrs, FR - 38026 Grenoble Cedex, France
56 Hampton University, Department of Physics, Hampton, VA 23668, United States of America
57 Harvard University, Laboratory for Particle Physics and Cosmology, 18 Hammond Street, Cambridge, MA 02138, United States of America
58 Ruprecht-Karls-Universität Heidelberg: Kirchhoff-Institut für Physik(a), Im Neuenheimer Feld 227, D-69120 Heidelberg; Physikalisches Institut(b), Philosophenweg 12, D-69120 Heidelberg; ZITI Ruprecht-Karls-University Heidelberg(c), Lehrstuhl für Informatik V, B6, 23-29, DE - 68131 Mannheim, Germany
59 Hiroshima University, Faculty of Science, 1-3-1 Kagamiyama, Higashihiroshima-shi, JP - Hiroshima 739-8526, Japan
60 Hiroshima Institute of Technology, Faculty of Applied Information Science, 2-1-1 Miyake Saeki-ku, Hiroshima-shi, JP - Hiroshima 731-5193, Japan
61 Indiana University, Department of Physics, Swain Hall West 117, Bloomington, IN 47405-7105, United States of America
62 Institut für Astro- und Teilchenphysik, Technikerstrasse 25, A - 6020 Innsbruck, Austria
63 University of Iowa, 203 Van Allen Hall, Iowa City, IA 52242-1479, United States of America
64 Iowa State University, Department of Physics and Astronomy, Ames High Energy Physics Group, Ames, IA 50011-3160, United States of America
65 Joint Institute for Nuclear Research, JINR Dubna, RU - 141 980 Moscow Region, Russia
66 KEK, High Energy Accelerator Research Organization, 1-1 Oho, Tsukuba-shi, Ibaraki-ken 305-0801, Japan
67 Kobe University, Graduate School of Science, 1-1 Rokkodai-cho, Nada-ku, JP Kobe 657-8501, Japan
68 Kyoto University, Faculty of Science, Oiwake-cho, Kitashirakawa, Sakyou-ku, Kyoto-shi, JP - Kyoto 606-8502, Japan
69 Kyoto University of Education, 1 Fukakusa, Fujimori, fushimi-ku, Kyoto-shi, JP - Kyoto 612-8522, Japan
70 Universidad Nacional de La Plata, FCE, Departamento de Física, IFLP (CONICET-UNLP), C.C. 67, 1900 La Plata, Argentina
71 Lancaster University, Physics Department, Lancaster LA1 4YB, United Kingdom
72 INFN Sezione di Lecce(a); Università del Salento, Dipartimento di Fisica(b)Via Arnesano IT - 73100 Lecce, Italy
73 University of Liverpool, Oliver Lodge Laboratory, P.O. Box 147, Oxford Street, Liverpool L69 3BX, United Kingdom
74 Jožef Stefan Institute and University of Ljubljana, Department of Physics, SI-1000 Ljubljana, Slovenia
75 Queen Mary University of London, Department of Physics, Mile End Road, London E1 4NS, United Kingdom
76 Royal Holloway, University of London, Department of Physics, Egham Hill, Egham, Surrey TW20 0EX, United Kingdom
77 University College London, Department of Physics and Astronomy, Gower Street, London WC1E 6BT, United Kingdom
78 Laboratoire de Physique Nucléaire et de Hautes Energies, Université Pierre et Marie Curie (Paris 6), Université Denis Diderot (Paris-7), CNRS/IN2P3, Tour 33, 4 place Jussieu, FR - 75252 Paris Cedex 05, France
79 Lunds universitet, Naturvetenskapliga fakulteten, Fysiska institutionen, Box 118, SE - 221 00 Lund, Sweden
80 Universidad Autonoma de Madrid, Facultad de Ciencias, Departamento de Fisica Teorica, ES - 28049 Madrid, Spain
81 Universität Mainz, Institut für Physik, Staudinger Weg 7, DE - 55099 Mainz, Germany
82 University of Manchester, School of Physics and Astronomy, Manchester M13 9PL, United Kingdom
83 CPPM, Aix-Marseille Université, CNRS/IN2P3, Marseille, France
84 University of Massachusetts, Department of Physics, 710 North Pleasant Street, Amherst, MA 01003, United States of America
85 McGill University, High Energy Physics Group, 3600 University Street, Montreal, Quebec H3A 2T8, Canada
86 University of Melbourne, School of Physics, AU - Parkville, Victoria 3010, Australia
87 The University of Michigan, Department of Physics, 2477 Randall Laboratory, 500 East University, Ann Arbor, MI 48109-1120, United States of America
88 Michigan State University, Department of Physics and Astronomy, High Energy Physics Group, East Lansing, MI 48824-2320, United States of America
89 INFN Sezione di Milano(a); Università di Milano, Dipartimento di Fisica(b), via Celoria 16, IT - 20133 Milano, Italy
90 B.I. Stepanov Institute of Physics, National Academy of Sciences of Belarus, Independence Avenue 68, Minsk 220072, Republic of Belarus
91 National Scientific & Educational Centre for Particle & High Energy Physics, NC PHEP BSU, M. Bogdanovich St. 153, Minsk 220040, Republic of Belarus
92 Massachusetts Institute of Technology, Department of Physics, Room 24-516, Cambridge, MA 02139, United States of America
93 University of Montreal, Group of Particle Physics, C.P. 6128, Succursale Centre-Ville, Montreal, Quebec, H3C 3J7 , Canada
94 P.N. Lebedev Institute of Physics, Academy of Sciences, Leninsky pr. 53, RU - 117 924 Moscow, Russia
95 Institute for Theoretical and Experimental Physics (ITEP), B. Cheremushkinskaya ul. 25, RU 117 218 Moscow, Russia
96 Moscow Engineering & Physics Institute (MEPhI), Kashirskoe Shosse 31, RU - 115409 Moscow, Russia
97 Lomonosov Moscow State University Skobeltsyn Institute of Nuclear Physics (MSU SINP), 1(2), Leninskie gory, GSP-1, Moscow 119991 Russian Federation, Russia
98 Ludwig-Maximilians-Universität München, Fakultät für Physik, Am Coulombwall 1, DE - 85748 Garching, Germany
99 Max-Planck-Institut für Physik, (Werner-Heisenberg-Institut), Föhringer Ring 6, 80805 München, Germany
100 Nagasaki Institute of Applied Science, 536 Aba-machi, JP Nagasaki 851-0193, Japan
101 Nagoya University, Graduate School of Science, Furo-Cho, Chikusa-ku, Nagoya, 464-8602, Japan
102 INFN Sezione di Napoli(a); Università di Napoli, Dipartimento di Scienze Fisiche(b), Complesso Universitario di Monte Sant’Angelo, via Cinthia, IT - 80126 Napoli, Italy
103 University of New Mexico, Department of Physics and Astronomy, MSC07 4220, Albuquerque, NM 87131 USA, United States of America
104 Radboud University Nijmegen/NIKHEF, Department of Experimental High Energy Physics, Heyendaalseweg 135, NL-6525 AJ, Nijmegen, Netherlands
105 Nikhef National Institute for Subatomic Physics, and University of Amsterdam, Science Park 105, 1098 XG Amsterdam, Netherlands
106 Department of Physics, Northern Illinois University, LaTourette Hall Normal Road, DeKalb, IL 60115, United States of America
107 Budker Institute of Nuclear Physics (BINP), RU - Novosibirsk 630 090, Russia
108 New York University, Department of Physics, 4 Washington Place, New York NY 10003, USA, United States of America
109 Ohio State University, 191 West Woodruff Ave, Columbus, OH 43210-1117, United States of America
110 Okayama University, Faculty of Science, Tsushimanaka 3-1-1, Okayama 700-8530, Japan
111 University of Oklahoma, Homer L. Dodge Department of Physics and Astronomy, 440 West Brooks, Room 100, Norman, OK 73019-0225, United States of America
112 Oklahoma State University, Department of Physics, 145 Physical Sciences Building, Stillwater, OK 74078-3072, United States of America
113 Palacký University, 17.listopadu 50a, 772 07 Olomouc, Czech Republic
114 University of Oregon, Center for High Energy Physics, Eugene, OR 97403-1274, United States of America
115 LAL, Univ. Paris-Sud, IN2P3/CNRS, Orsay, France
116 Osaka University, Graduate School of Science, Machikaneyama-machi 1-1, Toyonaka, Osaka 560-0043, Japan
117 University of Oslo, Department of Physics, P.O. Box 1048, Blindern, NO - 0316 Oslo 3, Norway
118 Oxford University, Department of Physics, Denys Wilkinson Building, Keble Road, Oxford OX1 3RH, United Kingdom
119 INFN Sezione di Pavia(a); Università di Pavia, Dipartimento di Fisica Nucleare e Teorica(b), Via Bassi 6, IT-27100 Pavia, Italy
120 University of Pennsylvania, Department of Physics, High Energy Physics Group, 209 S. 33rd Street, Philadelphia, PA 19104, United States of America
121 Petersburg Nuclear Physics Institute, RU - 188 300 Gatchina, Russia
122 INFN Sezione di Pisa(a); Università di Pisa, Dipartimento di Fisica E. Fermi(b), Largo B. Pontecorvo 3, IT - 56127 Pisa, Italy
123 University of Pittsburgh, Department of Physics and Astronomy, 3941 O’Hara Street, Pittsburgh, PA 15260, United States of America
124 Laboratorio de Instrumentacao e Fisica Experimental de Particulas - LIP(a), Avenida Elias Garcia 14-1, PT - 1000-149 Lisboa, Portugal; Universidad de Granada, Departamento de Fisica Teorica y del Cosmos and CAFPE(b), E-18071 Granada, Spain
125 Institute of Physics, Academy of Sciences of the Czech Republic, Na Slovance 2, CZ - 18221 Praha 8, Czech Republic
126 Charles University in Prague, Faculty of Mathematics and Physics, Institute of Particle and Nuclear Physics, V Holesovickach 2, CZ - 18000 Praha 8, Czech Republic
127 Czech Technical University in Prague, Zikova 4, CZ - 166 35 Praha 6, Czech Republic
128 State Research Center Institute for High Energy Physics, Moscow Region, 142281, Protvino, Pobeda street, 1, Russia
129 Rutherford Appleton Laboratory, Science and Technology Facilities Council, Harwell Science and Innovation Campus, Didcot OX11 0QX, United Kingdom
130 University of Regina, Physics Department, Canada
131 Ritsumeikan University, Noji Higashi 1 chome 1-1, JP - Kusatsu, Shiga 525-8577, Japan
132 INFN Sezione di Roma I(a); Università La Sapienza, Dipartimento di Fisica(b), Piazzale A. Moro 2, IT- 00185 Roma, Italy
133 INFN Sezione di Roma Tor Vergata(a); Università di Roma Tor Vergata, Dipartimento di Fisica(b) , via della Ricerca Scientifica, IT-00133 Roma, Italy
134 INFN Sezione di Roma Tre(a); Università Roma Tre, Dipartimento di Fisica(b), via della Vasca Navale 84, IT-00146 Roma, Italy
135 Réseau Universitaire de Physique des Hautes Energies (RUPHE): Université Hassan II, Faculté des Sciences Ain Chock(a), B.P. 5366, MA - Casablanca; Centre National de l’Energie des Sciences Techniques Nucleaires (CNESTEN)(b), B.P. 1382 R.P. 10001 Rabat 10001; Université Mohamed Premier(c), LPTPM, Faculté des Sciences, B.P.717. Bd. Mohamed VI, 60000, Oujda ; Université Mohammed V, Faculté des Sciences(d)4 Avenue Ibn Battouta, BP 1014 RP, 10000 Rabat, Morocco
136 CEA, DSM/IRFU, Centre d’Etudes de Saclay, FR - 91191 Gif-sur-Yvette, France
137 University of California Santa Cruz, Santa Cruz Institute for Particle Physics (SCIPP), Santa Cruz, CA 95064, United States of America
138 University of Washington, Seattle, Department of Physics, Box 351560, Seattle, WA 98195-1560, United States of America
139 University of Sheffield, Department of Physics & Astronomy, Hounsfield Road, Sheffield S3 7RH, United Kingdom
140 Shinshu University, Department of Physics, Faculty of Science, 3-1-1 Asahi, Matsumoto-shi, JP - Nagano 390-8621, Japan
141 Universität Siegen, Fachbereich Physik, D 57068 Siegen, Germany
142 Simon Fraser University, Department of Physics, 8888 University Drive, CA - Burnaby, BC V5A 1S6, Canada
143 SLAC National Accelerator Laboratory, Stanford, California 94309, United States of America
144 Comenius University, Faculty of Mathematics, Physics & Informatics(a), Mlynska dolina F2, SK - 84248 Bratislava; Institute of Experimental Physics of the Slovak Academy of Sciences, Dept. of Subnuclear Physics(b), Watsonova 47, SK - 04353 Kosice, Slovak Republic
145 Stockholm University: Department of Physics(a); The Oskar Klein Centre(b), AlbaNova, SE - 106 91 Stockholm, Sweden
146 Royal Institute of Technology (KTH), Physics Department, SE - 106 91 Stockholm, Sweden
147 Stony Brook University, Department of Physics and Astronomy, Nicolls Road, Stony Brook, NY 11794-3800, United States of America
148 University of Sussex, Department of Physics and Astronomy Pevensey 2 Building, Falmer, Brighton BN1 9QH, United Kingdom
149 University of Sydney, School of Physics, AU - Sydney NSW 2006, Australia
150 Insitute of Physics, Academia Sinica, TW - Taipei 11529, Taiwan
151 Technion, Israel Inst. of Technology, Department of Physics, Technion City, IL - Haifa 32000, Israel
152 Tel Aviv University, Raymond and Beverly Sackler School of Physics and Astronomy, Ramat Aviv, IL - Tel Aviv 69978, Israel
153 Aristotle University of Thessaloniki, Faculty of Science, Department of Physics, Division of Nuclear & Particle Physics, University Campus, GR - 54124, Thessaloniki, Greece
154 The University of Tokyo, International Center for Elementary Particle Physics and Department of Physics, 7-3-1 Hongo, Bunkyo-ku, JP - Tokyo 113-0033, Japan
155 Tokyo Metropolitan University, Graduate School of Science and Technology, 1-1 Minami-Osawa, Hachioji, Tokyo 192-0397, Japan
156 Tokyo Institute of Technology, 2-12-1-H-34 O-Okayama, Meguro, Tokyo 152-8551, Japan
157 University of Toronto, Department of Physics, 60 Saint George Street, Toronto M5S 1A7, Ontario, Canada
158 TRIUMF(a), 4004 Wesbrook Mall, Vancouver, B.C. V6T 2A3; (b)York University, Department of Physics and Astronomy, 4700 Keele St., Toronto, Ontario, M3J 1P3, Canada
159 University of Tsukuba, Institute of Pure and Applied Sciences, 1-1-1 Tennoudai, Tsukuba-shi, JP - Ibaraki 305-8571, Japan
160 Tufts University, Science & Technology Center, 4 Colby Street, Medford, MA 02155, United States of America
161 Universidad Antonio Narino, Centro de Investigaciones, Cra 3 Este No.47A-15, Bogota, Colombia
162 University of California, Irvine, Department of Physics & Astronomy, CA 92697-4575, United States of America
163 INFN Gruppo Collegato di Udine(a); ICTP(b), Strada Costiera 11, IT-34014, Trieste; Università di Udine, Dipartimento di Fisica(c), via delle Scienze 208, IT - 33100 Udine, Italy
164 University of Illinois, Department of Physics, 1110 West Green Street, Urbana, Illinois 61801, United States of America
165 University of Uppsala, Department of Physics and Astronomy, P.O. Box 516, SE -751 20 Uppsala, Sweden
166 Instituto de Física Corpuscular (IFIC) Centro Mixto UVEG-CSIC, Apdo. 22085 ES-46071 Valencia, Dept. Física At. Mol. y Nuclear; Univ. of Valencia, and Instituto de Microelectrónica de Barcelona (IMB-CNM-CSIC) 08193 Bellaterra Barcelona, Spain
167 University of British Columbia, Department of Physics, 6224 Agricultural Road, CA - Vancouver, B.C. V6T 1Z1, Canada
168 University of Victoria, Department of Physics and Astronomy, P.O. Box 3055, Victoria B.C., V8W 3P6, Canada
169 Waseda University, WISE, 3-4-1 Okubo, Shinjuku-ku, Tokyo, 169-8555, Japan
170 The Weizmann Institute of Science, Department of Particle Physics, P.O. Box 26, IL - 76100 Rehovot, Israel
171 University of Wisconsin, Department of Physics, 1150 University Avenue, WI 53706 Madison, Wisconsin, United States of America
172 Julius-Maximilians-University of Würzburg, Physikalisches Institute, Am Hubland, 97074 Würzburg, Germany
173 Bergische Universität, Fachbereich C, Physik, Postfach 100127, Gauss-Strasse 20, D- 42097 Wuppertal, Germany
174 Yale University, Department of Physics, PO Box 208121, New Haven CT, 06520-8121, United States of America
175 Yerevan Physics Institute, Alikhanian Brothers Street 2, AM - 375036 Yerevan, Armenia
176 ATLAS-Canada Tier-1 Data Centre, TRIUMF, 4004 Wesbrook Mall, Vancouver, BC, V6T 2A3, Canada
177 GridKA Tier-1 FZK, Forschungszentrum Karlsruhe GmbH, Steinbuch Centre for Computing (SCC), Hermann-von-Helmholtz-Platz 1, 76344 Eggenstein-Leopoldshafen, Germany
178 Port d’Informacio Cientifica (PIC), Universitat Autonoma de Barcelona (UAB), Edifici D, E-08193 Bellaterra, Spain
179 Centre de Calcul CNRS/IN2P3, Domaine scientifique de la Doua, 27 bd du 11 Novembre 1918, 69622 Villeurbanne Cedex, France
180 INFN-CNAF, Viale Berti Pichat 6/2, 40127 Bologna, Italy
181 Nordic Data Grid Facility, NORDUnet A/S, Kastruplundgade 22, 1, DK-2770 Kastrup, Denmark
182 SARA Reken- en Netwerkdiensten, Science Park 121, 1098 XG Amsterdam, Netherlands
183 Academia Sinica Grid Computing, Institute of Physics, Academia Sinica, No.128, Sec. 2, Academia Rd., Nankang, Taipei, Taiwan 11529, Taiwan
184 UK-T1-RAL Tier-1, Rutherford Appleton Laboratory, Science and Technology Facilities Council, Harwell Science and Innovation Campus, Didcot OX11 0QX, United Kingdom
185 RHIC and ATLAS Computing Facility, Physics Department, Building 510, Brookhaven National Laboratory, Upton, New York 11973, United States of America
a Also at CPPM, Marseille, France.
b Also at TRIUMF, Vancouver, Canada
c Also at FPACS, AGH-UST, Cracow, Poland
d Also at TRIUMF, Vancouver, Canada
e Now at CERN
f Also at Università di Napoli Parthenope, Napoli, Italy
g Also at Institute of Particle Physics (IPP), Canada
h Also at Università di Napoli Parthenope, via A. Acton 38, IT - 80133 Napoli, Italy
i Louisiana Tech University, 305 Wisteria Street, P.O. Box 3178, Ruston, LA 71272, United States of America
j At California State University, Fresno, USA
k Also at TRIUMF, 4004 Wesbrook Mall, Vancouver, B.C. V6T 2A3, Canada
l Currently at Istituto Universitario di Studi Superiori IUSS, Pavia, Italy
m Also at FPACS, AGH-UST, Cracow, Poland
n Also at California Institute of Technology, Pasadena, USA
o Louisiana Tech University, Ruston, USA
p Also at University of Montreal, Montreal, Canada
q Also at Institut für Experimentalphysik, Universität Hamburg, Hamburg, Germany
r Also at Petersburg Nuclear Physics Institute, Gatchina, Russia
s Also at Institut für Experimentalphysik, Universität Hamburg, Luruper Chaussee 149, 22761 Hamburg, Germany
t Also at School of Physics and Engineering, Sun Yat-sen University, China
u Also at School of Physics, Shandong University, Jinan, China
v Also at California Institute of Technology, Pasadena, USA
w Also at Rutherford Appleton Laboratory, Didcot, UK
x Also at school of physics, Shandong University, Jinan
y Also at Rutherford Appleton Laboratory, Didcot , UK
z Now at KEK
aa University of South Carolina, Columbia, USA
ab Also at KFKI Research Institute for Particle and Nuclear Physics, Budapest, Hungary
ac University of South Carolina, Dept. of Physics and Astronomy, 700 S. Main St, Columbia, SC 29208, United States of America
ad Also at Institute of Physics, Jagiellonian University, Cracow, Poland
ae Louisiana Tech University, Ruston, USA
af Also at School of Physics and Engineering, Sun Yat-sen University, Taiwan
ag University of South Carolina, Columbia, USA
ah Transfer to LHCb 31.01.2010
ai Also at Nanjing University, China
∗ Deceased
The ATLAS Inner Detector commissioning and calibration
Abstract
The ATLAS Inner Detector is a composite tracking system consisting of silicon pixels, silicon strips and straw tubes in a 2 T magnetic field. Its installation was completed in August 2008 and the detector took part in data-taking with single LHC beams and cosmic rays. The initial detector operation, hardware commissioning and in-situ calibrations are described. Tracking performance has been measured with 7.6 million cosmic-ray events, collected using a tracking trigger and reconstructed with modular pattern-recognition and fitting software. The intrinsic hit efficiency and tracking trigger efficiencies are close to 100%. Lorentz angle measurements for both electrons and holes, specific energy-loss calibration and transition radiation turn-on measurements have been performed. Different alignment techniques have been used to reconstruct the detector geometry. After the initial alignment, a transverse impact parameter resolution of m and a relative momentum resolution have been measured for high momentum tracks.
1 Introduction
The ATLAS detector bib:ATLASDetectorPaper is one of two large general-purpose detectors designed to probe new physics at the unprecedented energies and luminosities available at the Large Hadron Collider at CERN bib:LHCPaper . ATLAS is divided into three major regions: a large toroidal-field high-precision muon spectrometer surrounding a set of high-granularity calorimeters which, in turn, surround an optimized, multi-technology tracker situated in a 2 T magnetic field provided by a solenoid.
This central tracking detector is referred to as the Inner Detector (ID). This paper describes the commissioning and calibration of the Inner Detector from its final installation in August of 2008 through cosmic-ray data-taking until the end of the year. In this period the full tracking system operated for the first time. The aim of this commissioning phase was to prepare the detector for LHC collisions which took place in 2009. The necessary steps were:
-
•
to operate all the services and controls,
-
•
to perform an in-situ calibration of the detector,
-
•
to synchronise all sub-detectors,
-
•
to measure efficiency and noise occupancy for each sub-detector in combined operation,
-
•
to test the reconstruction software and the tracking triggers on real data,
-
•
to perform an initial alignment of the detector.
A significant component of the commissioning involved setting up the hardware and software infrastructure needed to operate the detector. This included the calibration procedures, which will be repeated regularly during proton-proton data-taking periods. The most relevant aspects are therefore described here.
Cosmic-ray events were used to perform a preliminary alignment and to commission the track reconstruction. They mostly consist of a single muon traversing the whole detector, and have a hard momentum spectrum. Their kinematics makes them particularly suitable for some specific measurements, for example intrinsic detector efficiency, track resolution and study of detector response to ionisation as a function of momentum and incident angle.
The layout of the paper is as follows. The main components of the ID are briefly described in Section 2. The operating modes and conditions during the different data-taking periods, the reconstruction software and the tracking triggers are described in Section 3.1. The synchronisation of the sub-detectors is presented in Section 4 and the calibration procedures and results in Section 5. Section 6 describes the alignment, while Section 7 presents measurements of the detector performance: intrinsic efficiency, the Lorentz angle in silicon for both electrons and holes, resolution of tracking parameters, the specific energy loss for particle identification at low momentum and the observation of transition radiation turn-on.
In the following, the ATLAS coordinate system will be used. The nominal interaction point is defined as the origin of a right-handed coordinate system. The beam direction defines the -axis and the - plane is transverse to it. The positive -axis is defined as pointing from the interaction point to the centre of the LHC ring and the positive -axis points upwards. Cylindrical coordinates and are often used in the transverse plane. The pseudorapidity is defined in terms of the polar angle : .
Tracks are described using the parameters of a helical trajectory at the point of closest approach to the -axis: the transverse impact parameter, , the coordinate, , the angles of the momentum direction, and , and the inverse of the particle momentum multiplied by the charge, .
2 The ATLAS Inner Detector
The layout of the Inner Detector is shown in Fig. 1. The acceptance in pseudorapidity is for particles coming from the LHC beam-interaction region, with full coverage in . The detector has been designed to provide a transverse momentum resolution, in the plane perpendicular to the beam axis, of and a transverse impact parameter resolution of 10 m for high momentum particles in the central region bib:ATLASDetectorPaper . The Inner Detector comprises three complementary sub-detectors: the Pixel Detector, the SemiConductor Tracker and the Transition Radiation Tracker. Relevant features are described briefly below; full details can be found in bib:ATLASDetectorPaper .
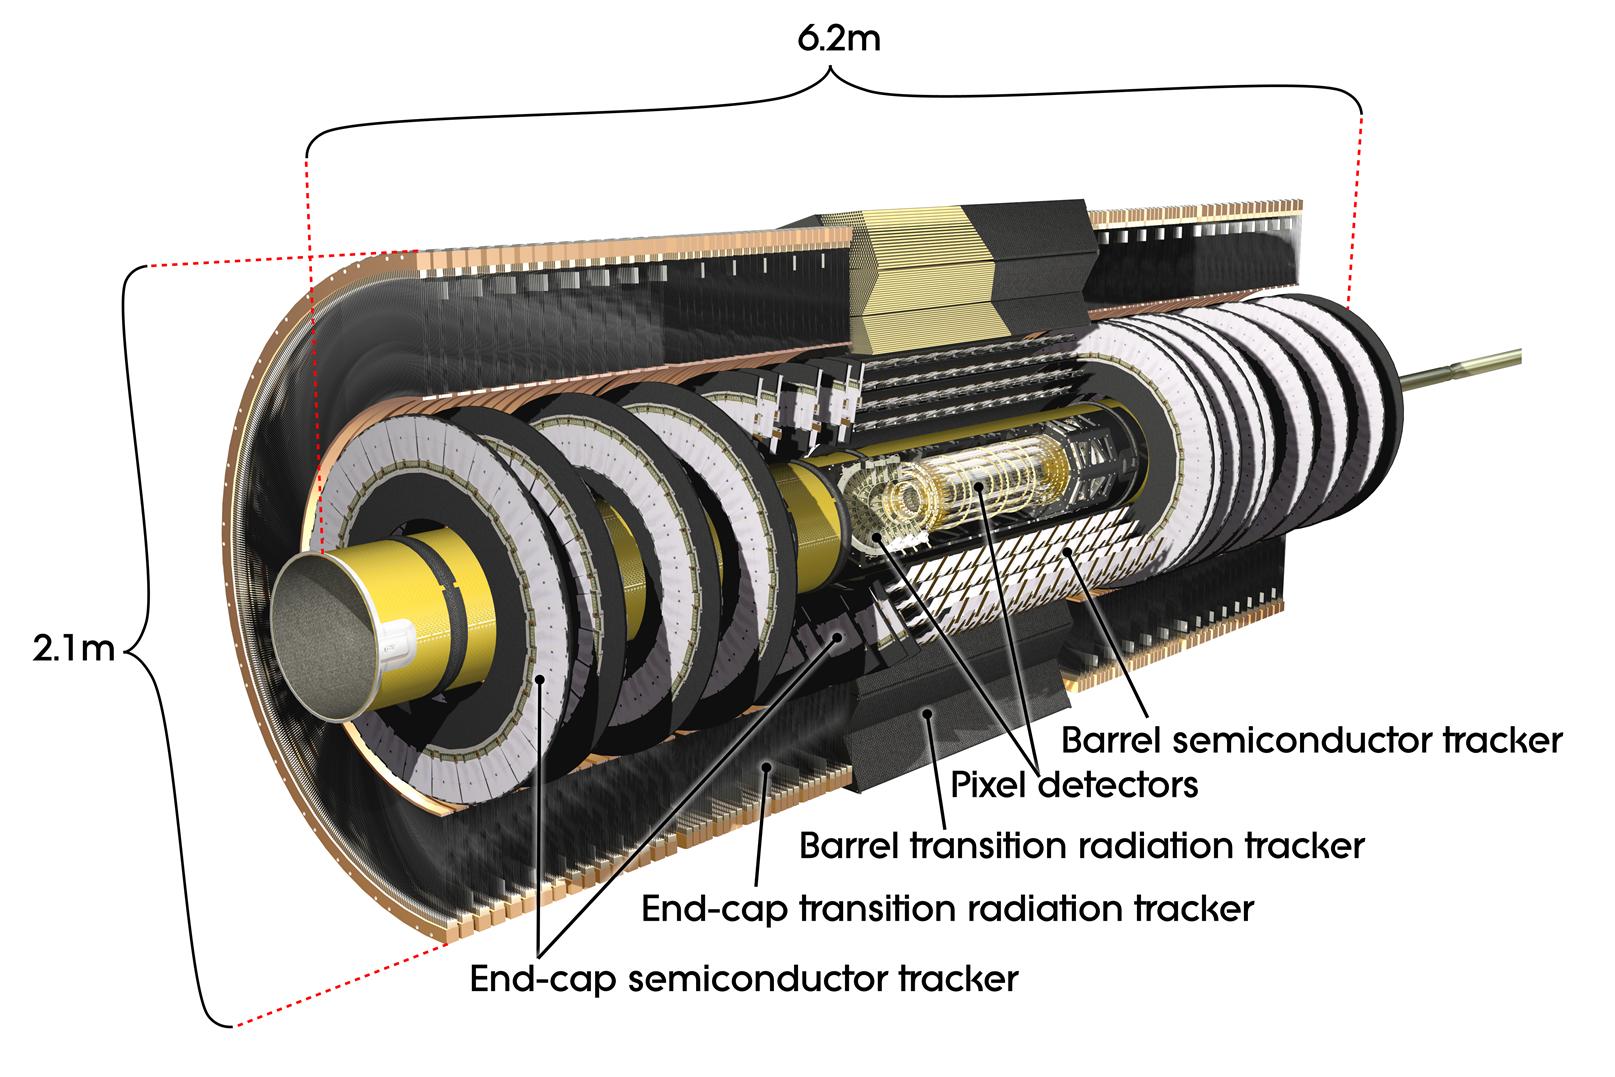
The Pixel Detector sensitive elements cover radial distances between 50.5 mm and 150 mm. The detector consists of 1744 silicon pixel modules bib:PixelDetectorPaper arranged in three concentric barrel layers and two endcaps of three disks each. It provides typically three measurement points for particles originating in the beam-interaction region. Each module covers an active area of 16.4 mm60.8 mm and contains 47 232 pixels, most of size 50 m 400 m. The direction of the shorter pitch defines the local -coordinate on the module and corresponds to the high-precision position measurement in the plane. The longer pitch, corresponding to the local -coordinate, is oriented approximately along the direction in the barrel and along in the endcaps. A module is read out by 16 radiation-hard front-end chips bib:FEI3chip bump-bonded to the sensor; the total number of readout channels is 80.4 million. Hits in a pixel are read out if the signal exceeds a tunable threshold. The pulse height is measured using the Time-over-Threshold (ToT) technique.
The SemiConductor Tracker (SCT) sensitive elements span radial distances from 299 mm to 560 mm. The detector consists of 4088 modules of silicon-strip detectors arranged in four concentric barrels and two endcaps of nine disks each. It provides typically eight strip measurements (four space-points) for particles originating in the beam-interaction region. The strips in the barrel are approximately parallel to the solenoid field and beam axis, and have a constant pitch of 80 m, while in the endcaps the strip direction is radial and of variable pitch. Most modules bib:SCTBarrelModules ; bib:SCTEndcapModules consist of four silicon-strip sensors bib:SCTsensors ; two sensors on each side are daisy-chained together to give 768 strips of approximately 12 cm in length. A second pair of identical sensors is glued back-to-back with the first pair at a stereo angle of 40 mrad to provide space points. The strips are read out by radiation-hard front-end readout chips bib:SCTABCD3TA , each chip reading out 128 channels; the total number of readout channels is 6.3 million. The hit information is binary: a hit is registered if the pulse height in a channel exceeds a preset threshold, normally corresponding to a charge of 1 fC.
Measurements in the silicon detectors often perform a selection on the angle of a track incident on a module. The angle between a track and the normal to the plane of a sensor is called . The angle between a track and the normal to the sensor in the plane defined by the normal to the sensor and the local -axis (i.e. the axis in the plane of the sensor corresponding to the high-precision measurement in the Pixel Detector or perpendicular to the strip direction in the SCT) is termed .
The Transition Radiation Tracker (TRT) sensitive volume covers radial distances from 563 mm to 1066 mm. The detector consists of 298 304 proportional drift tubes (straws), 4 mm in diameter, read out by 350 848 channels of electronics. The straws in the barrel region are arranged in three cylindrical layers and 32 sectors; they have split anodes and are read out from each side bib:TRTBarrel . The straws in the endcap regions are radially oriented and arranged in 80 wheel-like modular structures bib:TRTEndcap . The TRT straw layout is designed so that charged particles with transverse momentum and with pseudorapidity cross typically more than 30 straws. The TRT provides electron identification via transition radiation from polypropylene fibres (barrel) or foils (endcaps) interleaved between the straws. The much higher energy of the transition radiation photons ( keV compared with the few hundred eV deposited by an ionising particle in the Xe, CO2, O2 gas) is detected by a second, high-threshold, discriminator in the radiation-hard front-end electronics bib:TRTElectronics .
The Beam Conditions Monitor (BCM) bib:BCMPaper is designed to monitor the rate of background particles and to protect the silicon trackers from instantaneous high radiation doses caused by LHC beam incidents. The BCM consists of two stations, forward and backward, each with four modules located at a radius of 5.5 cm and at a distance of m from the interaction point. Each module has two pCVD diamond sensors of surface area and 500 m thickness mounted back-to-back. The 1 ns signal rise-time allows the discrimination of particle hits due to collisions (in-time) from background (out-of-time). The BCM signal provides both trigger information and an instantaneous hit-rate used as input to a beam-abort signal.
Readout systems. The Pixel and SCT detectors’ readout systems use optical transmission for the outgoing module data and the incoming timing, trigger and control data. The transmission is based on VCSELs operating at a wavelength of 850 nm and radiation-hard fibresbib:SCTOpticalLinks ; bib:PixelOpticalLinks . For each SCT module, there are two optical links operating at 40 Mbits/s for the data readout. Redundancy is implemented to allow for the loss of one optical link, without significant loss of data. For the cosmic-ray data-taking, the Pixel Detector links also operated at 40 MBits/s. The TRT uses shielded twisted-pair lines to transfer data to a patch panel inside the muon spectrometer, where up to 31 lines are multiplexed bib:GOL into one 1.6 Gbits/s optical link.
The off-detector readout electronics is based on custom-made Read-Out Driver (ROD) modules bib:SirOD ; bib:TRTROD . The RODs gather the data belonging to a single trigger into one packet (and in the case of the TRT perform data compression) and transmit the data to the ATLAS readout system using optical links operating at 1.6 Gbits/sbib:GOL . The RODs also perform monitoring and calibration tasksbib:SCTDAQ .
Cooling. The silicon detectors are cooled with a bi-phase evaporative system bib:CoolingPaper which is designed to deliver C3F8 fluid at ∘C in the low-mass cooling structures on the detector. The target temperature for the silicon sensors after irradiation is 0 ∘C for the Pixel Detector and ∘C for the SCT; these values were chosen to mitigate the effects of radiation damage. In the commissioning phase in 2008 both detectors limited the coolant temperature to ∘C in the circuits cooling their sensors. The resulting sensor temperatures were in the range ∘C to ∘C, depending on layer and module type. In 2009 the coolant temperature was reduced. Sensor temperatures were in the range ∘C to ∘C for the Pixel Detector and ∘C to ∘C for the SCT.
In contrast to the silicon detectors, the TRT operates at room temperature. The electronics is cooled by a monophase-liquid cooling loop separate from the Pixel and SCT bi-phase system.
3 Data samples and operation conditions
3.1 Data-taking periods
In 2008 the Inner Detector participated in three main data-taking periods:
-
•
Single-beam LHC running. Particularly relevant were the so called beam-splash events, where the LHC beams were directed into the tertiary collimators located 150 m from the interaction point, in order to provide secondary particles crossing the whole cross-section of the ATLAS detector. Since the incident particles had a direction almost parallel to the beam axis, they crossed many detector elements and were used for synchronization of the individual TRT readout units (see Section 4). For reasons of detector safety, during this period the Pixel Detector and SCT barrel were switched off and the SCT endcaps were operated at a reduced bias voltage of 20 V instead of 150 V, with the readout threshold increased to 1.2 fC to reduce the data volume.
-
•
Combined ATLAS cosmic-ray run. Data were taken by the full ATLAS detector with different magnetic field combinations: toroid and solenoid switched on and off independently.
-
•
Standalone ID cosmic-ray run. Only the Inner Detector took part in this run, which used a newly introduced Level-1 tracking trigger (see Section 3.4). All data taken during this period were with the solenoid off.
Cosmic rays come predominantly from the vertical direction. They were therefore particularly useful for studying the barrel region of the detector, where they resemble particles from collisions.
In the time between the combined and standalone cosmic-ray data-taking periods, a complete tuning and calibration of the detectors was performed as detailed in Section 5.
A summary of the numbers of reconstructed tracks in the 2008 cosmic-ray data-taking periods is shown in Table 1. Similar data-taking periods in 2009 have been used to confirm the performance achieved in the 2008 commissioning period.
| Detector | Solenoid off | Solenoid on |
|---|---|---|
| All | 4 940 000 | 2 670 000 |
| 1 SCT hit | 1 150 000 | 880 000 |
| 1 Pixel hit | 230 000 | 190 000 |
3.2 Operating conditions
Most of the detector was operational during the cosmic-ray data-taking periods. Loss of coverage was mainly due to issues with the recently-commissioned evaporative cooling system and the optical links. The fractions of non-operational channels in each sub-detector are summarised in Table 2.
In the Pixel Detector three cooling loops, each serving 12 modules, showed apparent leaks, two on the positive- endcap and one on the negative- endcap. For safety, these loops were disabled in 2008, but were operated successfully in 2009, after the installation of a leak-monitoring system during the winter shutdown. In the SCT, 36 modules in the negative- endcap were turned off because of problems in two cooling loops. One of these loops was repaired after the end of 2008 operation, resulting in the recovery of 23 modules.
A major problem with the optical links for the SCT and Pixel detectors was the failure of VCSEL arrays in the off-detector electronics. The loss of data for the SCT was reduced because of the redundancy system, but the problem prevented the read-out of 35 pixel modules in the combined run. These were recovered by replacing the defective VCSEL arrays with spare parts between the combined and standalone data-taking periods. The VCSEL failures are believed to be due to Electro Static Discharge (ESD) damage. During the 2008–2009 shutdown all VCSEL arrays in the off-detector electronics were replaced with new components produced with much tighter ESD controls. A very low rate of problems was observed in 2009.
Remaining inactive parts in the Pixel Detector and SCT were mainly due to failure in high- or low-voltage connections.
In the TRT barrel 1.6% of the straws were inactive due to mechanical problems in the detector which had been noted prior to installation and 0.7% were inactive due to scattered electronics problems at the board and chip level after installation. In the endcaps about 1.6% of the electronics channels were inactive, largely due to high- and low-voltage power connection problems, while only 0.3% of the straws had known mechanical problems. The mechanical defects were always straw cathodes that had been deformed during module or wheel construction so that they would not reliably hold high-voltage, and in these cases the anode wires were removed. These numbers remained essentially constant throughout the 2008 and 2009 data-taking periods.
| Detector | Reason | 2008 | 2009 |
|---|---|---|---|
| Pixel | Cooling | 2.1% | 0.0% |
| Optical links | 2.0% – 0.0% | 0.3% | |
| Other | 1.9% | 2.4% | |
| Total | 6.0% – 4.0% | 2.7% | |
| SCT | Cooling | 0.9% | 0.3% |
| Optical links | 0.4% | 0.0% | |
| Other | 0.8% | 0.7% | |
| Total | 2.1% | 1.0% | |
| TRT | Total | 2.0% | 2.0% |
The detector conditions were supervised and monitored by a Detector Control System bib:DCSPaper , which monitored high-voltage and low-voltage values, temperatures and other environmental parameters. In particular the applied bias voltage on the silicon detectors was used to compute the Lorentz angle (Section 7.2) during track reconstruction, and the detector status was used to assess the data quality.
Monitoring software bib:Monitoring running within the ATLAS Athena framework bib:AthenaCore was used to analyse data and to reconstruct tracks as described in Section 3.3, both online during the physics run and during offline reconstruction. The light-weight online monitoring ran on a limited subset of data, while the offline monitoring provided more in-depth analysis over larger samples of data.
3.3 Track reconstruction
Data were reconstructed using ATLAS software in the Athena framework bib:AthenaCore . In a first step, groups of contiguous pixels (in the Pixel Detector) or strips (in the SCT) with a hit were grouped into clusters. Channels which were noisy, as determined from either online calibration data or offline monitoring, were rejected at this stage. The one-dimensional strip clusters from the two sides of an SCT module were combined into three-dimensional space-points using knowledge of the stereo angle and the radial (longitudinal) positions of the barrel (endcap) modules; in the case of pixel clusters, only the knowledge of the radial (longitudinal) position was necessary to construct a barrel (endcap) space-point. The construction of TRT drift circles, i.e. the radial distance of the particle trajectory to the wire in a tube, required knowledge of the time of the cosmic ray passing through, which was determined using the iterative procedure described in Section 4. The three-dimensional space-points, in the Pixel Detector and SCT, and the drift circles, in the TRT, formed the input to the pattern-recognition algorithms.
The track reconstruction bib:NewTrackingPubNote started the pattern recognition by using space-points from the silicon detectors. In cosmic-ray data, these track candidates were allowed to span the central beam-axis region, and no cut was placed on the transverse impact parameter . These silicon-only tracks were extended in both directions into the TRT, and refitted using all associated space-points from the silicon and TRT detectors. As shown in Table 1, a significant fraction of tracks from cosmic rays do not pass through the silicon detectors, and these were found by running a TRT stand-alone track-finding algorithm on the remaining measurements. At all stages, the track fitting was performed using the global fitter described in bib:GlobalChi2TrackFitter .
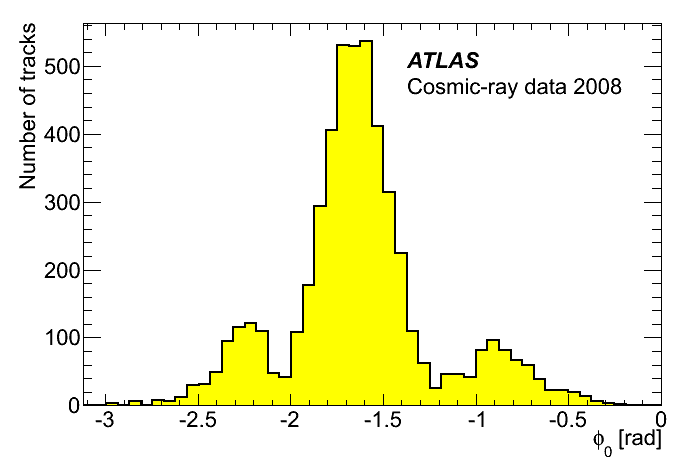
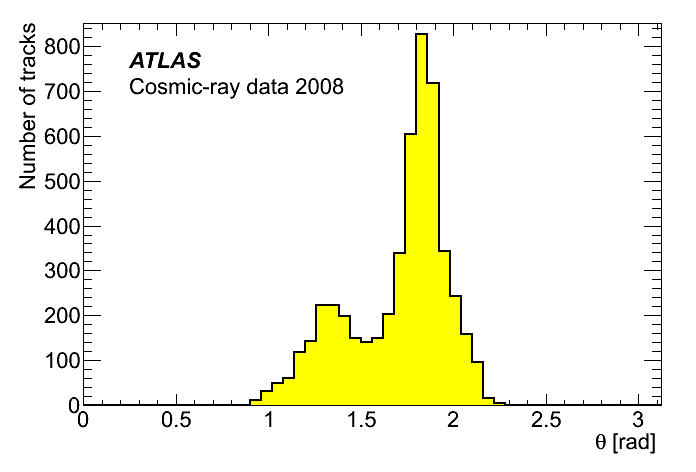
To measure the resolution of the track parameters the cosmic-ray tracks which traverse the ATLAS detector from top to bottom were split into two halves. This was done by fitting two new tracks, each containing the hits in the upper or lower half of the detector only. These new tracks are referred to as split tracks. Figure 2 shows the momentum and angular distributions of the split tracks as measured in data. The shapes of the and distributions reflect the fact that particles could enter the ATLAS cavern through the access shafts more easily than through the rock. The range of is always negative as the split tracks in both the upper and lower halves of the detector are reconstructed from top to bottom. The high asymmetry in the low momentum bins in 2(a) is due to the toroid deflecting coming from the shafts away from the ID. The resolution results are presented in Section 7.3.

3.4 Tracking triggers
The ATLAS trigger system has a three-level architecture: Level-1, Level-2 and Event Filter. Level-2 and Event Filter together form the High Level Trigger (HLT) bib:ATLASDetectorPaper .
The trigger for cosmic-ray events was provided by the muon or calorimeter systems at Level-1. For the ID standalone data-taking, a Level-1 TRT trigger was added, based on a fast digital OR of groups of approximately 200 TRT straws bib:FastOr .
Three Inner Detector tracking algorithms were run at Level-2. One algorithm was specifically designed for cosmic-ray running and used only barrel TRT information. It reconstructed tracks in a search window of up to about 45∘ to the vertical in azimuthal angle. The other two algorithms bib:HLTTracking were designed for collisions but were adapted for cosmic-ray running in order to exercise the algorithms online and also to complement the coverage of the TRT trigger. These algorithms started with track reconstruction in the silicon detectors and then extrapolated tracks to the TRT. As a consequence of being designed for collisions, the cosmic-particle trajectory was reconstructed as two tracks: one going upwards and the other downwards. The two algorithms used a common input consisting of space-points formed from clusters of hits in the pixel layers and from associated stereo-layer hits in the SCT. They shared common tools for track fitting and extrapolation to the TRT, but differed in the initial track-finding step:
-
•
SiTrack was based on a combinatorial method. It first looked for pairs of space-points in the inner layers consistent with beam-line constraints, then combined these pairs with space-points in other layers to form triplets and finally merged triplets to form track candidates. In order to achieve good efficiency in cosmic-ray data-taking, the beam-line constraints were relaxed compared with those used for collision data.
-
•
IDSCAN used a three-stage histogramming method to first determine the -coordinate (position along the beam) of the interaction point in collision events, and then look for track candidates consistent with this interaction point. For cosmic-ray data-taking a first step was introduced which shifted the space-points in the direction transverse to the beam-axis, so that the shifted points lay on a trajectory passing close to the nominal beam position.
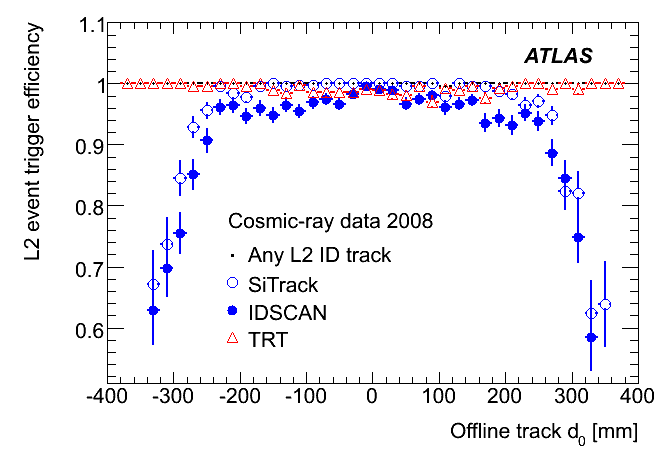
The efficiency of the Level-2 ID cosmic-ray trigger was determined using events triggered by the Level-1 muon trigger and containing an offline ID track. In Fig. 3 the efficiency is shown as a function of the transverse impact parameter of the offline track, , for each of the three different algorithms as well as for the combined trigger. The efficiency was calculated for the sample of offline tracks with 3+3 space-points on the upper+lower track segments in the silicon barrel. The track was also required to be within the TRT readout time window. The efficiency for IDSCAN and SiTrack falls off for tracks with approaching the radius of the first SCT layer (300 mm). The space-point shifting step that precedes IDSCAN fails for high curvature tracks, and this is reflected in a lower efficiency for IDSCAN. The combined efficiency is .
3.5 Simulation
Cosmic-ray events were simulated by a sequence which first generated single particles at the surface above ATLAS, then filtered them for acceptance in the detector and finally ran the standard detector simulation, digitisation and reconstruction.
The generator used the flux calculations in Ref. bib:muonFlux1983 and a standard cosmic-ray momentum spectrum bib:PDG . Muons pointing to a sphere representing the inside of the experimental cavern were propagated through the rock, cavern structures and the detector using simulation software based on GEANT4 bib:geant4a ; bib:geant4b . To increase the acceptance, only events with at least one hit in a given volume inside the detector were submitted to the digitization algorithms and the event reconstruction. The digitisation was adapted to reproduce the timing properties of cosmic-ray muons (see Section 4), and tracks were reconstructed as described in Section 3.3.
4 Detector timing
All sub-detectors use a common clock signal, with a 25 ns period corresponding to the spacing of LHC bunch-crossings (BC). This is either an ATLAS internal clock or one provided by the LHC and synchronised to the bunch-crossing. A delay to this signal is then applied by each detector component in order to account for signal propagation times.
A major difference between cosmic-ray running and detector operation with LHC collisions is that cosmic-ray events occur evenly distributed in the interval between two clock edges. In order to properly treat cosmic-ray events, it is therefore necessary to measure for each event the time difference between the clock edge and the passage of the cosmic-ray particle. This time difference is then an input to the track reconstruction and analysis. The TRT timing determines the precision of this measurement, because the granularity of its leading-edge measurement is ( of a BC) instead of one BC as for the silicon detectors. It is therefore used as a reference. The broader readout window of the Pixel Detector helped in verifying the coarse selection of beam clock offsets for both the TRT and SCT, and in understanding the trigger time offsets for the various triggers used in cosmic-ray data-taking.
4.1 TRT timing
TRT timing requirements are set by the constraint that both the leading-edge and trailing-edge transitions of a signal must be within the ns (three BC) readout window. About are required to cover the range of electron drift times at the full magnetic field. Propagation time differences within a front-end board are about and, combined with small cabling and time-of-flight effects, imply that a time offset bigger than would result in acceptance losses. The readout timing was initially synchronized across the detector using measured cable lengths, which gave a spread of in the barrel, and within one bunch-crossing in the endcaps.
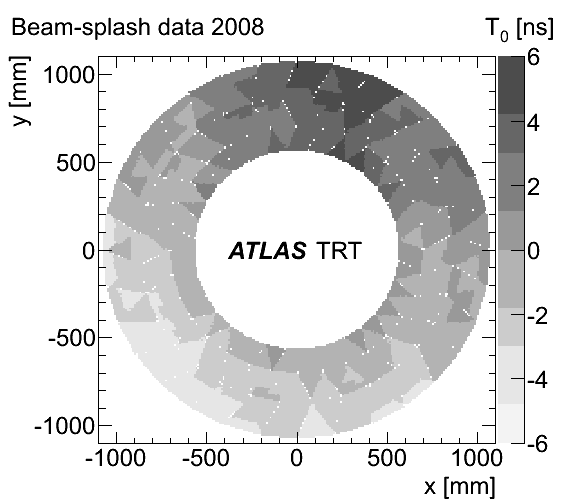
In the barrel region, the time offset for each Trigger, Timing and Control unit bib:TRTElectronics was improved using cosmic-ray tracks, and the corresponding corrections were applied to the hardware settings. These offsets were validated using the LHC beam-splash events. In these events many particles passed through the detector at the same time. Almost every TRT straw was hit multiple times and, apart from time-of-flight effects, different parts of the detector were hit simultaneously. Figure 4(a) shows settings which were estimated with a single beam-splash event. Since the readout timing before beam-splash events had already been adjusted using cosmic-ray events, the systematic effect due to time-of-flight in cosmic-ray data can clearly be seen. Apart from this, the measured time is uniform, with variations of about . These settings were monitored in the subsequent running periods and they have remained stable.
In the endcap regions very few cosmic-ray events had been collected by September 2008. The initial correction was derived from beam-splash data. This adjustment was validated using cosmic-ray data and, after subtracting the time-of-flight, the measured constants in the endcap showed an accuracy of 1.3 ns.
In the cosmic-ray run the TRT time measurement was used to determine the time, , of a cosmic ray passing through the ID. This was determined by the average of measured TRT leading-edge times for all hits on a track, corrected for electron drift time and offline calibration constants (see Section 5.3). Since the estimated electron drift time depends on the track trajectory, the track was first fit using only the position of the centre of each hit wire, without using the drift-time information. These track parameters were then used to estimate and this estimate was used to correct the position of TRT hits and to repeat the track fit.
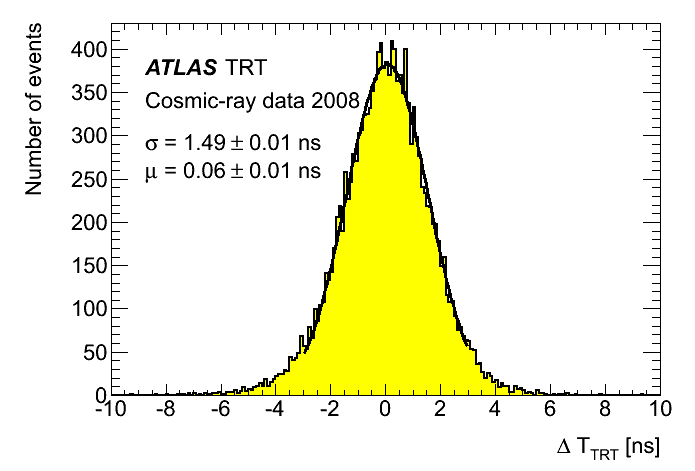
The accuracy of this measurement procedure was studied by splitting the cosmic-ray track into upper and lower parts and fitting separately for each. The time difference between the two segments is shown in Fig. 4(b). The resolution is estimated as the spread of this difference, divided by two. This factor assumes a statistical error only, and is a combination of a due to both upper and lower uncertainties contributing to the spread, and another factor of because split tracks have half the number of hits. The accuracy of for barrel tracks in the 2008 cosmic-ray data was shown to be better than .
4.2 Pixel Detector timing
The Pixel Detector front-end electronics can read out up to 16 consecutive BC for each trigger bib:FEI3chip . Each recorded hit includes the number of the BC in which it occurred.
At luminosities higher than cm-2s-1, the expected occupancy will only permit read-out of a single BC per trigger. In cosmic-ray data-taking the low trigger rate allows a broader time window. In the 2008 commissioning run, eight BC were read out per trigger.
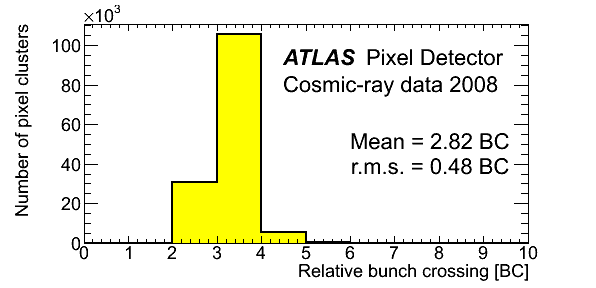
The BC distribution for hits from cosmic-ray muons is shown in Fig. 5(a). The spread is due to the convolution of the front-end electronics timewalk, which results in low pulse-height hits being assigned to a late BC, and to the uniform time distribution of cosmic rays.
The distribution of hits among bunch crossings can be used to improve the detector timing relative to the corrections computed from measured signal delays in cables and read-out electronics.
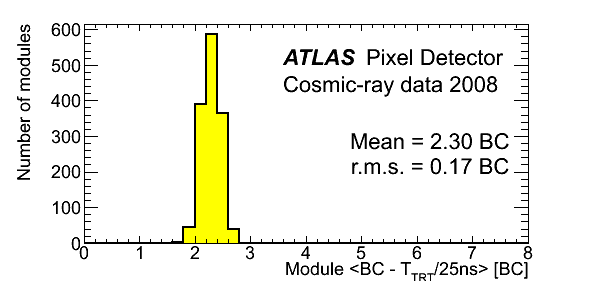
Module-to-module synchronization in the barrel was assessed averaging the BC, corrected for , of clusters with a pulse height greater than 15 000 . The subtraction of reduces the spread due to the event time and the requirement on pulse height removes the timewalk effect. The measured values are shown in Fig. 5(b) and indicate a time variation of 0.17 BC, equivalent to 4.25 ns without any specific module-to-module tuning. This is sufficient to obtain full efficiency in the readout window used for detector commissioning. To reduce the spread and extend the tuning to the endcap region, the higher statistics from collision events will be needed.
4.3 SCT timing
The readout of the SCT needs to be synchronized with the bunch-crossing time to ensure that the signal is sampled at the peak of the charge-response curve. In cosmic-ray data-taking, a strip is read out if the signal is above threshold in any one of three 25 ns time-bins centred on the triggered bunch-crossing.
Prior to cosmic-ray data-taking, the timing of each module was adjusted to compensate for differences in the lengths of the optical fibres used for data transmission to and from the modules. During data-taking, the overall timing of the SCT was adjusted in steps of 25 ns until a peak in occupancy associated with tracks was observed. No attempt was made to refine this timing using finer adjustments, and no corrections for time-of-flight were applied.
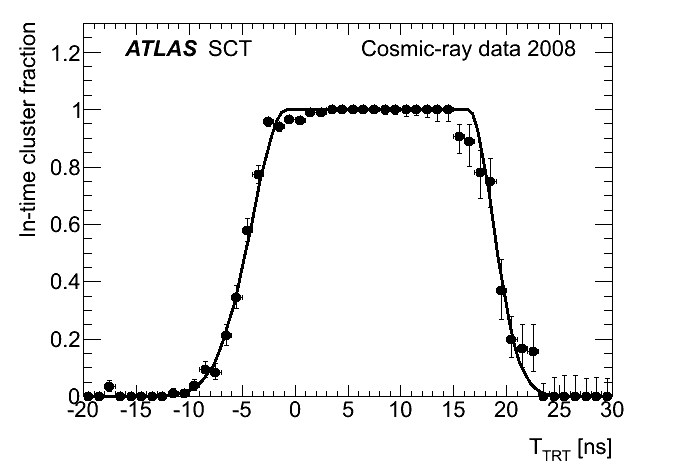
The degree of synchronisation of the SCT was studied using the cosmic-ray timing derived from the TRT. Figure 6 shows the fraction of in-time clusters on a track as a function of for barrel modules. The clusters were required to contain at least two strips, all from the same BC, to reduce the effect of variations in the charge-collection time. The distribution has a flat top with a width of about 25 ns and can be fitted to a step function convolved with two Gaussian functions. The peak time of the charge response corresponds to the mid-point of the step function. Separate fits have been performed for the SCT barrel modules served by a single optical-fibre ‘harness’ (each harness serves six modules on a barrel at the same azimuthal angle). Most of the barrel harnesses are well synchronised: the r.m.s. width of the distribution is 1.8 ns.
4.4 BCM timing
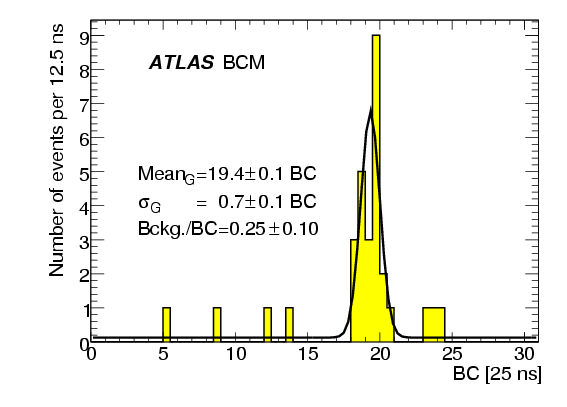
Even though the BCM acceptance for cosmic rays is very limited, during the November 2008 operation, a total of 131 events had muons passing through this detector. These allowed the relative timing between the BCM signal and the trigger to be measured. From the timing distributions, an offset of BC was observed for triggers based on the muon system and of BC for the events triggered by the TRT Fast-Or, as shown in Fig. 7. These observed time offsets agree well with the expectation of 19 BC from the estimation of propagation time along cables and optical fibres.
5 Sub-detector calibration
| (a) Pixel Detector thresholds | (b) Pixel Detector noise |
To be prepared for data-taking, each sub-detector performs a set of calibrations necessary to provide a uniform response, to map defective channels and to ensure an acceptable noise rate. Offline calibrations are then obtained during normal data-taking. They consist of additional noise suppression and, for the Pixel Detector and TRT, corrections to the position measurement of reconstructed tracks.
During collision data-taking, it is planned that offline calibrations will be performed on a subset of the data and the bulk processing of most data will start only after these calibrations have been validated. This model could not be applied during the 2008 data-taking, since the rate of events with tracks, especially in the silicon detectors, is many orders of magnitude lower than in LHC collisions. Therefore offline calibration results were only used in the reprocessing at the end of the data-taking period.
5.1 Pixel Detector calibration
The calibration of the Pixel Detector consists in tuning the optical communication links and adjusting the front-end electronics to provide uniform thresholds and response to injected charge. Suppression of noisy channels is also done at this time. Data for these calibrations are acquired in special runs. A detailed description of the hardware calibration is available in bib:PixelCosmicPaper . The quality of the calibration is then verified using measurements of noise rate, charge collection and timing in normal ATLAS runs. The cluster reconstruction algorithm, which uses the pulse height to improve the accuracy of the position measurement is also calibrated.
The optical data-links contain arrays of 8 or 16 VCSEL devices bib:PixelOptoElectronics ; bib:PixelOpticalLinks . The bias voltage which controls optical power can only be adjusted for the data-link as a whole. Due to the spread in the device characteristics, the optical power for a setting is not uniform and a scan of the bias voltage is performed to determine a suitable value for all devices in the data-link. A bit-error rate of with a confidence level of 99% was measured for the two bandwidth configurations, 40 and 80 Mbits/s, which will be used for operation up to a luminosity of cm-2s-1. At higher luminosity, the innermost layer will be operated at a readout speed of 160 Mbits/s, by using two 80 Mbits/s channels for each module.
Threshold calibration of the front-end electronics is performed by injecting known amplitude signals into the input of the electronics chain. The fraction of observed hits as a function of the injected charge is fitted with an error function, providing the threshold, defined as the 50% efficiency point, and the electronic noise. An 8-bit DAC is used to adjust the threshold to the target value. The distributions of threshold and noise for the whole detector are shown in Fig. 8. At the nominal working point, corresponding to a 4000 threshold, a uniformity of 40 r.m.s. is achieved after tuning. In these conditions the average noise level is 160 for most pixels, and slightly higher for pixels of 600 m size (long pixels) or for pairs of interconnected pixels (ganged pixels), which are used to cover the otherwise dead area between front-end chips bib:PixelSensors . The tails in Fig. 8 correspond to of channels differing by more than 250 from the nominal threshold and of channels with noise greater than 600 , which may give high noise occupancy during operation.
Due to the finite electronics rise-time, low-amplitude pulses may be assigned to a BC later than the one in which the signal is generated bib:FEI3chip . Therefore the in-time threshold is also measured. This is the minimal signal for which the hit is located in the same BC as the particle crossing. For the reference 4000 threshold, the in-time threshold is 5400 , with a r.m.s. spread of 240 .
Due to the high threshold-to-noise ratio, random noise occupancy, i.e. the probability for a channel to give a noise hit per BC, is extremely low. Dedicated standalone runs with random triggers are used to find and mask the small fraction of channels that show an anomalous occupancy, greater than hits/BC. Random triggers during normal data-taking runs are used for monitoring additional noisy channels which are not used in reconstruction if they have an occupancy greater than hits/BC.
The actual fraction of noisy pixels was below for all the 2008 data-taking. After masking these channels, the noise occupancy was hits/BC, corresponding to less then one noise hit per event in the Pixel Detector.
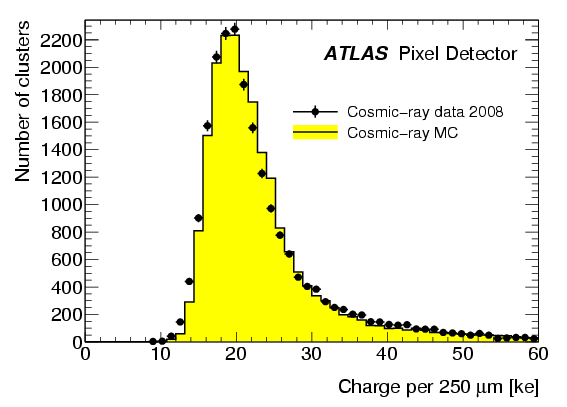
The pulse height is measured using the Time-over-Threshold (ToT) method. The relationship between amplitude and ToT is calibrated with charge injection and the resulting calibration curve is used to reconstruct the energy deposited in the detector by charged particles. The absolute scale of the ToT calibration can be estimated by comparing the observed spectrum of collected charge with the expectation obtained by combining the theoretical model of energy loss in silicon bib:Bichsel , the average energy needed to create an electron-hole pair, eV/pair bib:SiW2 , and the effect of losses of collected charge due to the finite threshold of pixels (Fig. 9). For this study two methods were used. The first selected two-pixel clusters on tracks with incident angle : for these clusters the losses due to threshold effects are negligible and the most probable value could be directly compared to theoretical predictions. The second compared the pulse height of one-pixel and two-pixel clusters in data and Monte Carlo as a function of in the range . Both methods agreed, providing a calibration factor for the charge scale of , consistent with unity. The largest systematic uncertainties are 2.4% from the spread of the measured values of bib:SiW2 ; bib:SiW1 ; bib:SiW3 ; bib:SiW4 and 2% from the theoretical modelling of energy loss in silicon.
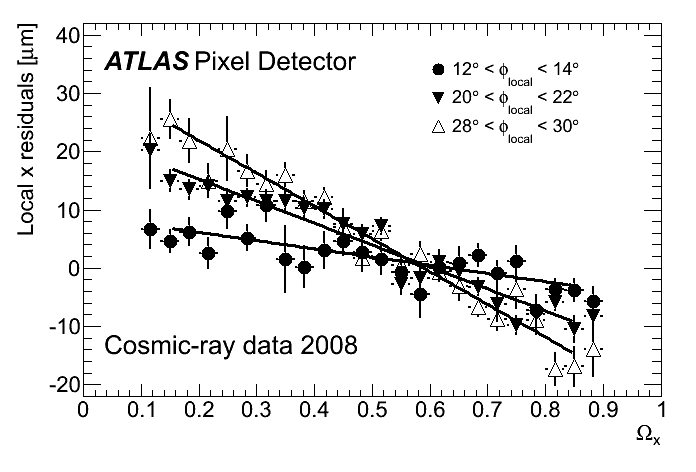
Pulse-height measurements improve the accuracy of the position measurement, in both the local and coordinates, for clusters consisting of more than one pixel. The charge-sharing ratios, and , between the signals collected on the first and last row or column in the cluster
are used to correct the geometrical centre-of-cluster positions with a linear function
| (1) |
with weights, and , depending on the particle incident angle and cluster size bib:PixelLorentzAngle .
Cosmic rays with transverse momenta GeV provided a calibration of for two- and three-pixel clusters and (Fig. 10), a range much wider than expected for particles from proton-proton collisions. Along the beam direction, the limited range of cosmic-ray polar angles (Fig. 2(c)) only allowed the calibration for two-pixel clusters up to ; collisions are needed to cover the full acceptance in pseudorapidity. This calibrated position-reconstruction algorithm is expected to provide a measurement accuracy of 6 m in the transverse plane for two-pixel clusters.
 |
 |
| (a) SCT threshold dispersion | (b) SCT noise |
5.2 SCT calibration
Good front-end calibration is essential to the operation of the SCT because of the binary readout employed. The channel thresholds must be set to provide good efficiency (99%) and uniformity of response while keeping the noise occupancy below hits/BC. The calibration procedure is described in bib:SCTDAQ and it follows a sequence similar to the one described for the Pixel Detector. Calibration runs are performed with the SCT data-acquisition system in a standalone mode, and the data analysed online. As a first step the parameters of the optical data links bib:SCTOpticalLinks are tuned to ensure reliable communication to and from the modules.
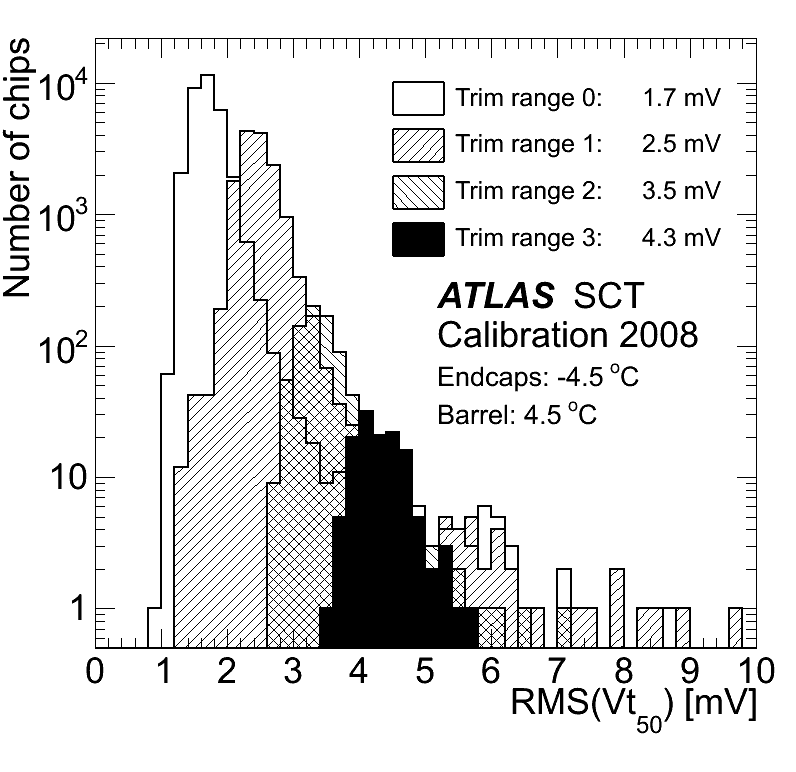
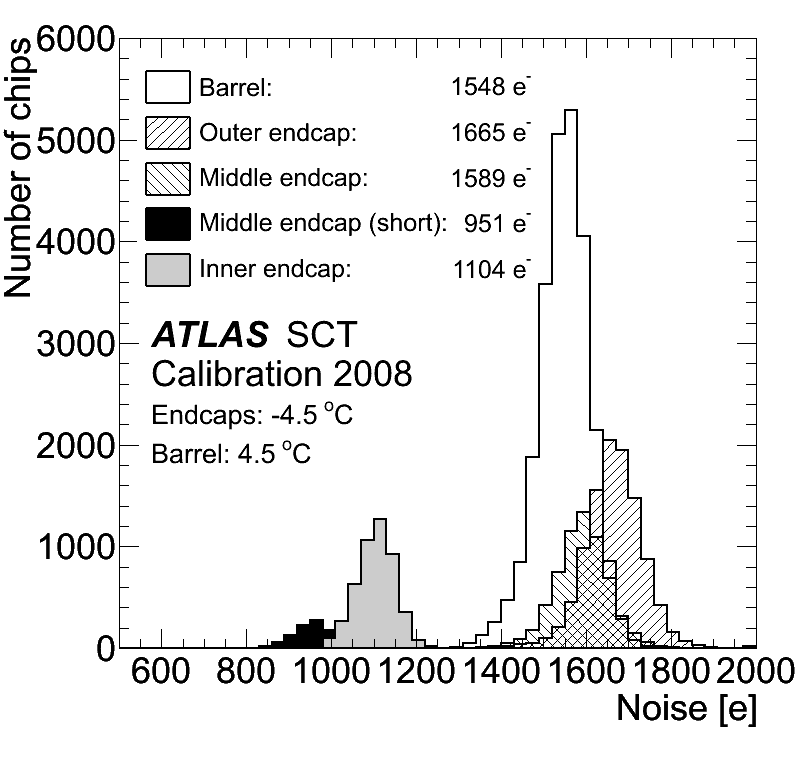
Threshold calibration is performed by injecting known charges into the front-end of each readout channel and measuring the occupancy as a function of threshold. For each input charge the dependence is parameterized using a complementary error function. The threshold at which the occupancy is 50% () corresponds to the median of the injected charge while the sigma gives the noise after amplification. Channel gains are extracted from the dependence of on the input charge, and are used to set the discriminator thresholds. Channel-to-channel variations are compensated using a 4-bit DAC (TrimDAC). The TrimDAC steps can themselves be set to one of four different values to allow uniformity of response to be maintained when uncorrected channel-to-channel variations increase after irradiation. The achieved uniformity of response is shown in Fig. 11(a), which shows the distribution of the r.m.s. spread of values on a chip. Distributions are shown separately for chips in each TrimDAC range; most of the chips are configured in the finest setting, with a small spread. After irradiation it is expected that coarser settings will become necessary. The uniformity at the nominal threshold of 1fC, corresponding to a signal of 54–58 mV, is 4%. The corresponding noise level, shown in Fig. 11(b), is between 900 and 1700 , depending on the strip length.
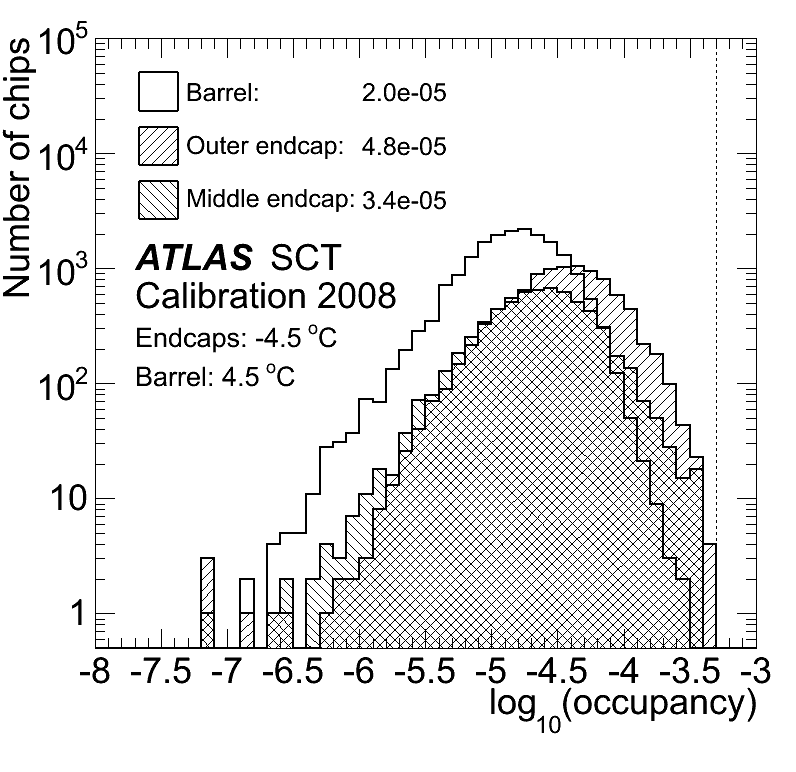
Threshold scans with no injected charge are used to measure the noise occupancy and strips with occupancy greater than hits/BC are disabled. Figure 12 shows the occupancy values measured in calibration mode after removing the of noisy strips. Normal data-taking runs are used for the identification of noisy channels which escape detection during the calibration runs. Strips with an occupancy above hits/BC are subsequently removed during reconstruction. The number of such strips never exceeds of the channels. The noise occupancy in cosmic-ray data was calculated as the number of hits per event not associated to a track, per channel and BC. This rate was found to be of order of , in good agreement with the calibration-mode data.
5.3 TRT calibration
As for the other sub-systems, the first step in calibrating the TRT is to adjust the data-links to provide reliable communication. There are separate steps for adjusting, on one hand, the phasing of the clock and the trigger and control lines and, on the other hand, the phasing of the data lines from the front end into the optical links going to the TRT RODs. Noise data are then acquired in special calibration runs and are used for the high-uniformity tuning of detector thresholds.
The effective gain and inherent noise of the front-end chips were measured during production by injecting each channel with known amplitude signals at multiple threshold settings. At the board, module and detector level, thresholds were set to give a noise occupancy corresponding to the desired threshold in fC. The uniformity of the random noise occupancy (or rate) for different detector elements at the same effective threshold gives a measure of element-to-element matching.
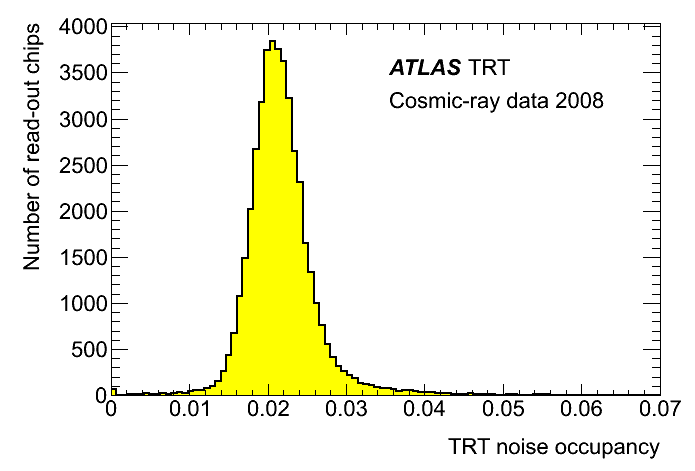
The TRT low (tracking) threshold is set to about 2 fC, corresponding to 250 eV of deposited ionization energy. This setting gives an average noise occupancy of about 2% for the three bunch-crossings sampled by each trigger. This calibration process achieves a uniform response to particles across the detector, correcting, for example, for the effect on the physical thresholds of ground offsets in the low voltage levels supplied to the front-end electronics. Figure 13 shows the TRT low threshold noise occupancy in 2008 cosmic-ray data. The occupancy is uniform with a r.m.s. spread across the detector of 0.5%. The 2% permanently dead straws and the handful with 100% occupancy are discarded.
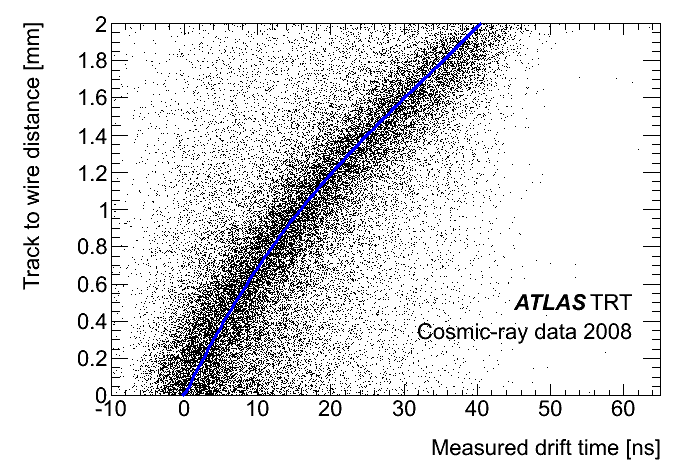
Normal data-taking runs are used for the identification of noisy channels and measurement of random noise. These runs are also used to compute parameters needed to optimize the determination of the particle crossing point. The parameters consist of the for each 16-straw time-measuring chip and the global time-distance relationship, , shown in Fig. 14. The relationship is obtained by fitting a third-order polynomial to the distance of the reconstructed track from the centre of the straw as a function of the time of the leading-edge, corrected by .
6 Alignment
| Level | Brief description | Structures | Degrees of freedom |
| 0 | Total: | 7 | 41 |
| Whole Pixel detector | 1 | 6 | |
| SCT barrel and 2 endcaps | 3 | 18 | |
| TRT barrel (except ) and 2 endcaps | 3 | 17 | |
| 1 | Total: | 14 | 84 |
| Pixel barrel layers split into upper and lower halves plus 2 endcaps | 6+2 | 48 | |
| SCT barrel split into 4 layers plus 2 endcaps | 4+2 | 24 | |
| 2 | Total: | 2472 | |
| Pixel barrel layers split into staves plus 2 endcaps | 112+2 | 684 | |
| SCT barrel layers split into staves plus 2 endcaps | 176+2 | 1068 | |
| TRT barrel modules (except ) | 96 | 480 | |
| TRT endcap wheels (only , and ) | 240 | ||
| 3 | Total: | 3568 | 7136 |
| Pixel barrel modules (only and ) | 1456 | 2912 | |
| SCT barrel modules (only and ) | 2112 | 4224 |
The accuracy with which particle tracks can be reconstructed is limited by how precisely the positions and orientations of the ID sensor modules and wires are known. The requirement on the alignment quality is that the resolution of track parameters is to be degraded by no more than 20% with respect to the intrinsic resolution bib:IDTDR . The silicon pixel and strip modules must be aligned with a precision of respectively 7 m and 12 m in the sensitive direction. In the ( for the endcap) direction of silicon modules and for the TRT, the alignment precision is required to be of several tens of micrometres. In addition, the alignment should have minimal systematic effects which could bias the track-parameter determination.
The alignment is specified by a set of constants, six for each individual module or assembly structure (barrel layer, endcap disk, etc.) corresponding to the six degrees-of-freedom of a rigid body: three translations , and with respect to the nominal position and three rotations , and with respect to the nominal axis orientations.
Track-based alignment algorithms were used to determine alignment constants using the cosmic-ray data collected in 2008. The algorithms use the tracking residual distributions of the modules; a residual is defined as the distance between the position of the measurement and the intersection of the fitted track with that module. The alignment constants can be determined via a minimisation of the following function:
| (2) |
where the sum is over all tracks in a given event sample, is the vector of residuals for a given track and is the covariance matrix of those residuals. In general, is a function of both the track parameters,
| (3) |
and of the alignment constants,
| (4) |
of those modules with hits contributing to the track fit. The alignment was determined using the Global algorithm bib:GLX2 . In this algorithm the given by Eq. 2 was simultaneously minimised with respect to and to determine the alignment constants.
The results were cross-checked using two alternative algorithms, which gave consistent results. In the Local algorithm bib:LocalX2_1 ; bib:LocalX2_2 the minimisation was done only with respect to . In the Robust algorithmbib:RobustAlignment , used only for silicon detectors, the alignment corrections were calculated directly from the size of the residual bias. In all cases, an iterative procedure was used.
The 7.6 million tracks reconstructed in the Inner Detector during the 2008 cosmic-ray data-taking period were used to perform a preliminary alignment of the tracking system which significantly improved the tracking performance.
Because cosmic rays come from above and not from the centre of the ATLAS detector, more hits were recorded in silicon modules in the top and bottom quadrants of the barrel than the side quadrants or the endcaps. In addition, the large incidence angles in the side and endcap modules result in poor-resolution large or fragmented clusters. This limits the precision to which these regions of the Pixel Detector and SCT can be aligned. Due to its structure and larger acceptance, the TRT is less sensitive to this anisotropy and its alignment precision was more uniform.
6.1 Global alignment
The alignment proceeds in stages from larger structures to the individual module level, as detailed in Table 3. At each stage more degrees of freedom are introduced, but the expected sizes of the corrections are smaller.
In the first step, the Level 0 alignment, the SCT barrel and two endcaps are aligned relative to the entire Pixel Detector, followed by the TRT alignment with respect to the silicon detectors. In aligning the TRT barrel, only 5 degrees of freedom are used; the is not considered because the TRT barrel modules are almost 1 m long and do not measure the coordinate.
Cosmic-ray simulation studies with a misaligned geometry showed that, using solenoid-on tracks for the silicon detectors’ Level 0 alignment, may lead to corrections being underestimated. The presence of a misalignment between the sub-detectors could lead to a bias in reconstructed track momentum, with part of the misalignment being absorbed into the curvature. Therefore these alignment corrections were derived using only solenoid-off data. The simulation tests also showed that the solenoid-off data were able to estimate the Level 0 misalignments with a precision better than 100 m. This precision is limited by misalignments of the internal structures and by multiple Coulomb scattering effects.
For the TRT instead, both a solenoid-on and a solenoid-off sets of tracks were used. The results were compared and found consistent within the uncertainties.
Shifts from the nominal positions of up to 2 mm were observed, with rotations of several mrad, as shown in Table 4; the rotations and were all consistent with zero.
| Structure | [mm] | [mm] | [mm] | [mrad] |
| SCT barrel | 0.9 | 0.6 | 0.5 | –1.8 |
| SCT endcap A | –1.8 | 0.5 | 0.0 | –1.3 |
| SCT endcap C | –0.4 | 0.6 | 1.0 | –1.3 |
| TRT barrel | 0.2 | –0.1 | N/A | 0.0 |
| TRT endcap A | –1.5 | 0.2 | –3.4 | –7.0 |
| TRT endcap C | –1.0 | 1.7 | 2.1 | 6.4 |
6.2 Local alignment of the Pixel Detector and SCT
After the initial alignment of the detector components as a whole, the subsequent alignment levels consider smaller structures.
Due to the low statistics the endcaps were aligned globally, but no attempt was made to align individual disks or modules. The initial geometry for the alignment was based on the nominal position of the modules.
The first stage in the internal alignment of the Pixel Detector and SCT (Level 1) was the alignment of the pixel half-shell barrel layers, the full SCT barrel layers and the four endcap structures (two for each of the Pixel Detector and the SCT). The SCT barrel layers were considered to be rigid cylinders, whilst the pixel half-shells were considered rigid half-cylinders. For all the structures, the full set of 6 degrees of freedom was considered in the alignment. This level was aligned combining both solenoid-on and solenoid-off cosmic-ray data. The computed alignment corrections were of the order of hundreds of micrometres in all , and , with in particular a rotation of the first pixel upper half shell of almost 2 mrad with respect to the other layers.
The next step was the alignment of the Pixel Detector and SCT stave-by-stave (Level 2). The pixel staves are real structures, composed of 13 modules in the same position, which were assembled and surveyed. The SCT was not assembled in staves but the modules were individually mounted on the support cylinder. Nevertheless, for alignment purposes the SCT barrel was also split into rows of 12 modules. The staves were considered a rigid body and all 6 degrees of freedom were used. The alignment corrections for the translations of the staves were of the order of tens of micrometres.
Once the staves were aligned the alignment at module-to-module level (Level 3) was performed. The positions of pixel modules mounted within the staves were surveyed just after assembly bib:PixelSurvey . This survey information was used as a starting point for the internal alignment of the pixel modules, but not to constrain the alignment corrections, because the deformation of staves after the survey was expected to be significantly larger than survey errors. This step was performed in the local coordinate system described in Section 2 for individual silicon modules.
The number of hits per module was much smaller than for the larger structures, and thus the statistical precision of the alignment becomes a significant consideration. Therefore the number of degrees of freedom was reduced to just two per module, and . These two parameters were chosen because they were appropriate to describe the lateral bending along the pixel staves, the largest deformation observed in the residuals, with an amplitude reaching 500 m for the worst case.
Pixel Detector and SCT residual distributions before and after the alignment procedure are shown in Fig. 15 for tracks with GeV and mm. These are compared to distributions obtained using a perfectly-aligned Monte Carlo simulation of cosmic rays. Before alignment the residual distributions are very wide compared to the Monte Carlo simulation and also biased. After alignment their widths were substantially reduced and the means are consistent with zero to within a few micrometres.
The residuals cannot be used to quote the point resolution, because their errors include a contribution from extrapolation uncertainties larger than the point resolution. This contribution also depends on the track momentum and silicon layer, resulting in strongly non-Gaussian distributions. By comparing the width of the aligned residual distributions to the simulation, and assuming that the only contribution to the increased width is from misalignments, the size of the remaining module-level misalignments is estimated to be approximately .
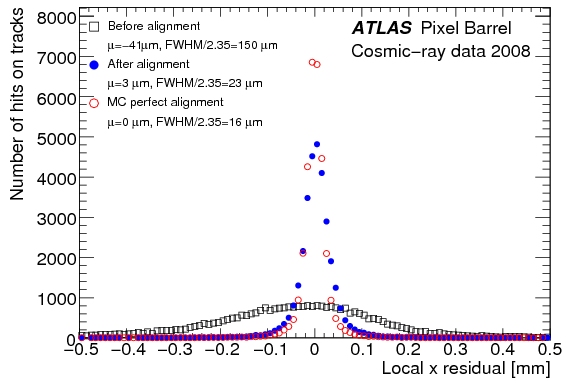
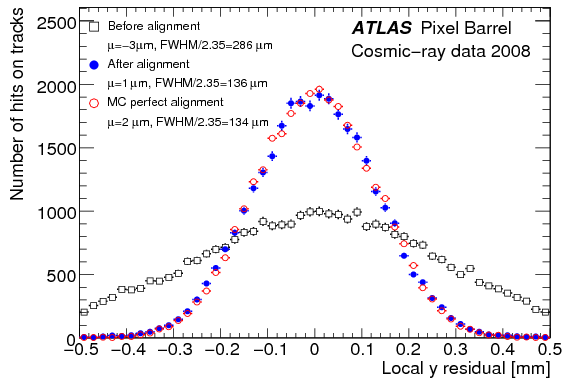
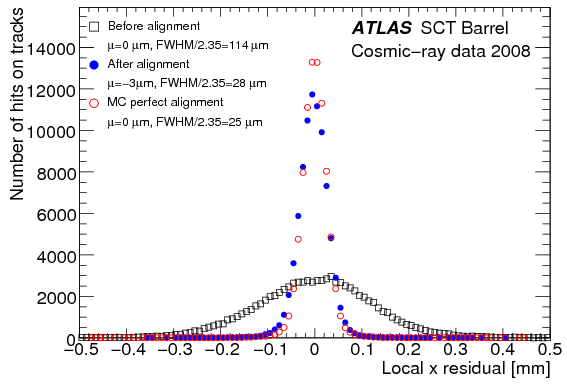
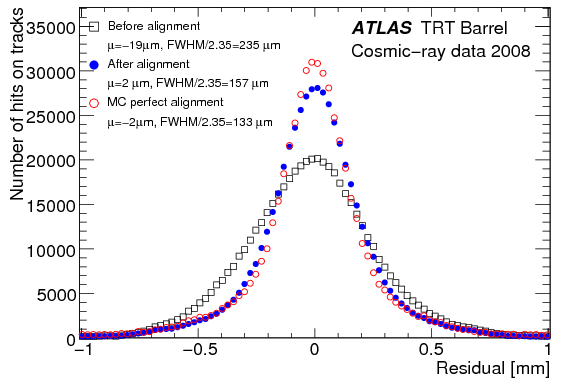
6.3 Local alignment of the TRT
The second step of the TRT barrel alignment internally aligned the 96 individual TRT barrel modules (three layers of 32 -sectors each). Although the straw anodes inside the barrel modules are physically separated at =0, no such distinction exists at the module level. As for the Level 0 barrel alignment, only five degrees of freedom were used, being non-measurable. The internal alignment was determined separately for different periods of cosmic-ray data taking, which could either be solenoid on or solenoid off. This internal alignment used TRT stand-alone tracks, giving high statistics because of the larger acceptance of the TRT volume. The size of the translation alignment corrections was of the order of 200-300 m with respect to the nominal position of the modules.
In each endcap, the 40 wheels were aligned in three degrees of freedom: , , and . The corrections for the translations were of the order of 100 m and the rotations were tenths of a milliradian.
Figure 15(d) shows the residual distribution for tracks with in the barrel modules, both before and after alignment. The distributions are compared to those obtained using a perfectly aligned cosmic-ray Monte Carlo simulation. Again the width and bias of the residual distribution were improved after alignment.
6.4 Summary and perspectives
The cosmic-ray alignment significantly improved the track reconstruction and the track-parameter resolutions, presented in Section 7.3. The achieved level of precision, about 20 m, ensures that track reconstruction efficiency with early LHC data will not be significantly affected by residual misalignments.
Local alignment with cosmic rays is statistically limited by the small acceptance of individual detector modules, especially in the endcap region. Therefore it was not possible to perform a Level 3 alignment in the endcaps. In addition, a reduced set of degrees of freedom was used in the barrel region. That not all possible misalignments can be recovered using only cosmic-ray data partially explains why the nominal Monte Carlo resolution has not yet been achieved.
In order to reach the design granularity, a high statistics sample of tracks from proton-proton collisions is needed. When this has been collected, all 1744 and 4088 Pixel Detector and SCT modules will be aligned with the full set of degrees of freedom (4). Individual TRT wires will also be aligned with the two more sensitive degrees of freedom: the translation along the direction and the rotation about the or directions in the barrel and endcap regions, respectively.
7 Detector performance
7.1 Intrinsic detector efficiency
The intrinsic detector efficiency measures the probability of a hit being registered in an operational detector element when a charged particle traverses the sensitive part of the element. Both a high intrinsic efficiency and a low non-operational fraction are essential to ensure good-quality tracking.
The intrinsic efficiencies of the Pixel and SCT detectors are measured by extrapolating well-reconstructed tracks through the detector and counting the numbers of hits (clusters) on the track and ‘holes’ where a hit would be expected but is not found. The track extrapolation uses the full track fit described in Section 3.3 to compute the intersections of the track with all modules along its trajectory. If a module (module side for the SCT) does not have a cluster associated to the track and the intersection point is more than 3 from the edge of the sensitive area the absence is called a hole. The efficiency, , is defined as the ratio of the number of clusters found to the number expected:
| (5) |
where is the number of clusters found and is the number of holes.
Pixel efficiencies are determined using tracks with at least 30 TRT hits (40 for the data with solenoid off), at least 12 SCT hits and . There must be only one track passing these cuts in the event. Tracks used to measure the SCT efficiency must have at least 30 TRT hits or 7 SCT hits, a hit both before and after the module side under investigation and . A run-dependent cut on is applied to ensure good timing. The angular cuts are applied because the tracking algorithm does not function as well at high incidence angle; charge sharing among many channels combined with the readout threshold may result in multiple clusters and reduced apparent efficiency.
The track extrapolation does not predict holes near the sensor edges or ambiguously mapped pixels, so these areas are excluded from the efficiency calculation. For the Pixel detector, clusters or holes within 0.6 mm of ganged pixels in the direction, or within 1.0 mm of the sensor edge in the or direction, are excluded. Similarly, for the SCT the intersection of the track with the sensor is required to be at least 2 mm from the edge in and at least 3 mm in . To reduce the bias due to the track fitting and pattern recognition criteria, which are affected by residual misalignments, clusters not already associated to a track but close to an intersection are included in in Eq. (5) and removed from . Due to the low noise occupancy (Section 5), it is likely that these result from track reconstruction inefficiencies rather than noise. The inclusion of these clusters improves the efficiency by 0.04% in the Pixel barrel and 0.2% in the SCT barrel. Varying the distance for inclusion of non-associated clusters between 2 mm and 10 mm changes the efficiencies by at most 0.002% and 0.004% for Pixel Detector and SCT respectively, and is included in the systematic uncertainties.
Non-functioning detector elements (Section 3.2) are not included in the calculation of the intrinsic efficiency. In the SCT, complete module sides and chips are excluded; these amount to 2% of the detector. The measured inefficiency contains a contribution from isolated dead strips for which no correction is applied. For the Pixel detector, non-operational modules and front-end chips amount to 4–6% of the detector.
The measured efficiency of each barrel layer is shown for the Pixels and SCT in Fig. 16(a) for data taken with solenoid on. Efficiencies measured with solenoid off are typically 0.2% lower, indicating some residual inefficiencies arising from track reconstruction when the particle momentum is unknown. The overall efficiency of the Pixel barrel is and of the SCT barrel is ; the systematic error in each case is determined by varying the track selection criteria. Of the remaining 0.026% pixel inefficiency, is the contribution due to known defective channels observed during detector construction.
The efficiency of the TRT is determined in a similar manner to that of the silicon detectors, excluding the 2% non-functioning channels. Tracks are extrapolated through the TRT in a series of steps. To reduce tracking biases, at each point all straws in a region containing up to the third nearest neighbour are considered. The efficiency is determined by dividing the number of hit straws by the total number of straws within the region. The efficiency depends on the path length of a track inside a straw, and is therefore determined as a function of the distance of a track from the wire. Tracks are required to have at least 20 TRT hits, at least 6 SCT hits, between 5 ns and 25 ns and an angle to the vertical of less than . The efficiency of the TRT barrel, for data with solenoid on, is shown in Fig. 16(b). The overall efficiency over the plateau region is .
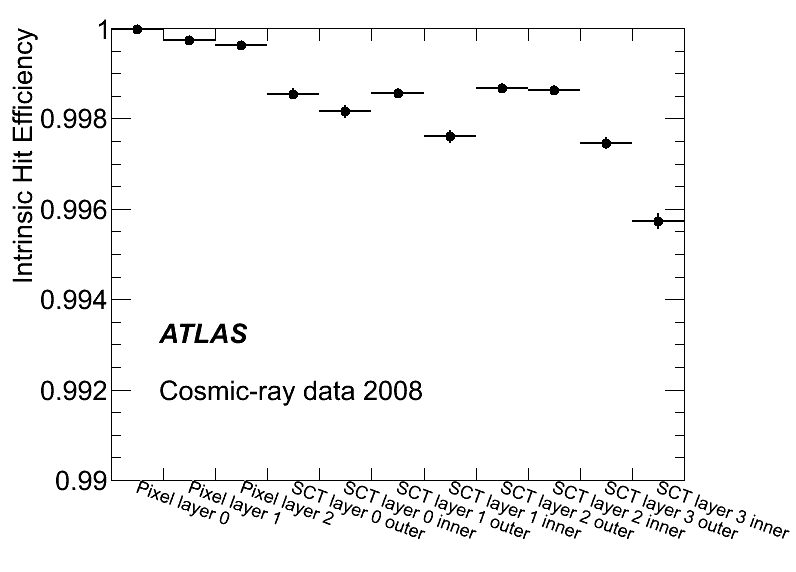
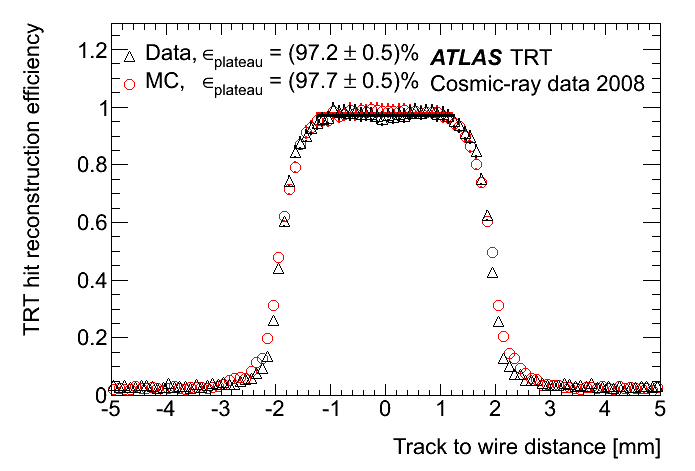
7.2 Lorentz angle measurement
The charge carriers in the silicon detectors are subject to the electric field , generated by the bias voltage and oriented normal to the module plane, and the solenoid magnetic field . In the endcaps the fields are nearly parallel and the charge carriers drift directly towards the electrodes. In the barrel modules these fields are perpendicular and the charge carriers drift at the Lorentz angle, , with respect to the normal to the sensor plane. The Lorentz angle depends on the charge carrier mobility, which in turn depends on the bias voltage, the thickness of the depleted region and the temperature bib:Jacoboni . For fully-depleted modules, the average shift in collected charge is approximately 30 m for the Pixel Detector and 10 m for the SCT, in both cases not negligible with respect to the detector resolution and alignment precision. Measurements of the Lorentz angle for the ATLAS sensors have already been performed in test beams bib:PixelLorentzAngle ; bib:SCTLorentzAngle , but in conditions different from the actual operation in ATLAS.
The Lorentz angle is measured from the dependence of the cluster size on the incident angle of the particle. When the incident angle equals the Lorentz angle, all the charge carriers generated by the particle drift along the particle direction and, apart from charge diffusion, are collected at the same point on the sensor surface, giving a minimum cluster size.
The dependence of the cluster size on the incident angle is shown for the Pixel Detector and SCT in Fig. 17. Data are fitted using the convolution of the function:
| (6) |
with a Gaussian distribution. Fit parameters are the Lorentz angle , the shape parameters , and the width of the Gaussian. For the Pixel Detector an improvement of the fit quality was observed by replacing the second term in (6) by , which is a phenomenological attempt to describe the bigger relative weight of diffusion effects for tracks at high incident angle.
The measured values are and for the Pixel Detector and SCT respectively, where the errors are statistical only. The values differ by a factor of three due to the different mobility of the charge carriers which provide the dominant signal: electrons in the Pixel Detector, holes in the SCT.
As a cross check for systematic effects, the same measurement was performed for data with no magnetic field, giving values of and for the Pixel Detector and SCT respectively. Since for the Pixel Detector the disagreement with respect to the expected null value is statistically significant, it is used as a component of the systematic uncertainty. The other dominant source of systematic uncertainty is the fit range, which has been estimated to give a contribution of for the Pixel Detector and for the SCT. The measured values of the Lorentz angle in the 2 T magnetic field are shown in Table 5 where they are compared with the expectation from the model in bib:Jacoboni . The measurements are compatible with the model predictions within the uncertainties on the predictions arising from the values of charge-carrier mobilities.
Since Pixel Detector modules operated with different temperature ranges in 2008 and 2009, it was possible to measure the dependence of the Lorentz angle on the silicon temperature. The resulting dependence
| (7) |
is in agreement with the model expectation of .
| Detector | [∘C] | Measured | Model | ||||
|---|---|---|---|---|---|---|---|
| Pixel | (electrons) | –3 | 11.77 | 0.03 | 12.89 | 1.55 | |
| SCT | (holes) | 5 | –3.93 | 0.03 | 0.10 | –3.69 | 0.26 |
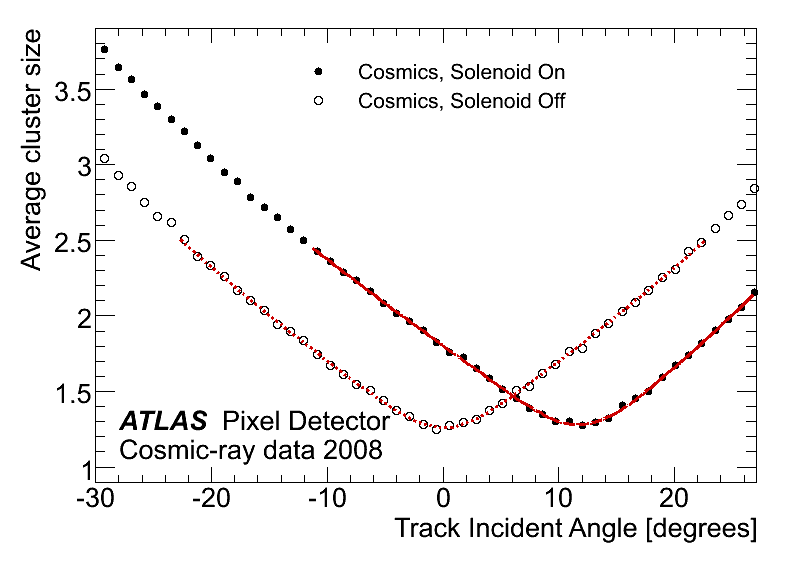
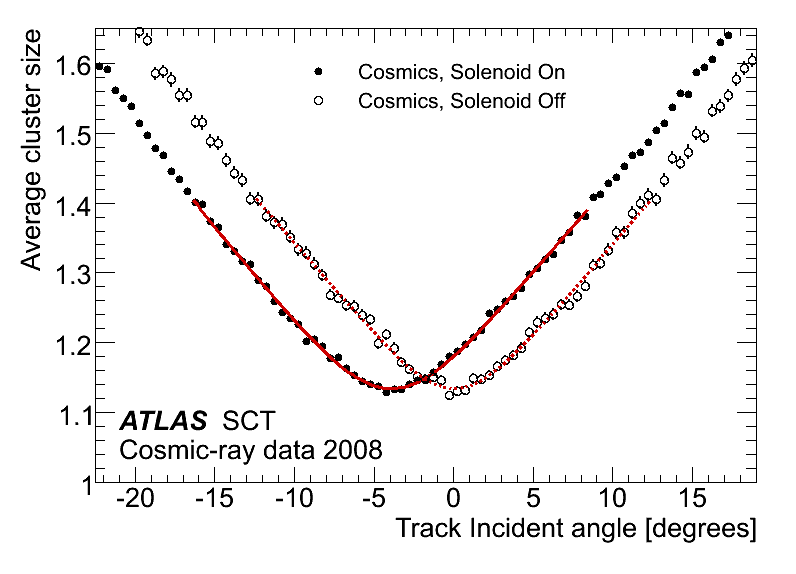
7.3 Track parameter resolution
The expected resolution of the perigee parameters , , , and of a particle emerging from proton-proton collisions in the LHC can be predicted using reconstructed and split tracks from cosmic-ray data. Since particles coming from cosmic-ray showers mostly traverse the detector from top to bottom, the resolutions can only be derived for the ATLAS barrel detectors.
In order to select tracks with good quality, the split tracks are each required to have at least 2, 6 and 25 hits in the barrel of the Pixel, SCT and TRT detectors respectively, and a transverse momentum of more than 1 GeV. The impact parameter has to be less than 40 mm to guarantee that the split tracks originate in the interaction region inside the beam pipe.
The perigee parameters and , where is any of the five parameters, of each split-track pair are compared to each other to extract the overall track parameter resolutions. Since both tracks come from the same particle, their difference for each perigee parameter must have a variance which is two times the variance of the parameters of each track. The resolution of the track parameter is therefore given by the root mean square of the distribution divided by . This method has been used to study the resolution of the perigee parameters of Inner Detector tracks. The variances were calculated excluding the outermost 0.3% of events in each distribution.
The measured resolution is compared to the Monte Carlo expectation for a perfectly-aligned detector. The difference in performance is attributed to the remaining misalignment after the procedure in Section 6. In addition, the refit of the split-track pair can be restricted to a subset of measurements in the Inner Detector. This has been done to study the perigee parameter resolutions of silicon-only tracks (Pixel and SCT) and compare them to resolutions of the same tracks which have been fitted using the full Inner Detector.
A summary of the measured track-parameter resolutions for GeV, where the multiple-scattering contribution can be neglected, is given in Table 6.
Impact parameter resolution
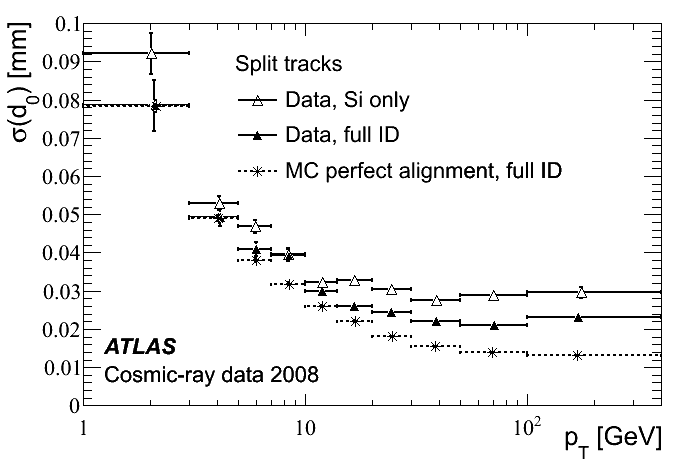 |
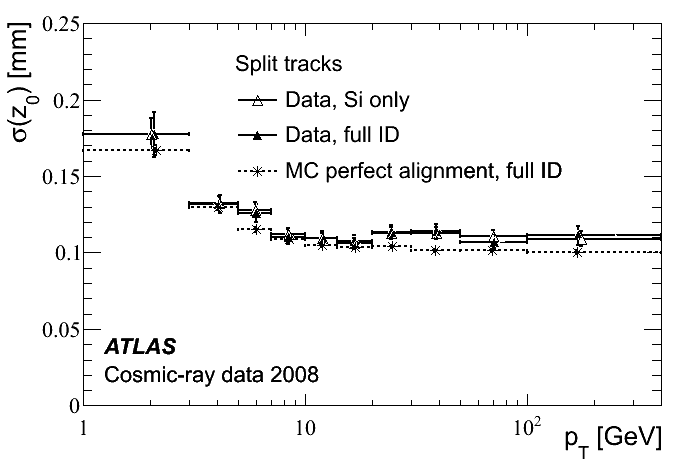 |
Figure 18 shows the transverse and longitudinal impact parameter resolutions as determined from the data using the track-splitting method. They are displayed as a function of transverse momentum. At low momenta the resolution is governed by multiple scattering in the beam pipe and first pixel layers. For higher momenta, above about 10 GeV, the impact parameter resolutions rapidly approach an asymptotic limit which is given by the intrinsic detector resolution and residual misalignments.
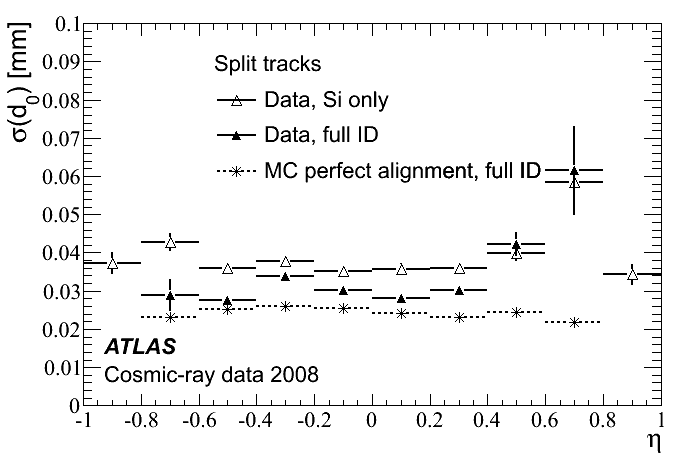 |
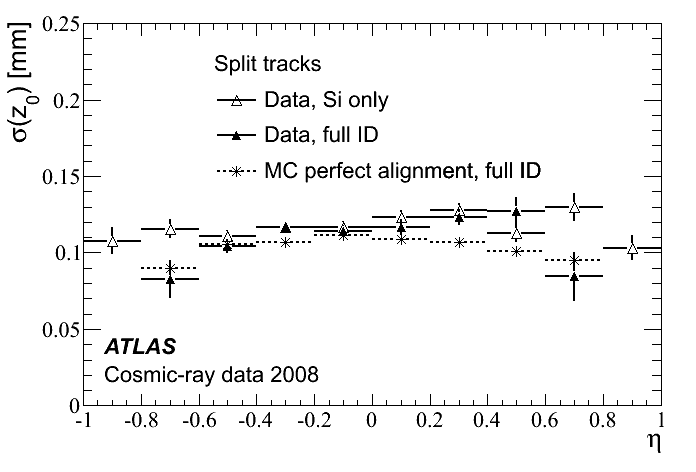 |
Resolutions as a function of are constant and symmetric around , as shown in Fig. 19. Both Figs. 18 and 19 compare the resolution obtained for Inner Detector tracks with that from a fit to solely the silicon part. The resolution is slightly more precise for full tracks, as the TRT measurements add to the momentum resolution and thus to the precision of the track extrapolation to the perigee point.
The resolution has also been studied as a function of on a sample without the cut on . The results are presented in Fig. 20 and show a worsening in resolution towards larger , which corresponds to tracks crossing pixel layers at high incident angle. Pixel clusters from such tracks are wider and possibly fragmented due to a geometrically reduced charge deposition per pixel. This effect degrades the resolution, as does the smaller number of pixel layers crossed. The resolution of full ID tracks at values near to the radii of pixel layers (about 50, 90 and 120 mm) improves because of the reduction in the extrapolation length between the closest measurement and the perigee of the track.
A dependence on the charge of the reconstructed tracks has also been investigated as shown in Fig. 20 (right plot). Small differences appear in some bins, but do not allow for a conclusive result. A dependence of the resolutions on and has been checked as well, and none was found. This means that the impact parameter resolutions follow the symmetries in the barrel part of the Inner Detector.
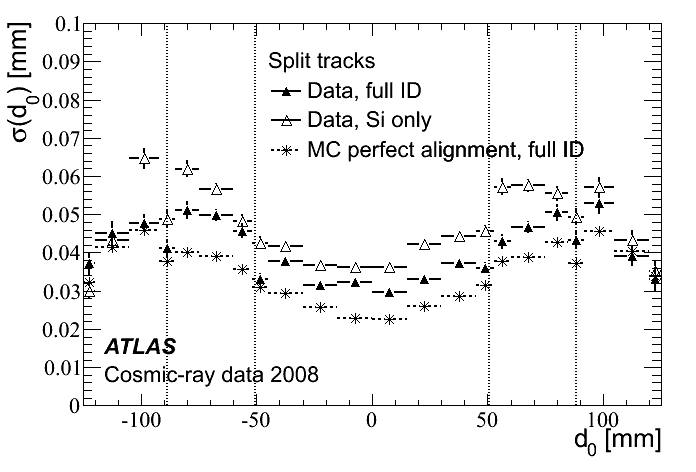 |
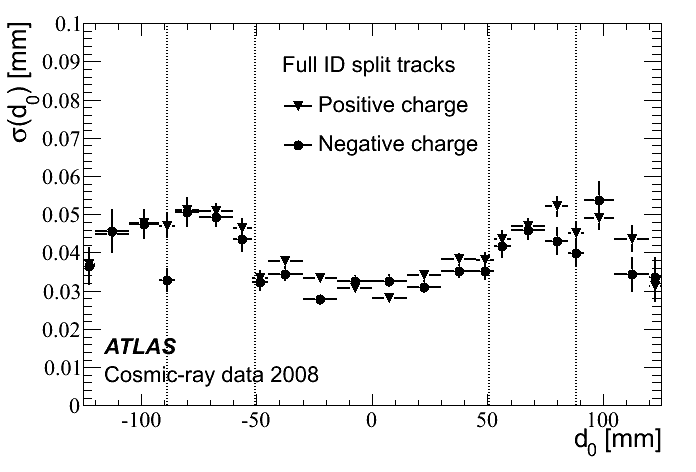 |
Angular resolution
A precise and reliable reconstruction of the track direction contributes to the knowledge of the momentum vector and thus is vital for finding decay vertices and matching with signals from other detectors. A precision on the track angles below 1 mrad is achieved, as shown in Figs. 21 and 22.
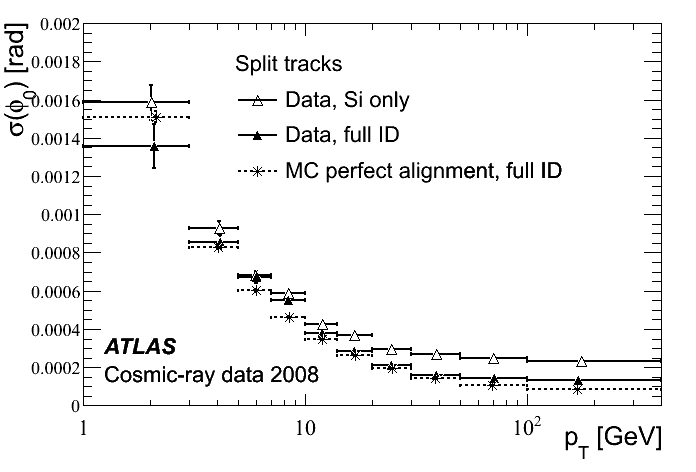 |
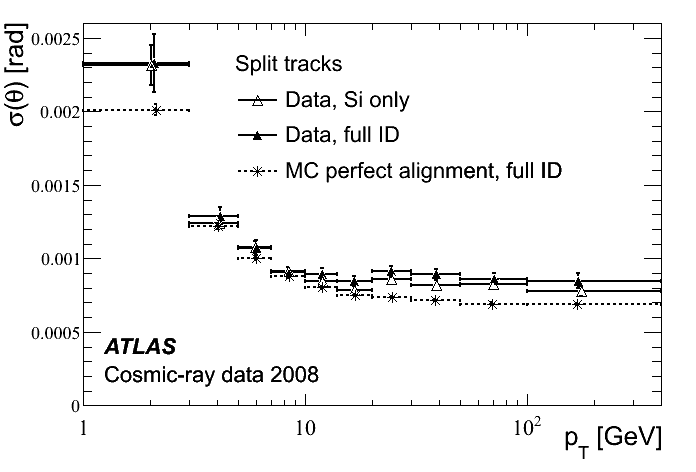 |
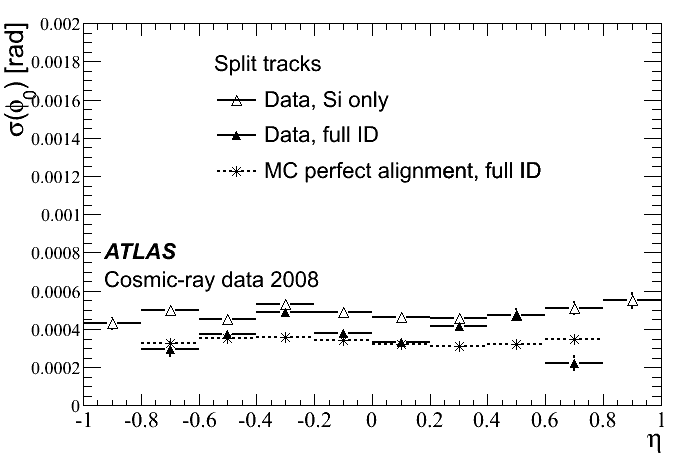 |
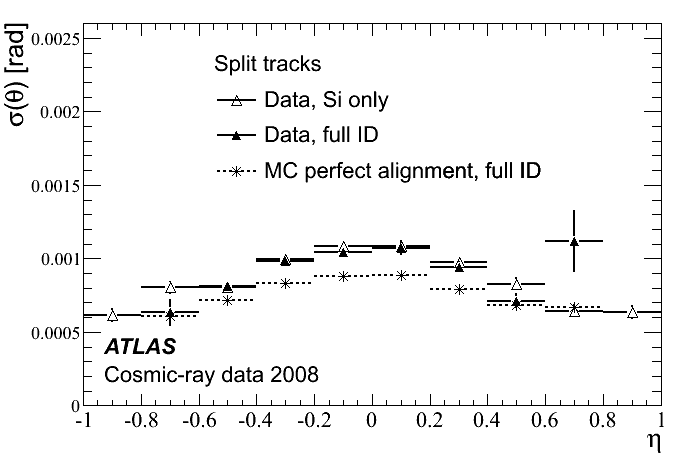 |
The angular resolutions have been found to be independent of other track parameters, except for an expected small worsening at .
Momentum resolution
A precise momentum determination of high-energy particles is a key ingredient for any physics analysis. In Fig. 23 the relative momentum resolution is shown as a function of (left plot) and (right plot). While the resolution is flat in , it shows the expected degradation at higher transverse momenta. In this region, the contribution of the TRT to the momentum resolution becomes clearly visible.
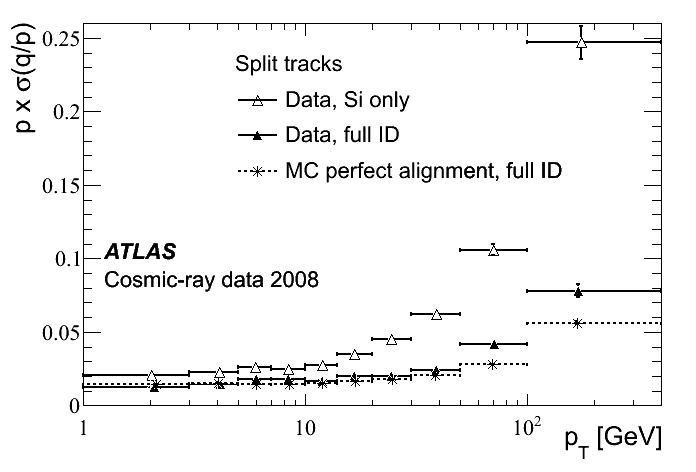 |
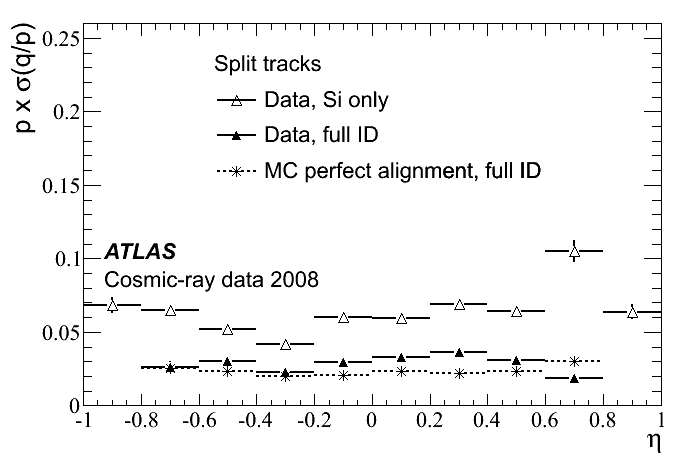 |
| Parameter | Asymptotic resolution | |
|---|---|---|
| Cosmic-ray data 2008 | Monte Carlo | |
| [m] | ||
| [m] | ||
| [mrad] | ||
| [mrad] | ||
| [GeV-1] | ||
7.4 Energy-loss measurement
The average specific energy loss of charged particle d/d is described by the Bethe-Bloch function bib:PDG . The specific energy loss, sensitive to the particle speed , can be combined with the momentum measurement to provide particle identification. Because of the energy loss tails (see Fig. 9) a truncated mean can be used to reduce the variance of the estimation.
Split tracks from cosmic-ray muons have been used to measure the resolution on d/d of the Pixel Detector. Tracks are required to have a transverse momentum GeV and relative momentum resolution . In addition a cut on the distance of closest approach to the beam axis, mm, is made in order to select tracks similar to the ones generated by LHC collisions.
The specific energy loss in a Pixel Detector module is derived from the cluster charge, , taking into account the average energy needed to create an electron-hole pair (Section 5.1) and the path in silicon where is the detector sensitive thickness (250 m):
| (8) |
At high incident angle particles cross several pixel cells; the signal released in some of them may be below threshold and the energy loss underestimated. To reduce this effect, only clusters with and rad are used. The correct association of clusters to the reconstructed track is ensured by requiring position residuals to be less than 300 m in the local coordinate and less than 900 m in local .
Figure 24 shows the most probable dd value of individual clusters in the barrel region as a function of the track momentum. The relativistic rise and its saturation due to the density effect are clearly visible and there is a good agreement between the rise observed in data from 0.5 GeV to 20 GeV in , and the estimated from the simulation. For tracks with at least three clusters, a global dd estimation is made by averaging all the individual measurements after the exclusion of the cluster with the maximum . This procedure has been verified to produce an almost Gaussian estimator on the relativistic plateau, GeV, with a resolution of 15%. This would allow a limited particle identification capability, with a separation between and for MeV.
7.5 Transition radiation measurement
The large spread of momenta of the cosmic rays recorded has allowed a validation of the transition-radiation performance of the TRT by measuring the percentage of high-threshold hits on tracks at different momenta. The probability of producing a transition radiation photon at each material boundary is dependent upon the Lorentz gamma factor of the particle. Since the threshold for producing transition radiation is , in LHC collision events transition radiation is essentially limited to electrons. However, the mean of recorded cosmic-ray muons was 60 GeV with a significant tail to almost 1 TeV (see Fig. 2(a)). The high-momentum muons produce enough transition-radiation photons to allow an initial calibration of the TRT as a transition radiation detector.
The transition radiation study used 20 000 nearly-vertical tracks in the barrel TRT. The tracks were required to have at least four SCT hits and at least 20 TRT hits, a fit / Ndof 10.0, 3.0 and 0.5 1000 GeV. The track angle to the vertical, measured using hits in the SCT, was restricted to be less than . Tracks were assigned to (logarithmic) momentum bins, and the high-threshold hit probability calculated as a simple ratio in each bin.
Figure 25 shows the probability of seeing a high-threshold hit on a muon track in the TRT barrel as a function of the Lorentz gamma factor of the particle; the probability is averaged over positively and negatively charged muons. The fitted curve shown in Fig. 25 is consistent with the result obtained in the 2004 ATLAS combined test beam run and confirms the design of the TRT electron identification capabilities.
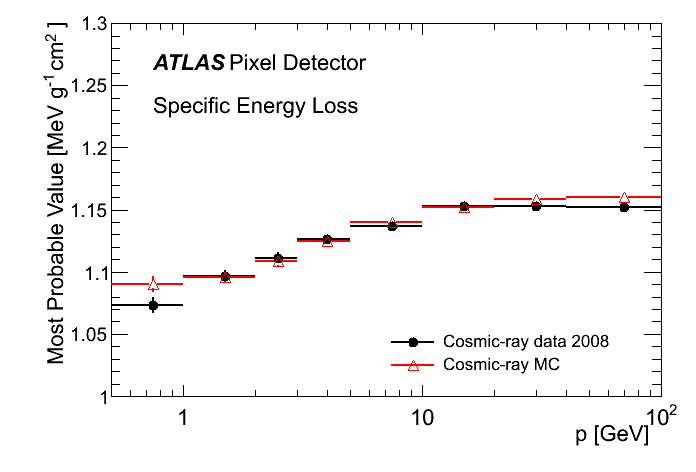
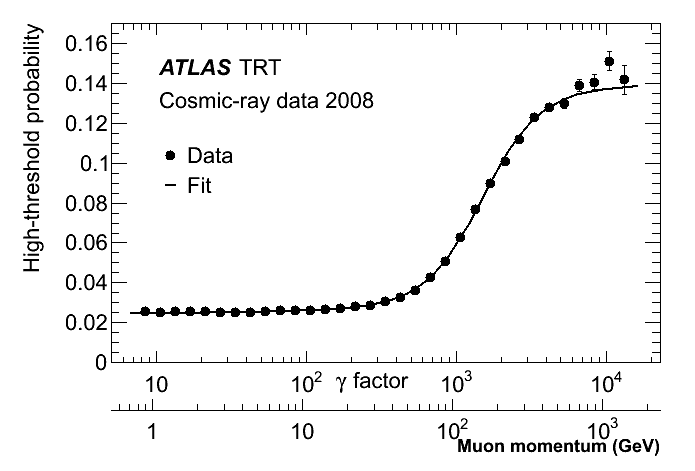
8 Conclusions
The final installation of the ATLAS Inner Detector in August 2008 was followed by a period of commissioning and calibration. During this period the detector took data with high efficiency with both LHC single beams and cosmic rays. These data allowed full tests of trigger, data-acquisition and monitoring systems, and of offline track reconstruction. Some problems with the newly-installed evaporative cooling system and the optical links of the silicon detectors were exposed. These were addressed before data-taking with LHC beams in 2009, when more than 98% of the detector was operational.
Detector gains were calibrated and thresholds adjusted to give good uniformity of response. The components of the detector were timed-in with a precision of 1–2 ns. Many detector performance properties were measured. The average noise occupancies were hit/channel/BC for the Pixel Detector and hit/channel/BC for the SCT, well within specifications. The intrinsic efficiencies of the silicon detectors were measured to be close to 100% and of the TRT to be 97.20.5%. The Lorentz angle in the silicon detectors in the 2 T magnetic field was found to be consistent with model expectations. Energy loss in the Pixel Detector and transition radiation were measured and found to be in agreement with expectations from test beams.
A new Level-1 track trigger based on a fast OR of TRT signals was commissioned. The Level-2 trigger tracking-algorithms were modified for cosmic rays, resulting in a trigger efficiency of 99.60.02% for tracks reconstructed offline. The cosmic-ray data were used to perform an initial detector alignment. The resolution of track parameters was measured by comparing two segments of a cosmic-ray track. After detector alignment, the impact parameter resolutions for high-momentum tracks were found to be m and m in the transverse and longitudinal directions, respectively. In this asymptotic limit, the relative momentum resolution was measured to be .
The observed performance on this early data showed the ATLAS Inner Detector to be fully operational and providing high-quality tracking before the first LHC collisions.
9 Acknowledgements
We are greatly indebted to all CERN’s departments and to the LHC project for their immense efforts not only in building the LHC, but also for their direct contributions to the construction and installation of the ATLAS detector and its infrastructure. We acknowledge equally warmly all our technical colleagues in the collaborating Institutions without whom the ATLAS detector could not have been built. Furthermore we are grateful to all the funding agencies which supported generously the construction and the commissioning of the ATLAS detector and also provided the computing infrastructure.
The ATLAS detector design and construction has taken about fifteen years, and our thoughts are with all our colleagues who sadly could not see its final realisation.
We acknowledge the support of ANPCyT, Argentina; Yerevan Physics Institute, Armenia; ARC and DEST, Australia; Bundesministerium für Wissenschaft und Forschung, Austria; National Academy of Sciences of Azerbaijan; State Committee on Science & Technologies of the Republic of Belarus; CNPq and FINEP, Brazil; NSERC, NRC, and CFI, Canada; CERN; CONICYT, Chile; NSFC, China; COLCIENCIAS, Colombia; Ministry of Education, Youth and Sports of the Czech Republic, Ministry of Industry and Trade of the Czech Republic, and Committee for Collaboration of the Czech Republic with CERN; Danish Natural Science Research Council and the Lundbeck Foundation; European Commission, through the ARTEMIS Research Training Network; IN2P3-CNRS and CEA-DSM/IRFU, France; Georgian Academy of Sciences; BMBF, DFG, HGF and MPG, Germany; Ministry of Education and Religion, through the EPEAEK program PYTHAGORAS II and GSRT, Greece; ISF, MINERVA, GIF, DIP, and Benoziyo Center, Israel; INFN, Italy; MEXT, Japan; CNRST, Morocco; FOM and NWO, Netherlands; The Research Council of Norway; Ministry of Science and Higher Education, Poland; GRICES and FCT, Portugal; Ministry of Education and Research, Romania; Ministry of Education and Science of the Russian Federation and State Atomic Energy Corporation ROSATOM; JINR; Ministry of Science, Serbia; Department of International Science and Technology Cooperation, Ministry of Education of the Slovak Republic; Slovenian Research Agency, Ministry of Higher Education, Science and Technology, Slovenia; Ministerio de Educación y Ciencia, Spain; The Swedish Research Council, The Knut and Alice Wallenberg Foundation, Sweden; State Secretariat for Education and Science, Swiss National Science Foundation, and Cantons of Bern and Geneva, Switzerland; National Science Council, Taiwan; TAEK, Turkey; The Science and Technology Facilities Council and The Leverhulme Trust, United Kingdom; DOE and NSF, United States of America.
References
- (1) G. Aad et al., The ATLAS Experiment at the CERN Large Hadron Collider, JINST 3 (2008) S08003.
- (2) L. Evans and P. Bryant eds., LHC Machine, JINST 3 (2008) S08001.
- (3) G. Aad et al., ATLAS pixel detector electronics and sensors, JINST 3 (2008) P07007.
- (4) I. Peric et al., The FEI3 readout chip for the ATLAS pixel detector, Nucl. Inst. Meth. A 565 (2006) 178–187.
- (5) A. Abdesselam et al., The barrel modules of the ATLAS semiconductor tracker, Nucl. Inst. Meth. A 568 (2006) 642–671.
- (6) A. Abdesselam et al., The ATLAS semiconductor tracker end-cap module, Nucl. Inst. Meth. A 575 (2007) 353–389.
- (7) A. Ahmad et al., The Silicon microstrip sensors of the ATLAS semiconductor tracker, Nucl. Inst. Meth. A 578 (2007) 98–118.
- (8) F. Campabadal et al., Design and performance of the ABCD3TA ASIC for readout of silicon strip detectors in the ATLAS semiconductor tracker, Nucl. Inst. Meth. A 552 (2005) 292–328.
- (9) E. Abat et al., The ATLAS TRT Barrel Detector, JINST 3 (2008) P02014.
- (10) E. Abat et al., The ATLAS TRT end-cap detectors, JINST 3 (2008) P10003.
- (11) E. Abat et al., The ATLAS TRT electronics, JINST 3 (2008) P06007.
- (12) V. Cindro et al., The ATLAS Beam Conditions Monitor, JINST 3 (2008) P02004.
- (13) A. Abdesselam et al., The optical links of the ATLAS SemiConductor tracker, JINST 2 (2007) P09003.
- (14) K. K. Gan et al., Optical Link of the ATLAS Pixel Detector, Nucl. Inst. Meth. A 570 (2007) 292–294.
- (15) P. Moreira et al., G-Link and Gigabit Ethernet compliant serializer for LHC data transmission, IEEE Nuclear Science Symposium 2 (2000) 96–99.
- (16) M.L. Chu et al., The off-detector opto-electronics for the optical links of the ATLAS semiconductor tracker and pixel detector, Nucl. Inst. Meth. A 530 (2004) 293–310.
- (17) P. Lichard et al., Evolution of the TRT backend and the new TRT-TTC board, in Proceedings of the 2005 LECC, Heidelberg, p. 253. CERN-LHCC-2005-038, CERN, Geneva, 2005.
- (18) A. Abdesselam et al., The Data acquisition and calibration system for the ATLAS semiconductor tracker, JINST 3 (2008) P01003.
- (19) D. Attree et al., The evaporative cooling system for the ATLAS inner detector, JINST 3 (2008) P07003.
- (20) A. Barriuso Poy et al., The detector control system of the ATLAS experiment, JINST 3 (2008) P05006.
- (21) M. White, Data Quality Monitor for the ATLAS Inner Detector, in International Workshop on Vertex detectors. Proceedings of Science, 2008. PoS (Vertex 2008) 044.
- (22) ATLAS Collaboration, The Athena Framework, in ATLAS Computing Technical Design Report, p. 27. CERN-LHCC-2005-022, CERN, Geneva, 2005.
- (23) T. Cornelissen et al., Concepts, Design and Implementation of the ATLAS New Tracking (NEWT), ATLAS Note ATL-SOFT-PUB-2007-007.
- (24) T. Cornelissen et al., The global track fitter in ATLAS, J. Phys.: Conf. Ser. 119 (2008) 032013.
- (25) A. Fratina et al., The TRT Fast-OR Trigger, ATLAS Note ATL-INDET-PUB-2009-002.
- (26) G. Aad et al., HLT Track Reconstruction Performance, in Expected performance of the ATLAS experiment : detector, trigger and physics, p. 565. CERN-OPEN-2008-020, CERN, Geneva, 2009.
- (27) A. Dar, Atm. Neutrinos, Astrophysical Neutrons, and Proton-Decay Experiments, Phys. Rev. Lett. 51 (1983) 227.
- (28) C. Amsler et al., The review of particle physics, Phys. Lett. B 667 (2008) 1.
- (29) S. Agostinelli et al., Geant4 – a simulation Toolkit, Nucl. Inst. Meth. A 506 (2003) 250–303.
- (30) J. Allison et al., Geant4 developments and applications, IEEE Trans. Nucl. Sci. Vol. 53, Issue 1 (2006) 270–278.
- (31) Atlas Collaboration, Commissioning of the ATLAS Pixel Detector, to be submitted to Eur. Phys. J. C .
- (32) K. E. Arms et al., ATLAS pixel opto-electronics, Nucl. Inst. Meth. A 554 (2005) 458–468.
- (33) M. S. Alam et al., The ATLAS silicon pixel sensors, Nucl. Inst. Meth. A 456 (2001) 217–232.
- (34) H. Bichsel, Straggling in thin silicon detectors, Rev. Mod. Phys. 60 (1988) 663–669.
- (35) R. D. Ryan, Precision Measurements of the Ionization Energy and Its Temperature Variation in High Purity Silicon Radiation Detectors, IEEE Trans. Nucl. Sci. Vol. 20, Issue 1 (1973) 473–480.
- (36) P. Christmas, Average Energy Required to Produce an Ion Pair, Tech. Rep. Report 31, ICRU, 1979.
- (37) R.H. Pehl et al., Accurate determination of the ionization energy in semiconductor devices, Nucl. Inst. Meth. 59 (1968) 45–55.
- (38) F. Scholze et al., Determination of the electron-hole pair creation energy for semiconductors from the spectral responsivity of photodiodes, Nucl. Inst. Meth. A 439 (2000) 208–215.
- (39) I. Gorelov et al., A measurement of Lorentz angle and spatial resolution of radiation hard silicon pixel sensors, Nucl. Inst. Meth. A 481 (2002) 204–221.
- (40) ATLAS Collaboration, Alignment requirements, in ATLAS Inner Detector Technical Design Report, vol. I, p. 215. CERN-LHCC-1997-016, CERN, Geneva, 1997.
- (41) P. Brükman, A. Hicheur and S.J. Haywood, Global approach to the Alignment of the ATLAS Silicon Tracking Detectors, ATLAS Note ATL-INDET-PUB-2005-002.
- (42) R. Härtel, Iterative local alignment approach for the ATLAS SCT detector, Master’s thesis, MPI Munich, 2005.
- (43) T. Göttfert, Iterative local alignment algorithm for the ATLAS Pixel detector, Master’s thesis, Universität Würzburg and MPI Munich, 2006.
- (44) F. Heinemann, Track Based Alignment of the ATLAS Silicon Detectors with the Robust Alignment Algorithm, ATLAS Note ATL-INDET-PUB-2007-011.
- (45) A. Andreazza, V. Kostyukhin and R.J. Madaras, Survey of the ATLAS Pixel Detector Components, ATLAS Note ATL-INDET-PUB-2008-012.
- (46) C. Jacoboni et al., A review of some charge transport properties of silicon, Solid State Electronics 20 (1977) 77–89.
- (47) F. Campabadal et al., Beam Tests of ATLAS SCT Silicon Strip Detector Modules, Nucl. Inst. Meth. A 538 (2005) 384–407.