The Evolution of the Kinematics of Nebular Shells in
Planetary Nebulae in the Milky Way Bulge111The observations reported herein were acquired at the Observatorio Astronómico Nacional in the Sierra San Pedro Mártir (OAN-SPM), B. C., Mexico.
Abstract
We study the line widths in the [O III]5007 and H lines for two groups of planetary nebulae in the Milky Way bulge based upon spectroscopy obtained at the Observatorio Astronómico Nacional in the Sierra San Pedro Mártir (OAN-SPM) using the Manchester Echelle Spectrograph. The first sample includes objects early in their evolution, having high H luminosities, but [O III]. The second sample comprises objects late in their evolution, with He II . These planetary nebulae represent evolutionary phases preceeding and following those of the objects studied by Richer et al. (2008). Our sample of planetary nebulae with weak [O III]5007 has a line width distribution similar to that of the expansion velocities of the envelopes of AGB stars, and shifted to systematically lower values as compared to the less evolved objects studied by Richer et al. (2008). The sample with strong He II has a line width distribution indistinguishable from that of the more evolved objects from Richer et al. (2008), but a distribution in angular size that is systematically larger and so they are clearly more evolved. These data and those of Richer et al. (2008) form a homogeneous sample from a single Galactic population of planetary nebulae, from the earliest evolutionary stages until the cessation of nuclear burning in the central star. They confirm the long-standing predictions of hydrodynamical models of planetary nebulae, where the kinematics of the nebular shell are driven by the evolution of the central star.
1 Introduction
Hydrodynamical models of planetary nebulae have long predicted a particular kinematic evolution for the nebular shells, driven primarily by the evolution of the central stars (e.g., Kwok et al., 1978; Kahn & West, 1985; Schmidt-Voigt & Köppen, 1987a, b; Breitschwerdt & Kahn, 1990; Kahn & Breitschwerdt, 1990; Marten & Schönberner, 1991; Mellema, 1994; Villaver et al., 2002; Perinotto et al., 2004; Schönberner et al., 2007). Initially, the central stars are cool and their winds relatively slow. This wind interacts with the wind that the precursor asymptotic giant branch (AGB) star emitted in a momentum-conserving mode (Kwok, 1982). However, the central star’s temperature and wind velocity increase rapidly, with the consequences that an ionization front is driven through the AGB envelope and the interaction between the two winds switches to an energy driven mode, and a hot bubble is created behind the shocked wind. The ionization front first accelerates the AGB envelope, now seen as the rim of the planetary nebula. In time, once the internal pressure of the hot bubble exceeds that of the nebular shell, it further accelerates the nebular shell. Theoretically, the latest phases of evolution are less clear, though the central star will cease nuclear energy generation, fade rapidly, and emit an ever-weaker wind, in principle allowing the inner part of the nebular envelope to backfill into the central cavity (e.g., García-Segura et al., 2006).
Although the many extant observations of the kinematics of planetary nebulae all show expansion of the nebular shell, there are few systematic observations of how these shells acquire their motion and how it evolves with time. Dopita et al. (1985, 1988) were the first to provide observational support for the early acceleration of the nebular shell from studies of planetary nebulae in the Magellanic Clouds. Studies of Milky Way planetary nebulae provided much less convincing results (e.g., Chu et al., 1984; Heap, 1993; Medina et al., 2006). Recently, Richer et al. (2008) demonstrated the acceleration of nebular shells in bright planetary nebulae in the Milky Way bulge during the early evolution of their central stars and were able to associate the acceleration seen in different evolutionary stages with the phases of acceleration expected from theoretical models.
Here, we undertake a study that complements Richer et al. (2008), selecting objects earlier and later in their evolution than they did. The addition of these objects allows us to study the evolution of the kinematics of the nebular shell from the earliest stages of the planetary nebula phase until the cessation of nuclear burning in the central stars. In section 2, we present our new data and their analysis. In section 3, our results and their implications are outlined, the principal ones being the similarity of the line widths in H and [O III] , that our sample of least evolved objects has a line width distribution shifted to the lowest values while the sample of most evolved objects has a size distribution with the largest sizes, and that the evolutionary state correlates with the H luminosity. In section 4 we summarize our conclusions.
2 Observations and Analysis
2.1 The Planetary Nebula Sample
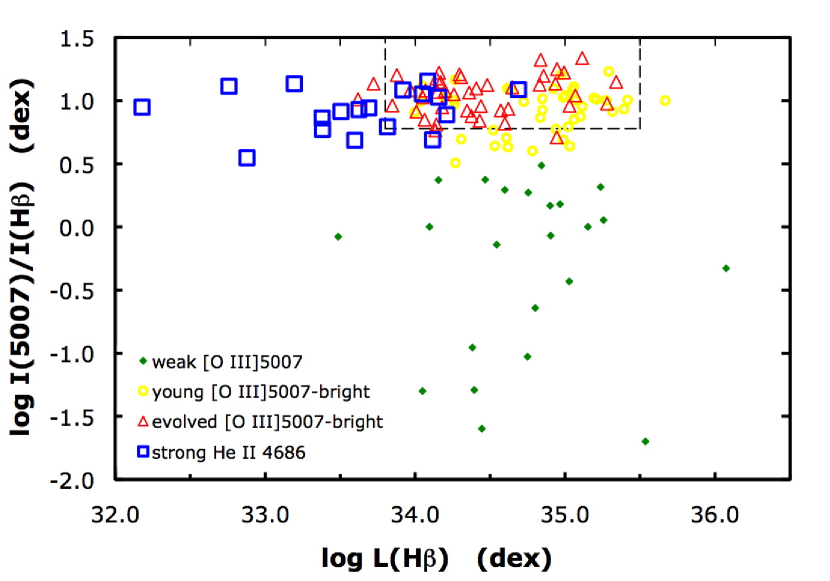
Table 1 lists our two new samples of Bulge planetary nebulae. There are 24 objects in the sample with low [O III] ratios, all drawn from existing spectroscopic surveys (Aller & Keyes, 1987; Webster, 1988; Cuisinier et al., 1996, 2000; Ratag et al., 1997; Escudero & Costa, 2001; Escudero et al., 2004; Exter et al., 2004; Górny et al., 2004). There are 21 objects in the sample with strong He II 4686, only some of which have extensive spectroscopy (see the previous references). Many of these objects were selected on the basis of the He II 4686 line intensity from Tylenda et al. (1994). Figure 1 explains the logic of the selection criteria for the two samples.
The sample with weak [O III] comprises objects entirely excluded from Richer et al. (2008) and its selection were (i) a position within of the galactic centre, (ii) a large observed, reddening-corrected H flux, nominally dex, and (iii) an intensity ratio [O III]. Since even the less evolved objects from Richer et al. (2008) show the effects of acceleration of the nebular shell due to the passage of the ionization front, our last criterion should select objects that are significantly less evolved and thus probe the nebular kinematics at a stage that most closely reflects the kinematics of the undisturbed AGB envelope. The weak [O III] sample should include bright, young planetary nebulae whose central stars are still relatively cool. All of the central stars should be on the horizontal part of their post-AGB evolutionary track.
The selection criteria for the “strong He II ” sample were (i) a position within of the galactic centre and (ii) an intensity ratio He II . There was no restriction on the H flux. The second criterion should select a sample of objects biased to more advanced evolutionary phases than the more evolved objects included in Richer et al. (2008), since their requirement for their more evolved objects was equivalent to a ratio He II . This sample should include planetary nebulae whose central stars are at or slightly before their maximum temperature or fading towards the white dwarf cooling track.
2.2 Observations, Data Reduction, and Derived Parameters
We acquired the observations reported here and measured the derived properties in a very similar fashion to our previous observations (Richer et al., 2008). More details of our analysis may be found in Richer et al. (2008, 2009).
We obtained high resolution spectra with the Manchester echelle spectrometer (MES-SPM; Meaburn et al., 1984, 2003) on 2008 June 1-2 and 10-17 and 2008 September 1-11 at the Observatorio Astronómico Nacional in the Sierra San Pedro Mártir, Baja California, Mexico (OAN-SPM). A 150 m wide slit ( wide on the sky, long) yielded a spectral resolution equivalent to 11 km/s (2.6 pix FWHM) and a spatial sampling of 06/pixel when coupled to a SITe CCD with 24 m pixels binned . We used a ThAr lamp for the wavelength calibration, which typically yielded an internal precision better than km/s.
We usually obtained a single deep spectrum in each of the [O III] and H filters of, at most, 30 minutes duration. When possible, the exposure time for the H and [O III] spectra were chosen to achieve similar signal levels. The slit was oriented north-south and, except for M 2-38, centered on the object. All of the planetary nebulae we observed are resolved (see Table 1).
The spectra were reduced using the twodspec and specred packages of the Image Reduction and Analysis Facility222IRAF is distributed by the National Optical Astronomical Observatories, which is operated by the Associated Universities for Research in Astronomy, Inc., under contract to the National Science Foundation. (IRAF), following Massey et al. (1992, Appendix B). We edited the spectra to remove cosmic rays and subtracted a nightly mean bias image. We rectified the object spectra and calibrated them in wavelength using the ThAr spectra. Finally, wavelength-calibrated, one-dimensional spectra were extracted for each object. No flux calibration was performed.
The single exception to the foregoing was M 2-38, for which two 30 minute H spectra were obtained at different positions. The two spectra were reduced as described above and the final one-dimensional spectra were summed to produce the final H spectrum.
We analyzed the one-dimensional spectra using a locally-implemented software package (INTENS; McCall et al, 1985). INTENS models the emission line with a sampled gaussian function and models the continuum as a straight line. For the strong He II sample, the H line was usually accompanied by the He II 6560 line. In these cases, a fit was made simultaneously to both lines and the continuum, assuming that both lines had the same width.
Table 1 presents the observed line widths (FWHM; full width at half the maximum intensity) for each object in both H and [O III] . The formal uncertainties from fitting a Gaussian function with INTENS (one sigma; Table 1) increase as the line width increases, a result of the line shape departing more from the Gaussian form at larger line widths (Richer et al., 2009). To obtain an idea of the real uncertainties, we measured the FWHM of the H line profiles directly (using implot/IRAF). For Å, there is no systematic difference between the line width and the Gaussian fit, though there is a dispersion of approximately of the line width. For larger line widths, the Gaussian fit systematically underestimates the line width, with the difference reaching of the line width at Å.
We derive the true, intrinsic profile (), resulting from the kinematics of the planetary nebula, by correcting the observed profile () for instrumental (), thermal (), and fine structure () broadening,
| (1) |
We adopted an instrumental profile of FWHM of 2.6 pixels (measured: 2.5-2.7 pixels) for all objects. We use the usual formula (Lang, 1980, eq. 2-243) to compute the thermal broadening, adopting rest wavelengths of 6562.83Å and 5006.85Å for H and [O III] , respectively, assuming no turbulent velocity, and adopting the observed electron temperature, when available (preferably from [O III] lines, but [N II] otherwise). If no electron temperature was available, we used the mean temperature for the other objects in each sample (weak [O III] or high He II 4686). For the fine structure broadening (Meaburn, 1970), we adopted km/s for H and zero for [O III] (García-Díaz et al., 2008a).
For real, spatially-resolved objects, the resulting line width, ,
| (2) |
will be a luminosity-weighted, projected velocity width for the mass of the zone containing the emitting ion (O2+ or H+) enclosed within the spectrograph slit. We adopt half of this intrinsic line width in velocity units
| (3) |
as our measure of the kinematics for each object.
We obtain angular diameters (see Table 1) by collapsing the spectra along the wavelength axis to produce one-dimensional H spatial profiles, and then measured the diameter at 10% of the peak intensity (Richer et al., 2008). The uncertainty in the diameters is less than half a pixel (03) for the sample with weak [O III]5007 and no more than a full pixel (06) for the sample with strong He II 4686 (the H profiles contained at least 320,000 and 71,000 photons, respectively).
3 Results and Discussion
We separate the Bulge planetary nebulae studied here and by Richer et al. (2008) into four evolutionary groups based upon the properties of the central star. The sample with weak [O III] presented here has central stars whose temperatures are sufficiently low that only low ionization ions exist and so should be the least evolved. Then follow the younger [O III] -bright objects from Richer et al. (2008, He II absent), with central stars that are hot enough to ionize O+, but not O2+ or He+. The central stars in both groups should be on the horizontal portion of their post-AGB evolutionary track in the H-R diagram. The evolved [O III] -bright objects from Richer et al. (2008, He II present) and our sample with strong He II have the hottest, most evolved central stars, with He2+ present to differing degrees. While we expect some overlap between the two groups, the strong He II should be biased to later evolutionary stages (§2.1). These hotter central stars, particularly those with strong He II , may have extinguished nuclear reactions and be fading towards the white dwarf domain.
Had we assigned our planetary nebulae excitation classes instead of defining our four groups (e.g., Aller, 1956; Gurzadyan, 1988; Dopita & Meatheringham, 1990; Reid & Parker, 2010), there would be little difference in practice. Our weak [O III] , young and evolved [O III] -bright, and strong He II groups correspond to very low, low-to-medium, medium-to-high, and high excitation classes, respectively. Thus, our separation into evolutionary groups should be adequate for our purposes.
3.1 H and [O III]5007 line widths
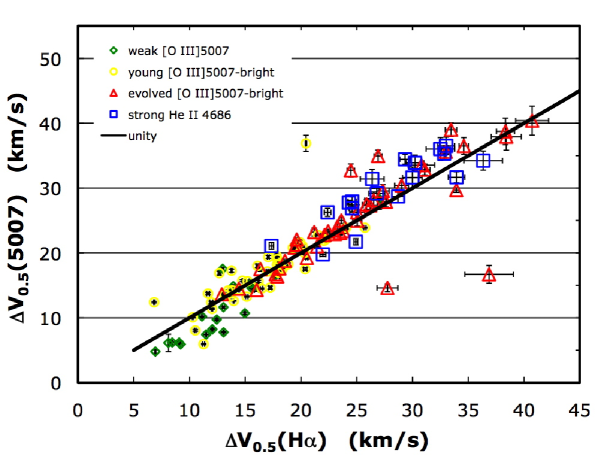
We present the relation between the line widths () in [O III]5007 and H in Fig. 6. As has been found previously for bright Bulge planetary nebulae, there is a near equality between these line widths (Richer et al., 2009, 2010). The weak [O III] data set extends this relation to smaller line widths while the sample with strong He II is well-mixed with previous data.
The tendency of finding systematically smaller line widths in [O III]5007 at the smallest H line widths in Fig. 6 may be due to ionization stratification (e.g., Wilson, 1950). Hydrodynamical models clearly predict that the innermost parts of the ionized shell expand more slowly than the majority of the matter during the earliest phases of a planetary nebula’s evolution (Villaver et al., 2002; Perinotto et al., 2004) since the central star’s wind is not fast enough to create a hot bubble.
The other feature in Fig. 6 is the kink near H line widths of about 33 km/s. The objects that lie at higher velocities than the kink all have hot, evolved central stars. Presumably, the kink results from a drop in the projected outflow velocity in [O III]5007, since that would seem energetically more feasible near the time when the central star is running out of nuclear energy. Might the kink be the result of the loss of pressure from the central star’s wind after nuclear reactions cease (collapse of the hot bubble; e.g., García-Segura et al., 2006; García-Díaz et al., 2008b)? Alternatively, the kink might also be produced via the passage of a He II ionization front (Figs. 3 and 5, Schönberner et al., 2005a). Hydrodynamical models do not clearly predict this behavior (Villaver et al., 2002; Perinotto et al., 2004; Schönberner et al., 2005a, 2007). More observations and detailed modeling of individual objects will be required to understand the origin of the kink.
3.2 Evolution of the Nebular Kinematics
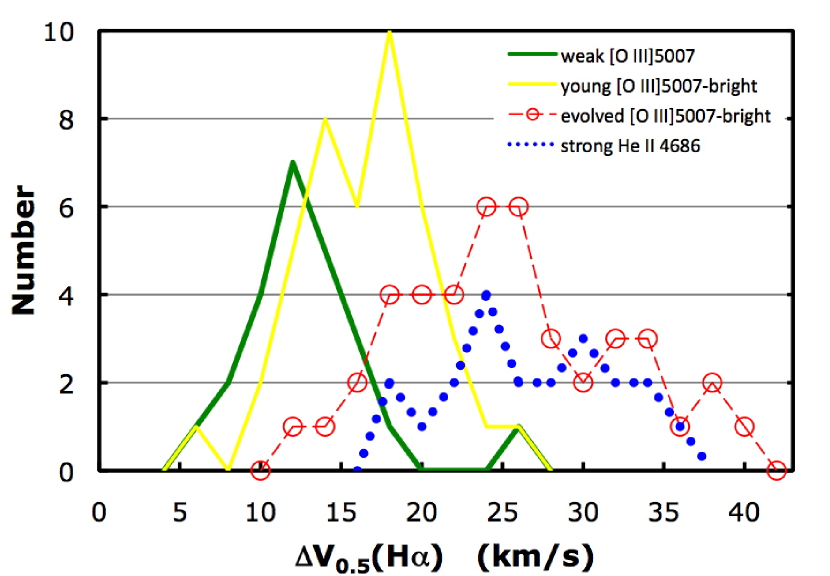
Fig. 7 presents the line width distributions for the four groups of Bulge planetary nebulae. The sample with weak [O III] clearly differentiates itself from the young [O III] -bright objects, which is the evolutionary phase following it. On the other hand, there is no noticeable difference between the kinematics of the evolved [O III] -bright objects and those with strong He II .
Statistical tests bear out these visual impressions. The non-parametric U-test (e.g., Wall & Jenkins, 2003, §5.4.3) indicates that the probability of obtaining the line width distributions for the objects with weak [O III] and the young [O III] -bright objects from the same parent distribution is only when M3-13 is included (the highest line width in the weak [O III] sample) or if it is excluded. Thus, the line width distributions for these two samples of objects are clearly different statistically. Not surprisingly, there is no statistical evidence for any difference in the line width distributions for the evolved [O III] -bright objects and those with strong He II .
The line width distribution for the sample with weak [O III] (Fig. 7) is very similar to the distribution of envelope expansion velocities in AGB stars (Lewis, 1991; Ramstedt et al., 2006). This is exactly what hydrodynamical models suggest for the earliest stages of evolution of the nebular shell before the central star’s wind has created a hot bubble (Villaver et al., 2002; Perinotto et al., 2004; Schönberner et al., 2005a, 2007). Thus, this group of objects contains planetary nebulae whose nebular shells have not yet been significantly accelerated by the passage of the ionization front and stellar winds. Richer et al. (2008) have already argued that the young and evolved samples of [O III] -bright objects have the line width distributions expected from hydrodynamical models if they correspond, respectively, to the phase when a well-developed ionization front has swept through the nebular shell and the phase when the hot bubble is actively accelerating the nebular shell.
The line width distributions for the two groups of most evolved planetary nebulae are indistinguishable. This implies that most of the nebular mass is not dramatically decelerated as the central star’s luminosity decreases near the extinction of nuclear reactions, but continues expanding in a momentum-conserving mode.
3.3 Nebular diameters
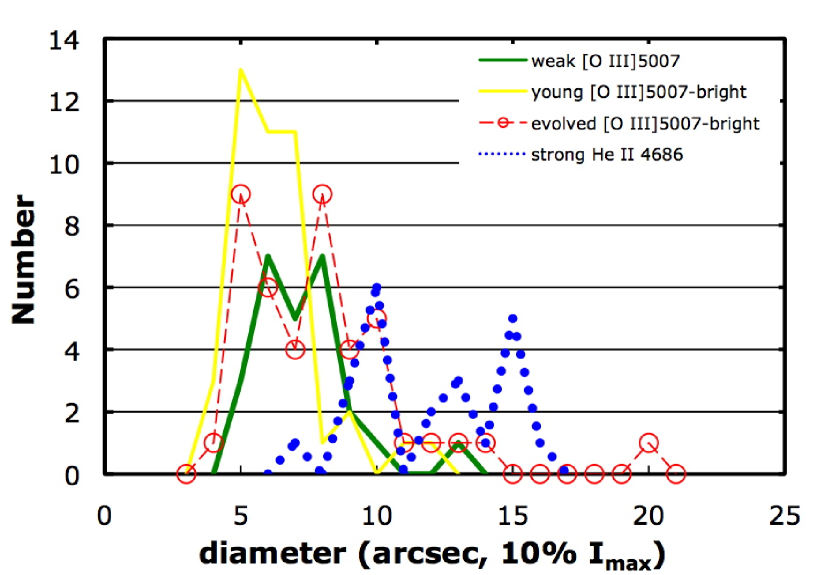
Fig. 8 presents the distributions of angular diameters for the weak [O III] and strong He II samples as well as those studied by Richer et al. (2008). Although the sample with weak [O III] are the least evolved, it does not have the smallest size distribution. Its distribution of angular diameters is statistically different from that for the young [O III] -bright objects, with the U-test indicating a probability of only of drawing the two distributions from the same parent distribution.
On the other hand, the distribution of diameters for the strong He II sample is clearly shifted to larger sizes compared to that for the evolved [O III] -bright objects. The U-test indicates that the probability of drawing the two distributions from the same parent population is . Assuming that the two groups are at the same distance, the difference in the distributions of angular sizes also argues that the objects with He II are the most evolved.
Hydrodynamical models might help explain these results. Models predict maximum H luminosities when the [O III]5007 emission is strong (e.g., Schönberner et al., 2007). Our requirement that the weak [O III]5007 objects have high luminosity could cause us to preferentially select objects closer than the Bulge, which would make them appear larger. Also, models predict important structural changes during the early evolution, depending upon the relative importance of the ionization front and hot bubble (e.g., Perinotto et al., 2004) that could affect the sizes we measure. Whatever the reason, a lack of a strong correlation between nebular diameter and evolutionary indicators have been obtained before (Chu et al., 1984; Gurzadyan, 1997).
3.4 H luminosities
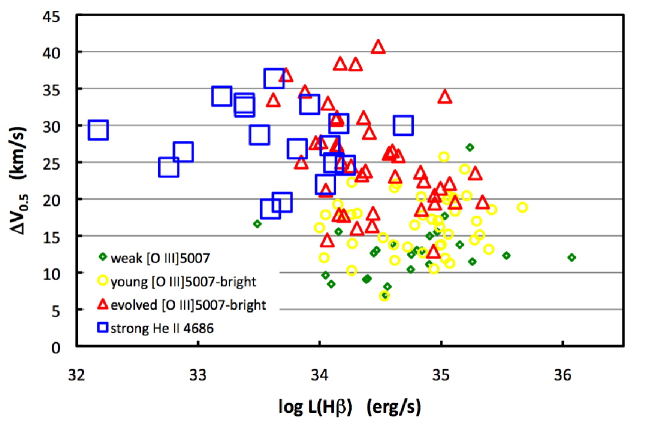
In Fig. 9, we plot the line width as a function of H luminosity for the four planetary nebula samples. Although the H luminosities are not very accurate (Richer et al., 2008), there is a very clear progression as a function of evolutionary state, from the weak [O III] sample, with the smallest line widths and high luminosities, through the young and evolved [O III] -bright objects to the strong He II sample, which has large line widths and the faintest luminosities.
The mixing of objects from the different samples in Figs. 1 and 6-9 is undoubtedly due to the different effects that can affect the expansion of the nebular shell. Although the range in masses of the progenitor stars is likely relatively small, given their ages, the range in metallicity is substantially larger (e.g., Sahu et al., 2006; Zoccali et al., 2008). At lower metallicity the envelope expansion velocities for AGB stars are also lower (e.g., Wood et al., 1992; Marshall et al., 2004; Mattsson et al., 2008; Wachter et al., 2008; Groenewegen et al., 2009). On the other hand, hydrodynamical models find larger accelerations of the nebular shell at lower metallicity due to the higher electron temperature (Schönberner et al., 2005b). The progenitor mass should affect the nebular kinematics primarily via the central star mass and its strong influence upon the wind output and evolutionary time scale (e.g., Villaver et al., 2002; Perinotto et al., 2004). Considering that the nebular shells are not likely to always be spherical, projection effects will further affect the measured line widths. Thus, the dispersion seen in Figs. 1 and 6-9 would seem plausible from natural causes.
4 Conclusions
We have obtained kinematic data for two samples of planetary nebulae in the Milky Way bulge, selected so as to include objects very early and late in their evolution (§2.1). We measure line widths for H and [O III] in most cases. We combine these data sets with that studied by Richer et al. (2008). We define four evolutionary groups, based upon the temperature of the central star, which allow us to study the kinematics of the nebular shell from the earliest phases until the central star ceases nuclear burning.
Generally, we find a near equality of the line widths for the H and [O III] lines in any given object. Ionization stratification likely accounts for the deviations: The [O III] line widths are systematically smaller than the H line widths for the smallest and largest H line widths, corresponding to the earliest and latest evolutionary phases, respectively.
We see clear evolution of the kinematics of the nebular shell. The least evolved objects, our planetary nebulae with weak [O III] , have cool central stars and the nebular envelopes have a line width distribution similar to that of the envelope expansion velocities of AGB stars, indicating that the ionization front has not yet been able to substantially accelerate the nebular shell. In subsequent phases (Richer et al., 2008), the nebular shell is first accelerated by the passage of an ionization front and then further accelerated once the central star’s wind produces a hot bubble. The line width distributions for the planetary nebulae in these three evolutionary phases are statistically distinct. The most evolved objects, with high He II ratios, have a similar line width distribution to evolved [O III] -bright objects, suggesting that no further acceleration occurs as the central stars reach their highest temperatures, their nuclear reactions cease, and their winds decline.
This kinematic evolution of the nebular shell has long been predicted by hydrodynamical models (e.g., Kahn & West, 1985; Marten & Schönberner, 1991; Mellema, 1994; Villaver et al., 2002; Perinotto et al., 2004). Our results, together with those of Richer et al. (2008), based upon a large sample of Galactic planetary nebulae from a single stellar population, clearly confirm these predictions. At least until the point at which nuclear reactions cease in the central stars, their ionizing fluxes and winds continuously accelerate the nebular envelopes. What happens thereafter is not yet completely clear, and would require samples of planetary nebulae chosen specifically to contain hot central stars of low luminosity.
References
- Aller (1956) Aller, L. H. 1956, Gaseous Nebulae (Wiley: New York)
- Aller & Keyes (1987) Aller, L. H., & Keyes, C. D. 1987, ApJS, 65, 405
- Breitschwerdt & Kahn (1990) Breitschwerdt, D., & Kahn, F. D. 1990, MNRAS, 244, 521
- Chu et al. (1984) Chu, Y.-H., Kwitter, K. B., Kaler, J. B., & Jacoby, G. H. 1984, PASP, 96, 598
- Cuisinier et al. (1996) Cuisinier, F., Acker, A., & Köppen, J. 1996, A&A, 307, 215
- Cuisinier et al. (2000) Cuisinier, F., Maciel, W. J., Köppen, J., Acker, A., & Stenholm, B. 2000, A&A, 353, 543
- Dopita et al. (1985) Dopita, M. A., Ford, H. C., Lawrence, C. J., & Webster, B. L. 1985, ApJ, 296, 390
- Dopita & Meatheringham (1990) Dopita, M. A., & Meatheringham, S. J. 1990, ApJ, 357, 140
- Dopita et al. (1988) Dopita, M. A., Meatheringham, S. J., Webster, B. L., & Ford, H. C. 1988, ApJ, 327, 639
- Dudziak et al. (2000) Dudziak, G., Péquignot, D., Zijlstraa, A. A., & Walsh, J. R. 2000, A&A, 363, 717
- Escudero & Costa (2001) Escudero, A. V., & Costa, R. D. D. 2001, A&A, 380, 300
- Escudero et al. (2004) Escudero, A. V., Costa, R. D. D., & Maciel, W. J. 2004, A&A, 414, 211
- Exter et al. (2004) Exter, K. M., Barlow, M. J., & Walton, N. A. 2004, MNRAS, 349, 1291
- García-Díaz et al. (2008a) García-Díaz, Ma. T., Henney, W. J., López, J. A., & Doi, T. 2008a, Rev. Mexicana Astron. Astrofis., 44, 181
- García-Díaz et al. (2008b) García-Díaz, Ma. T., López, J. A., García-Segura, G., Richer, M. G., & Steffen, W. 2008b, ApJ, 676, 402
- García-Segura et al. (2006) García-Segura, G., López, J. A., Steffen, W., Meaburn, J., & Manchado, A. 2006, ApJ, 646, 61
- Gonçalves et al. (2007) Gonçalves, D. R., Magrini, L., Leisy, P., & Corradi, R. L. M. 2007, MNRAS, 375, 715
- Górny et al. (2004) Górny, S. K., Stasińska, G., Escudero, A. V., & Costa, R. D. D. 2004, A&A, 427, 231
- Groenewegen et al. (2009) Groenewegen, M. A. T., Sloan, G. C., Soszyńsky, I., & Petersen, E. A. 2009, A&A, accepted; also http://xxx.lanl.gov/abs/0908.3087
- Gurzadyan (1988) Gurzadyan, G. A. 1988, ApSS, 149, 343
- Gurzadyan (1997) Gurzadyan, G. A. 1997, The Physics and Dynamics of Planetary Nebulae (Springer-Verlag: Berlin)
- Heap (1993) Heap, S. R., in IAU Symp. 155: Planetary Nebulae, eds. R. Weinberger & A. Acker (Reidel Publishing: Dordrecht: the Netherlands), 23
- Jacoby & Ciardullo (1999) Jacoby, G. H., & Ciardullo, R. 1999, ApJ, 515, 169
- Kahn & West (1985) Kahn, F. D., & West, K. A. 1985, MNRAS, 212, 837
- Kahn & Breitschwerdt (1990) Kahn, F. D., & Breitschwerdt, D. 1990, MNRAS, 242, 505
- Kwok (1982) Kwok, S. 1982, ApJ, 258,280
- Kwok et al. (1978) Kwok, S., Purton, C. R., & Fitzgerald, P. M. 1978, ApJ, 219, 125
- Lang (1980) Lang, K. R. 1980, Astrophysical Formulae (Springer-Verlag: Berlin, Heidelberg)
- Lewis (1991) Lewis, B. M. 1991, AJ, 101, 254
- Marshall et al. (2004) Marshall, J. R., van Loon, J. Th., Matsuura, M., Wood, P. R., Zijlstra, A. A., & Whitelock, P. A. 2004, MNRAS, 355, 1348
- Marten & Schönberner (1991) Marten, H., & Schönberner, D. 1991, A&A, 248, 590
- Massey et al. (1992) Massey, P., Valdes, F., & Barnes, J. 1992, A User’s Guide to Reducing Slit Spectra with IRAF, IRAF User Guide, Vol. 2B (Tucson: National Optical Astronomy Observatory)
- Mattsson et al. (2008) Mattsson, L., Wahlin, R., Höfner, S., & Eriksson, K. 2008, A&A, 484, L5
- McCall et al (1985) McCall, M. L., Rybski, P. M., & Shields, G. A. 1985, ApJS, 57, 1
- Meaburn (1970) Meaburn, J. 1970, Nature, 228, 44
- Meaburn et al. (1984) Meaburn, J., Blundell, B., Carling, R., Gregory, D. F., Keir, D., & Wynne, C. G. 1984, MNRAS, 210, 463
- Meaburn et al. (2003) Meaburn, J., López, J. A., Gutiérrez, L., Quiroz, F., Murillo, J. M., Valdéz, J., & Pedrayes, M. 2003, Rev. Mexicana Astron. Astrofis., 39, 185
- Medina et al. (2006) Medina, S., Peña, M., Morisset, C., & Stasińska, G. 2006, Rev. Mexicana Astron. Astrofis., 42, 53
- Mellema (1994) Mellema, G. 1994, A&A, 290, 915
- Méndez et al. (2005) Méndez, R. H., Thomas, D., Saglia, R. P., Maraston, C., Kudritski, R. P., & Bender, R. 2005, ApJ, 627, 767
- Perinotto et al. (2004) Perinotto, M., Schönberner, D., Steffen, M., & Calonaci, C. 2004, A&A, 414, 993
- Ramstedt et al. (2006) Ramstedt, S., Schöier, F. L., Olofsson, H., & Lundgren, A. A. 2006, A&A, 454, L103
- Ratag et al. (1997) Ratag, M. A., Pottasch, S. R., Dennefeld, M., & Menzies, J. 1997, A&AS, 126, 297
- Reid & Parker (2010) Reid, W. A., & Parker, Q. A. 2010, PASA, in press; also http://xxx.lanl.gov/abs/0911.3689
- Richer et al. (2009) Richer, M. G., Báez, S.-H., López, J. A., Riesgo, H., & García-Díaz, Ma. T. 2009, Rev. Mexicana Astron. Astrofis., 45, 239
- Richer et al. (2008) Richer, M. G., López, J. A., Pereyra, M., Riesgo, H., García-Díaz, M. T., & Báez, S.-H. 2008, ApJ, 689, 203
- Richer & McCall (2008) Richer, M. G., & McCall, M. L. 2008, ApJ, 684, 1190
- Richer et al. (1999) Richer, M. G., Stasińska, G., & McCall, M. L. 1999, A&AS, 135, 203
- Richer et al. (2010) Richer, M. G., et al. 2010, Rev. Mexicana Astron. Astrofis., submitted
- Roth et al. (2004) Roth, M. M., Becker, T., Kelz, A., & Schmoll, J. 2004, ApJ, 603, 531
- Sahu et al. (2006) Sahu, K. C., et al. 2006, Nature, 443, 534
- Schmidt-Voigt & Köppen (1987a) Schmidt-Voigt, M., & Köppen, J. 1987a, A&A, 174, 211
- Schmidt-Voigt & Köppen (1987b) Schmidt-Voigt, M., & Köppen, J. 1987b, A&A, 174, 223
- Schönberner et al. (2005a) Schönberner, D., Jacob, R., & Steffen, M. 2005a, A&A, 441, 573
- Schönberner et al. (2005b) Schönberner, D., Jacob, R., & Steffen, M., & Roth, M. M. 2005b, in Planetary Nebulae as Astronomical Tools, eds. R. Szczerba, G. Stasińska, & S. Górny, AIP Conference Proceedings, 804, 269
- Schönberner et al. (2007) Schönberner, D., Jacob, R., Steffen, M., & Sandin, C. 2007, A&A, 473, 467
- Tylenda et al. (1994) Tylenda, R., Stasińska, G., Acker, A., & Stenholm, B. 1994, A&AS, 106, 559
- Villaver et al. (2002) Villaver, E., Manchado, A., & García-Segura, G. 2002, ApJ, 581, 1204
- Wachter et al. (2008) Wachter, A., Winters, J. M., Schröder, K.-P., & Sedlmayr, E. 2008, A&A, 486, 497
- Wall & Jenkins (2003) Wall, J. V., & Jenkins, C. R. 2003, Practical Statistics for Astronomers (Cambridge University Press: Cambridge, U.K.)
- Walsh et al. (1999) Walsh, J. R., Walton, N. A., Jacoby, G. H., & Peletier, R. F. 1999, A&A, 346, 753
- Webster (1988) Webster, B. L. 1988, MNRAS, 230, 377
- Wilson (1950) Wilson, O. C. 1950, ApJ, 111, 279
- Wood et al. (1992) Wood, P. R., Whiteoak, J. B., Hughes, S. M. G., Bessell, M. S., Gardner, F. F., & Hyland, A. R. 1992, ApJ, 397, 552
- Zijlstraa et al. (2006) Zijlstraa, A. A., Gesicki, K., Walsh, J. R., Péquignot, D., van Hoof, P. A. M., & Minniti, D. 2006, MNRAS, 369, 875
- Zoccali et al. (2008) Zoccali, M., Hill, V., Lecureur, A., Barbuy, B., Renzini, A., Minniti, D., Gómez, A., & Ortolani, S. 2008, A&A, 486, 177
| Object | PN G | sample | Run | FWHM(H)a | FWHM(5007)a | H Diameterb | |||
|---|---|---|---|---|---|---|---|---|---|
| (Å) | (km/s) | (Å) | (km/s) | 10% | (erg/s) | ||||
| H 1-24 | 004.6+06.0 | weak 5007 | 2008jun | 7.3 | 34.84 | ||||
| H 1-34 | 005.5+02.7 | weak 5007 | 2008jun | 5.0 | 34.60 | ||||
| H 1-39 | 356.5-03.9 | weak 5007 | 2008jun | 5.9 | 34.80 | ||||
| H 1-43 | 357.1-04.7 | weak 5007 | 2008jun | 5.8 | 34.45 | ||||
| H 1-44 | 358.9-03.7 | weak 5007 | 2008jun | 6.3 | 34.10 | ||||
| H 1-55 | 001.7-04.4 | weak 5007 | 2008jun | 5.7 | 34.38 | ||||
| H 2-25 | 004.8+02.0 | weak 5007 | 2008jun | 7.1 | 34.54 | ||||
| H 2-29 | 357.6-03.3 | weak 5007 | 2008jun | 12.7 | 33.49 | ||||
| H 2-48 | 011.3-09.4 | weak 5007 | 2008jun | 5.9 | 35.26 | ||||
| He 2-260 | 008.2+06.8 | weak 5007 | 2008jun | 7.7 | 34.39 | ||||
| M 1-26 | 358.9-00.7 | weak 5007 | 2008jun | 7.3 | 36.07 | ||||
| M 1-27 | 356.5-02.3 | weak 5007 | 2008jun | 8.9 | 35.54 | ||||
| M 1-30 | 355.9-04.2 | weak 5007 | 2008jun | 6.5 | 34.97 | ||||
| M 1-44 | 004.9-04.9 | weak 5007 | 2008jun | 7.6 | 34.75 | ||||
| M 1-45 | 012.6-02.6 | weak 5007 | 2008jun | 5.6 | 35.15 | ||||
| M 2-10 | 354.2+04.3 | weak 5007 | 2008jun | 7.5 | 34.90 | ||||
| M 2-12 | 359.8+05.6 | weak 5007 | 2008jun | 7.1 | 34.56 | ||||
| M 2-14 | 003.6+03.1 | weak 5007 | 2008jun | 5.3 | 34.47 | ||||
| M 2-19 | 000.2-01.9 | weak 5007 | 2008jun | 8.8 | 34.75 | ||||
| M 2-7 | 353.7+06.3 | weak 5007 | 2008jun | 9.9 | 34.15 | ||||
| M 3-13 | 005.2+04.2 | weak 5007 | 2008jun | 6.2 | 35.24 | ||||
| M 3-17 | 359.3-03.1 | weak 5007 | 2008jun | 5.7 | 34.90 | ||||
| SwSt 1 | 001.5-06.7 | weak 5007 | 2008jun | 4.6 | 35.03 | ||||
| Th 3-16 | 357.5-03.1 | weak 5007 | 2008jun | 6.3 | 34.05 | ||||
| Al 1 | 006.8-08.6 | strong 4686 | 2008sep | 13.0 | 34.12 | ||||
| Al 2-E | 359.3+03.6 | strong 4686 | 2008sep | 8.6 | 33.19 | ||||
| Al 2-H | 357.2+01.4 | strong 4686 | 2008sep | 9.3 | |||||
| Al 2-I | 359.5+02.6 | strong 4686 | 2008sep | 6.6 | |||||
| H 2-44 | 005.5-04.0 | strong 4686 | 2008sep | 12.4 | 34.16 | ||||
| KFL 02 | strong 4686 | 2008sep | 8.6 | 31.49 | |||||
| KFL 09 | strong 4686 | 2008sep | 12.0 | 33.82 | |||||
| KFL 16 | 005.6-04.7 | strong 4686 | 2008sep | 13.9 | 33.38 | ||||
| M 2-38 | 005.7-05.3 | strong 4686 | 2008sep | 14.4 | 33.50 | ||||
| M 3-22 | 000.7-03.7 | strong 4686 | 2008sep | 9.3 | 34.21 | ||||
| M 3-23 | 000.9-04.8 | strong 4686 | 2008sep | 14.0 | 34.69 | ||||
| Pe 1-12 | 004.0-05.8 | strong 4686 | 2008sep | 11.9 | 33.38 | ||||
| Pe 1-13 | 010.7-06.7 | strong 4686 | 2008sep | 9.4 | 33.69 | ||||
| Pe 2-13 | 006.4-04.6 | strong 4686 | 2008sep | 9.8 | 34.08 | ||||
| Sa 2-230 | 010.7+07.4 | strong 4686 | 2008sep | 15.1 | 33.63 | ||||
| SB 15 | 009.3-06.5 | strong 4686 | 2008sep | 8.5 | 32.76 | ||||
| SB 37 | 352.6-04.9 | strong 4686 | 2008sep | 10.0 | 33.92 | ||||
| SB 38 | 352.7-08.4 | strong 4686 | 2008sep | 14.0 | 32.18 | ||||
| SB 55 | 359.4-08.5 | strong 4686 | 2008sep | 14.9 | 32.88 | ||||
| ShWi 2-1 | 001.4-03.4 | strong 4686 | 2008sep | 11.8 | 33.60 | ||||
| Th 3-26 | 358.8+03.0 | strong 4686 | 2008sep | 9.7 | 34.05 | ||||
| H 2-13 | 357.2+02.0 | 6560 present | 2008jun | 6.0 | 34.47 | ||||
| H 2-43 | 003.4-04.8 | 6560 absennt | 2008jun | 4.6 | 34.88 |