Thirty New Low-Mass Spectroscopic Binaries11affiliation: Based on
observations collected at the W. M. Keck Observatory, the Canada-France-Hawaii Telescope and by the WASP Consortium. The Keck Observatory is operated as a scientific partnership between the California Institute of
Technology, the University of California, and NASA, and was made possible by the generous
financial support of the W. M. Keck Foundation. The CFHT is operated by the National Research Council of Canada,
the Centre National de la Recherche Scientifique of France, and the University of Hawaii. The WASP Consortium consists of astronomers primarily from the Queen’s University Belfast,
St Andrews, Keele, Leicester, The Open University, Isaac Newton Group La Palma and
Instituto de Astrofísica de Canarias. The SuperWASP Cameras were constructed
and operated with funds made available from Consortium Universities and the UK’s Science and
Technology Facilities Council.
Abstract
As part of our search for young M dwarfs within 25 pc, we acquired high-resolution spectra of 185 low-mass stars compiled by the NStars project that have strong X-ray emission. By cross-correlating these spectra with radial velocity standard stars, we are sensitive to finding multi-lined spectroscopic binaries. We find a low-mass spectroscopic binary fraction of 16% consisting of 27 SB2s, 2 SB3s and 1 SB4, increasing the number of known low-mass SBs by 50% and proving that strong X-ray emission is an extremely efficient way to find M-dwarf SBs. WASP photometry of 23 of these systems revealed two low-mass EBs, bringing the count of known M dwarf EBs to 15. BD -22 5866, the SB4, is fully described in Shkolnik et al. (2008) and CCDM J04404+3127 B consists of a two mid-M stars orbiting each other every 2.048 days. WASP also provided rotation periods for 12 systems, and in the cases where the synchronization time scales are short, we used to determine the true orbital parameters. For those with no , we use differential radial velocities to set upper limits on orbital periods and semi-major axes. More than half of our sample has near-equal-mass components ( 0.8). This is expected since our sample is biased towards tight orbits where saturated X-ray emission is due to tidal spin-up rather than stellar youth. Increasing the samples of M dwarf SBs and EBs is extremely valuable in setting constraints on current theories of stellar multiplicity and evolution scenarios for low-mass multiple systems.
1 Introduction
The multiplicity of stars is an important constraint of star formation theories as most stars form as part of a binary or higher-order multiple system (e.g. Halbwachs et al. 2003; Bate 2009). Moreover, double- (or multi-) lined spectroscopic binaries (SBs) allow precise determination of dynamical properties including the mass ratio. The analysis of photometric and spectroscopic data of eclipsing binaries (EBs) provides radii, temperatures, luminosities and masses, arguably the most important stellar parameter, for two stars with same age and metallicity (Lastennet & Valls-Gabaud, 2002) making them vital in calibrating stellar evolutionary models.
M dwarf EBs are particularly important since the radii of active M dwarfs are known to be 10-15% larger than existing models predict (López-Morales & Ribas, 2005; Lopez-Morales et al., 2006; Torres et al., 2009). This discrepancy is thought to be caused by magnetic fields on active M dwarfs which inhibit convection (López-Morales, 2007; Chabrier et al., 2007) and/or missing opacity sources in the models (Berger et al., 2006). Further study of the problem requires the identification and detailed study of more M dwarf EBs with a range of properties (e.g. masses, activity levels, metallicities, ages).
Though M dwarfs are ubiquitous in the Galaxy, composing 75% of known stars (Bochanski et al., 2008), their intrinsic faintness makes them difficult and costly to observe, and thus the multiplicity of M dwarfs has been a challenge to measure. A binary fraction of 57% has been well established for G dwarfs (Duquennoy & Mayor, 1991), and there is clear consensus that the binary fraction of M dwarfs is significantly less than that. Published values range from 25% (Leinert et al., 1997) to 42% (Fischer & Marcy, 1992) with the largest uncertainties likely due to incompleteness corrections. In addition to supplying key constraints for star formation theories, completing the M dwarf binary census of the solar neighborhood, which to date, is (near)-complete out to only 9 pc (Delfosse et al., 2004), is yet another goal in finding the nearby low-mass SBs.
Delfosse et al. (2004) presented what may be the most complete statistical study of M dwarfs, including both spectroscopic and visual binaries. They conclude a binary fraction of 26 3% and that for M dwarfs, as for G dwarfs, the mass ratio () distribution is a function of orbital period with most shorter period binaries having near equal component masses, while wide binaries (50 days) have a flat q distribution. The different distribution in the two samples may point to two distinct formation mechanisms, one for long-period and one for short-period orbits.
Here we report on 30 low-mass SBs detected from 185 X-ray-selected M dwarfs in the solar neighborhood. Six of the targets were included in the Gliese catalog of which only one was previously detected to be a SB. Prior to this work, 46 M dwarf SBs were published in the literature (Duquennoy & Mayor, 1991; Delfosse et al., 1999; Fischer & Marcy, 1992) with an additional 13 low-mass EBs (Shkolnik et al. 2008 and references therein and Blake et al. 2008). Thus our work increases the known sample of SBs by 50%.
We also searched the WASP photometric database in which we found 2 EBs and measured rotation periods of 12 binaries. Though rotation periods of single stars are important age indicators (e.g. Barnes 2007), for short-period binaries, where tidal locking is almost certain, the rotation periods offer true orbital periods instead.
2 Sample Selection
The original science goals of the X-ray-selected sample was to search for the youngest M dwarfs within 25 pc to identify the best possible stellar targets for direct imaging searches of extrasolar planets and circumstellar disks (Shkolnik et al., 2009). The Two Micron All Sky Survey (2MASS) is optimal for finding low-mass stars, since the SEDs of cool stars peak in the near-IR (e.g. Hawley et al. 2002). However, the infrared passbands provide less distinctive spectral classification of early- and mid-M dwarfs (i.e. M2–M7 dwarfs have () colors which span only 0.2 mag; Reid et al. 2007b) impeding the photometric distance determination. Thus, in order to fully characterize a volume-limited sample of young M dwarfs, a proper motion requirement of 0.18″ yr-1 was implemented, equivalent to a tangential velocity of 21 km s-1 at 25 pc.
We drew 800 targets from the NStars 20-pc census (Reid et al., 2003, 2004) constructed from the 2MASS catalogs (Skrutskie et al. 2006) along with the Lépine et al. (2002) and Lépine & Shara (2005) proper motion catalogs, with an additional 300 newly-catalogued M dwarfs that exhibit significant proper motion between the POSSI and 2MASS surveys (i.e. the Moving-M sample; Reid et al. 2007a). Distances were available either from parallaxes or spectrophotometric relations and are limited to 25 pc from the Sun, good to 15% assuming all the stars were single and on the main-sequence (e.g., Reid & Cruz 2002; Cruz et al. 2003). Further details of the sample selection can be found in Shkolnik et al. (2009).
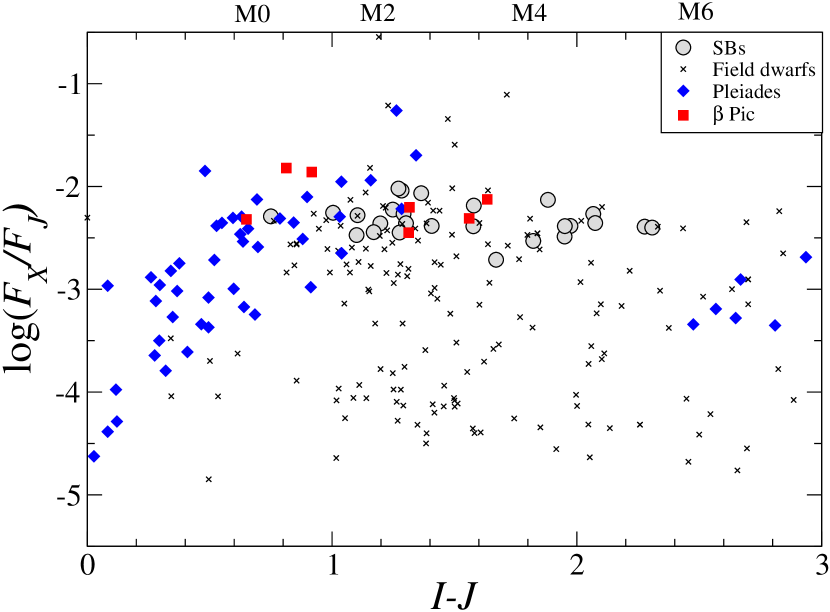
In order to characterize the youngest members of this sample, we acquired high-resolution spectra of the 185 cool dwarfs with bright X-ray luminosities. In Figure 1 we plot the fractional X-ray flux, as a function of , where is the empirically calibrated ROSAT X-ray flux (Voges et al., 1999) using the count-rate conversion equation of Schmitt et al. (1995), and is the 2MASS -band flux. Target stars were chosen to have high X-ray emission () near the saturation limit (Riaz et al., 2006) and comparable to or greater than the fractional luminosities of Pleiades members (120 Myr, Micela et al. 1998) and Pic members (12 Myr, Torres et al. 2006). We measured the radial velocities (RVs) needed to determine galactic space motion and young moving group membership (Shkolnik et al., in prep.). This process is also sensitive to finding SBs at any age, particularly those in short-period orbits where the tidal-locking forces rapid rotation producing high chromospheric and X-ray emission.
3 The spectra
We acquired spectra with the High Resolution Échelle Spectrometer (HIRES; Vogt et al. 1994) on the Keck I 10-m telescope and the Échelle SpectroPolarimetric Device for the Observation of Stars (ESPaDOnS; Donati et al. 2006) on the Canada-France-Hawaii 3.6-m telescope, both located on the summit of Mauna Kea.
We used the 0.861 slit with HIRES to give a spectral resolution of /58,000. The detector consists of a mosaic of three 2048 x 4096 15- pixel CCDs, corresponding to a blue, green and red chip spanning 4900 – 9200 Å. To maximize the throughput near the peak of a M dwarf spectral energy distribution, we used the GG475 filter with the red cross-disperser. The data product of each exposure is a multiple-extension FITS file from which we reduced and extracted the data from each chip separately.
ESPaDOnS is fiber fed from the Cassegrain to Coudé focus where the fiber image is projected onto a Bowen-Walraven slicer at the spectrograph entrance. With a 20484608-pixel CCD detector, ESPaDOnS’ ‘star+sky’ mode records the full spectrum over 40 grating orders covering 3700 to 10400 Å at a spectral resolution of /68,000. The data were reduced using Libre Esprit, a fully automated reduction package provided for the instrument and described in detail by Donati et al. (1997, 2007).
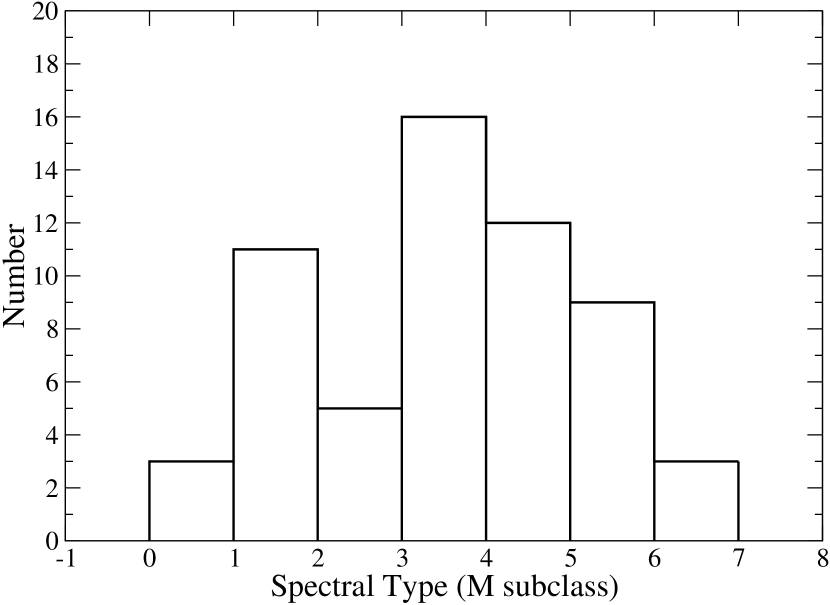
All final spectra were of moderate S/N reaching 50 per pixel at 7000 Å. Each night, spectra were also taken of an A0V standard star for telluric line correction and an early-, mid- and late-M RV standard. To search for multi-lined binaries, we cross-correlated each of 7 orders between 7000 and 9000 Å of each stellar spectrum (from both instruments) with a RV standard of similar spectral type using IRAF’s111IRAF (Image Reduction and Analysis Facility) is distributed by the National Optical Astronomy Observatories, which is operated by the Association of Universities for Research in Astronomy, Inc. (AURA) under cooperative agreement with the National Science Foundation. fxcor routine (Fitzpatrick 1993).222See Table 3 of Shkolnik et al. (2009) for the list of RV standards used. We measure the RVs of each component from the gaussian peaks fitted to the cross-correlation function (CCF), taking the average of all orders, with a RMS typically less than 1 km s-1 for both instruments. The resolved CCF peaks allowed us to estimate the spectral types, and thus component masses, of the individual stars assuming a flux-weighted relation between component and integrated spectral types (Daemgen et al. 2007): . Evidence for this linear relationship is presented by Cruz & Reid (2002), which shows both the TiO and VO band depths vary linearly with SpT for stars ranging from M0 to M7. was measured from the ratio of the band indices of TiO 7140 to TiO 8465 defined by Slesnick et al. (2006) and calibrated with 136 M dwarfs of known SpT (Shkolnik et al., 2009). and were derived from the integrated “flux” of the gaussian fits to the cross-correlation peaks. An additional restriction to the spectral types of the two components is provided by , where . These two equations together produce a unique solution for the component spectral types, which are good to 0.5 subclasses or better. The integrated properties of the binary systems, including the systemic velocity and the corrected photometric distance, are listed in Table 1 with a histogram of the component SpTs in Figure 2. We can estimate the mass of the components from these SpTs using the mass relationship from Reid & Hawley (2005), which is based on the 8-pc sample of M dwarfs originally presented in Reid & Gizis (1997). The error on the masses ranges from 10% for M0 to 40% for M6, mostly due to the error in spectral typing the two components.
4 WASP Photometry
We cross-correlated our sample of M dwarf SBs with the UK Wide-Angle Search for Planets (WASP) database (Pollacco et al., 2006) and identified 23 observed systems, of which 12 have clear rotational modulation, including 2 new EBs.
WASP is a wide-field photometric variability survey of bright stars designed to detect significant numbers of transiting gas giant planets. The survey operates two robotic telescopes, one in each hemisphere, which repeatedly observe nearly the entire visible sky every clear night. The resulting data product of the ongoing survey consists of high cadence ( minute sampling), precise (% r.m.s.), single-band light curves for millions of bright () stars with spectral types that cover the Hertzsprung-Russell diagram. Each stellar light curve typically has several thousand photometric data points obtained over several years with typical photometric precision of 0.007 – 7 mag per observing season for the above magnitude range. The stars that are observed exist in all regions of the sky except the Galactic plane due to crowding and extinction and the equatorial poles, which have yet to be surveyed. The WASP survey is the most successful transiting planet survey to date and has discovered over 20 new transiting gas giant planets (e.g. Cameron et al., 2007; Anderson et al., 2008; West et al., 2009; Hebb et al., 2009; Hellier et al., 2009). However, for our SB targets, we are able to detect rotational variability with an amplitude ¿ 0.01 mags.
4.1 Rotation Periods
Asymmetrically distributed starspots on the photosphere of one or more components of the binary will cause periodic brightness variations as the spots rotate in and out of view with the star. The stellar rotation period (or a harmonic) can be identified through the detection of a periodic sinusoidal variability signal. Starspots typically evolve on timescales of weeks to months which leads to changes in the amplitude and/or phase of the variability, thus we independently searched each season of photometric WASP data to maximize our chances of detecting a periodic signal.
To measure the level of periodic variability in each target, we determined the improvement in over a flat, non-variable model ( when a sine wave of the form was fit to each season of the WASP data phase-folded at a set of trial periods, . Periods between 0.2–30 days were searched. The statistic, (Zechmeister & Kürster, 2009), where is the with respect to the best fitting sinusoidal model, was used to distinguish genuine variability in each light curve. Our sensitivity to the period detection is different for each object, but in general, we can detect a sinusoidal signal with an amplitude of mmag and a period, days.
Twelve of the 23 M dwarf SBs with WASP data333Seven of the SBs have not yet been sufficiently observed by WASP or are not accessible to the telescopes. show periodic sinusoidal variability in at least one season of WASP data. These are listed in Table 3 and their phase-folded light curves are shown in Figure 4. We note that four of the systems have multiple seasons of data in which the same or a similar period is detected which provides additional confirmation of the period detection. No variability is seen in the remaining 11 targets for which we have time-series data (Table 4). In both tables, we first list the target and the number of data points available in each season as well as the HJD of the starting and ending dates for the light curve. We also list the value of the statistic for the highest peak in the periodogram. All the positive detections have and the non-detections typically have . For the positive detections, we also list the rotation period and the amplitude of the variability.
4.2 Low-mass eclipsing binaries
In addition to discovering transiting extrasolar planets, the time-series photometry obtained through the WASP survey is an excellent data set for identifying eclipsing binary stars. Therefore, we searched the WASP light curves of the SB sample for periodic eclipses. We employed the WASP implementation of the box-least squares (BLS) algorithm (Kovács et al., 2002; Collier Cameron et al., 2006) which is designed to detect square-shaped dips in brightness in an otherwise flat light curve. The BLS algorithm is efficient at detecting both transiting planets (Tingley, 2003) and EBs (Hartman et al., 2009). We searched periods between 0.5-10 days and detected two eclipsing binaries. BD -22 5866 is a late-type quadruple system composed of two binary pairs (K7+K7 and M1+M2) in which the more massive binary is eclipsing with a 2.21 day period. This unique system is described in Shkolnik et al. (2008).
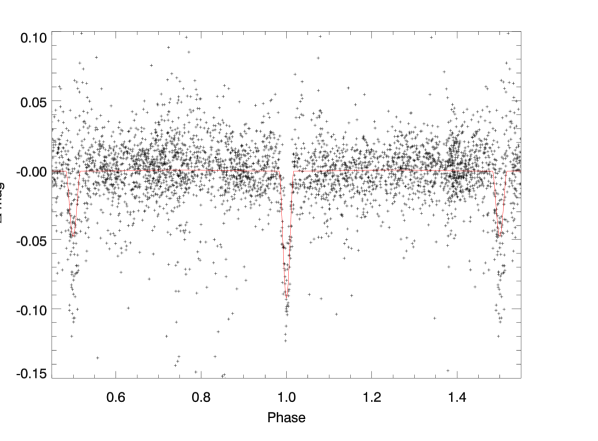
The second EB we detected in the M dwarf SB sample is CCDM J04404+3127 B. The object is part of a triple system composed of the EB with a proper motion companion away (CCDM J04404+3127 A). The photometry shows an eclipsing light curve for CCDM J04404+3127 (Figure 3), but since the A and B components of the multiple system are blended in the large photometric aperture (), the WASP data alone cannot determine which component is the unresolved EB.444Hartman et al. (2009) also identify this object (HAT-216-0003316) as a probable EB based on HAT transiting planet survey data, but the object is blended with CCDM J04404+3127 A in their data as well. However, given that CCDM J04404+3127 A does not have a ROSAT detection and the single spectrum of CCDM J04404+3127 B presented here confirms it be a spectroscopic binary, it must also be the EB.
The target was observed by the SuperWASP camera on La Palma, Canary Islands in the 2004 and 2006 observing seasons. The existing photometric data consists of 949 measurements taken between 1 August and 29 September 2004 and 2478 measurements taken from 29 September 2006 to 15 February 2007. After detecting the eclipsing binary using the BLS algorithm described above, we fit a more realistic eclipsing light curve model to the combined light curve to derive an accurate ephemeris for the system. We used the JKT Eclipsing Binary Orbit Program (EBOP; Popper & Etzel 1981; Southworth et al. 2007 to derive an ephemeris of:555The ephemeris reported here is consistent with the period determined by Hartman et al. (2009).
Due to the contamination by light from CCDM J04404+3127 A, we cannot confidently report any other parameters for the system until more data is collected. However from the spectrum, the EB consists of a M4.2 and a M5.0 dwarf.
5 Binary Properties
5.1 Tidal Synchronization and Maximal Orbits
With a single spectroscopic observation, the difference between the radial velocity of each component (RV) provides an upper limit to the orbital period and semi-major axis using the stellar masses determined from the integrated fluxes (i.e. the area) of the cross-correlation peaks. However, the added photometry of WASP can provide a true orbital period and semi-major axis if the stellar system is expected to be tidally synchronized, i.e. .
The tidal synchronization time scale of close-in binary systems is fairly short, e.g. less than 200 Myr for two 0.5-M⊙ stars with =5 days as calculated using Equation 6.1 of Zahn (1977). Drake et al. (1998) show that Zahn’s values serve as an upper limit to the time needed to synchronize the upper envelopes of the stars and thus the time that it would take for to equal may be 3 times shorter than . Such time scales are comparable to the lithium depletion time scale, which ranges from 15 Myr for a M0 to 90 Myr for a M6 dwarf (Chabrier et al., 1996). We do not detect any lithium in these stars, nor any other spectroscopic indication that the stars are young (e.g. low surface gravity and strong H emission), and thus the stars are almost certainly older than Gyr.
Of the 12 binaries with measured rotation periods, 2 have calculated (using ) of less than 200 Myr. For these systems, we assume that the binaries are synchronized such that the observed photometric period is equal to both the rotation and orbital periods. These periods and corresponding semi-major axes are listed in Table 2. For those stars where there is no photometric data or the photometric period is long enough such that if it were the orbital period Gyr, we list the maximal orbital parameters, and .
With only one RV measurement, we cannot assume tidal synchronousity in those systems with short rotational periods but with long . The rapid rotation of one or both of the components may be due to a young system in a wider orbit. Although we can set some lower limits on the ages of the stars using surface gravity indicies and the lack of lithium absorption, these limits are generally short compared to the spin-down rate of M dwarfs. Delfosse et al. (1998) reported that early M’s spin down to 2 km s-1 or less (or = 10 – 15 days) by 500 Myr while late Ms take 1 Gyr to spin down to 2 km s-1. These time scales are comparable to the statistical investigations of West et al. (2008). And, given that the sample was selected for strong X-ray luminosity, we cannot rule out that our SB sample maybe indeed contain young M dwarfs in wide binary systems. However, it remains probable that all the stars in this sample will eventually be shown to be close-in, rapidly orbiting and rotating SBs.
5.2 X-ray saturation in short-period systems
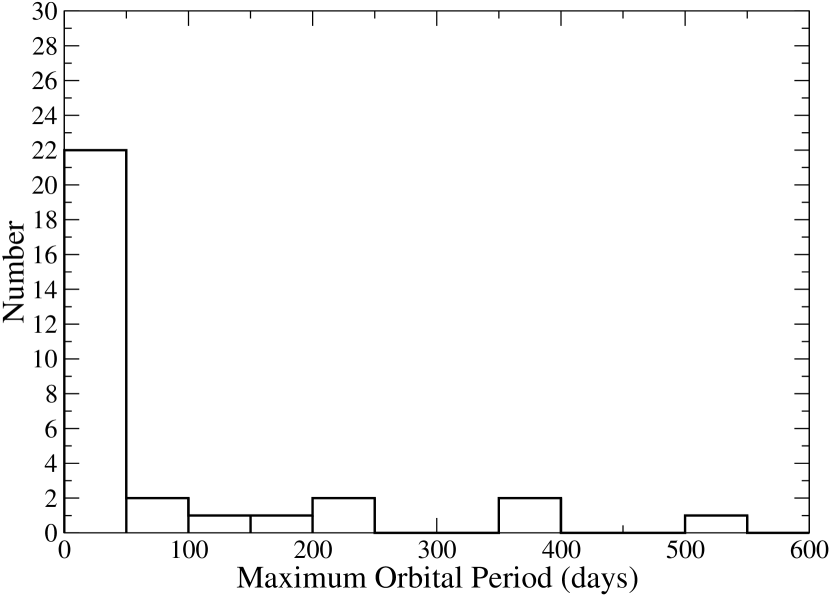
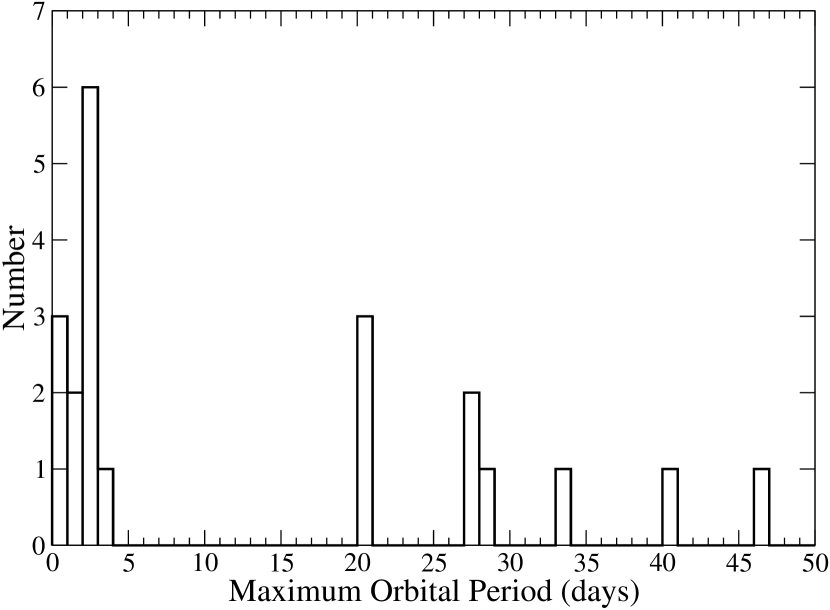
At least 12 of the 30 systems have orbital periods less than 4.5 days (Figure 5) clearly displaying our bias towards tidally spun-up stars. Data compiled by Riaz et al. (2006) of a large set of M dwarfs suggest that the coronal activity remains at a high level independent of SpT and age implying that rotation, not age, dominates the magnetic activity in low-mass stars.
Recently, Reiners et al. (2009) measured that in M dwarfs the surface magnetic flux also saturates, similar to the activity implying that a star with saturated levels of X-ray emission does not necessarily have a large filling factor (i.e. the whole star need not be covered with active regions). This is supported by the clear rotation periods we detect. However, there are three targets, all of which are mid-Ms, (2MASS J0808+4347, HAT 199-13890, and LSPM J2114+1254) for which there is no modulated photometric signal and yet the maximum orbital periods are quite short ( 3 days). In these cases, we suspect that the filling factor is indeed high, such that the symmetric spots do not produce any photometric variability. This is supported by spectropolarimetric observation by Morin et al. (2008) who report that a sample of 5 mid-M stars mainly host axisymmetric large-scale poloidal fields.
5.3 Mass Ratios
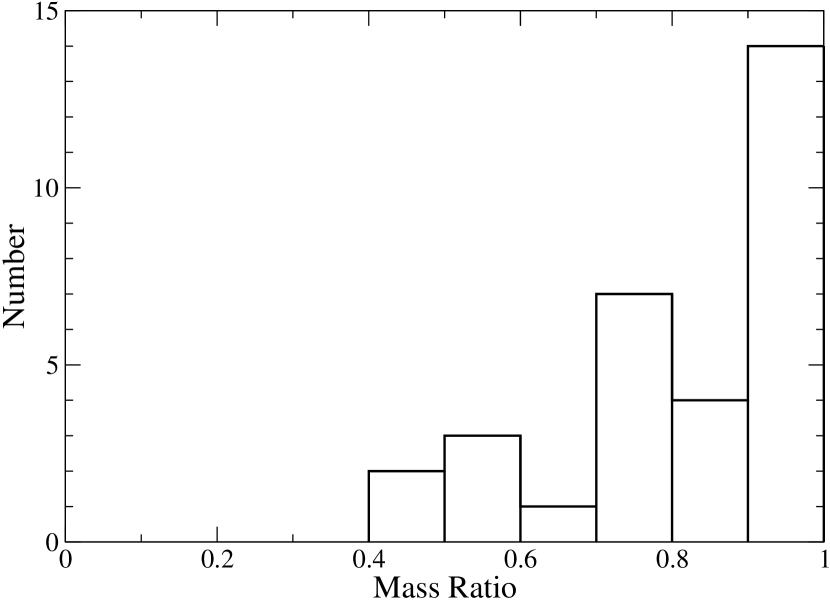
Past studies of SBs have somewhat crudely shown that the mass ratio , is inversely correlated with the mass of the primary star. For solar-type stars, peaks at about 0.2 (Duquennoy & Mayor, 1991), while Halbwachs et al. (2003) found a bimodal distribution for A to K type stars: has a broad distribution between 0.2 and 0.7 for long orbital periods, and a strong peak with near equal-mass systems, primarily in shorter orbital period ( 100 days). For M dwarfs, Fischer & Marcy (1992) measured a flat distribution for over all periods in a sample of visual and spectroscopic binaries. Although our range for matches theirs (0.4 – 1; Figure 6), more than half of our sample has 0.8, which is not the case in the Fischer & Marcy (1992) sample. This is expected since our sample is biased towards tight orbits where the primary selection criterion of saturated X-ray emission is due to tidal spin-up. In addition, these binaries with large will synchronize much more quickly as .
6 Conclusions
Of our sample of 185 X-ray bright M dwarfs, we find a low-mass, multi-lined spectroscopic binary fraction of 16%. These 30 SBs are composed of 27 SB2s, 2 SB3s and 1 SB4, increasing the number of known low-mass SBs by 50% and proving that strong X- ray emission is an extremely efficient way to find M-dwarf SBs.
To search for single-lined SBs (SB1), we observed two epochs (separated typically by 2–3 months) of 65 of the 185 targets, none of which showed a significant RV variation between visits to the level of 1 km s-1. This implies that the single-lined binary fraction of stars with orbital periods of less than about 1.5 years in our sample is very low, less than 1.5%, and that M dwarf binaries with low mass ratios () are rare. It is possible that up to 4%666This 4% limit is based on the time a close-in low-mass binary with an orbital period of 5 days would spend near conjunction such that the RVs of the two components would not produce resolved peaks in the CCF. of the stars with a single observation are indeed double-lined SBs if the systems were in conjunction at the times of the observation. Combining this with the 1.5% chance of observing an SB1, there are at most a handful of undiscovered SBs in the original 185 ROSAT-selected targets, setting an upper limit of 19% to the SB fraction (with years) of our sample.
WASP photometry of 23 of these systems revealed two low-mass EBs, bringing the count of known M dwarf EBs to 15. The WASP data also provided rotation periods for 12 systems, and in the cases where the synchronization time scales are short, orbital periods and semi-major axes.
This X-ray bright sample of 30 SBs is strongly biased towards high-, tidally-synchronized binaries. In addition to being in short-period orbits, they are also relatively bright, making them excellent targets for a spectroscopic monitoring program to measure the component velocities necessary to determine the Keplerian orbital parameters for more precise mass ratios, and in the case of the eclipsing systems, the individual masses needed to test evolutionary models.
References
- Anderson et al. (2008) Anderson, D. R., et al. 2008, MNRAS, 387, L4
- Barnes (2007) Barnes, S. A. 2007, ApJ, 669, 1167
- Bate (2009) Bate, M. R. 2009, MNRAS, 392, 590
- Berger et al. (2006) Berger, D. H., et al. 2006, ApJ, 644, 475
- Blake et al. (2008) Blake, C. H., Torres, G., Bloom, J. S., & Gaudi, B. S. 2008, ApJ, 684, 635
- Bochanski et al. (2008) Bochanski, J. J., Hawley, S. L., Reid, I. N., Covey, K. R., West, A. A., Golimowski, D. A., & Ivezic, Z. 2008, ArXiv e-prints
- Cameron et al. (2007) Cameron, A. C., et al. 2007, MNRAS, 375, 951
- Chabrier et al. (1996) Chabrier, G., Baraffe, I., & Plez, B. 1996, ApJ, 459, L91+
- Chabrier et al. (2007) Chabrier, G., Gallardo, J., & Baraffe, I. 2007, A&A, 472, L17
- Collier Cameron et al. (2006) Collier Cameron, A., et al. 2006, MNRAS, 373, 799
- Cruz & Reid (2002) Cruz, K. L., & Reid, I. N. 2002, AJ, 123, 2828
- Cruz et al. (2003) Cruz, K. L., Reid, I. N., Liebert, J., Kirkpatrick, J. D., & Lowrance, P. J. 2003, AJ, 126, 2421
- Daemgen et al. (2007) Daemgen, S., Siegler, N., Reid, I. N., & Close, L. M. 2007, ApJ, 654, 558
- Delfosse et al. (2004) Delfosse, X., et al. 2004, in Astronomical Society of the Pacific Conference Series, Vol. 318, Spectroscopically and Spatially Resolving the Components of the Close Binary Stars, ed. R. W. Hilditch, H. Hensberge, & K. Pavlovski, 166–174
- Delfosse et al. (1999) Delfosse, X., Forveille, T., Beuzit, J.-L., Udry, S., Mayor, M., & Perrier, C. 1999, A&A, 344, 897
- Delfosse et al. (1998) Delfosse, X., Forveille, T., Perrier, C., & Mayor, M. 1998, A&A, 331, 581
- Drake et al. (1998) Drake, S. A., Pravdo, S. H., Angelini, L., & Stern, R. A. 1998, AJ, 115, 2122
- Duquennoy & Mayor (1991) Duquennoy, A., & Mayor, M. 1991, A&A, 248, 485
- Fischer & Marcy (1992) Fischer, D. A., & Marcy, G. W. 1992, ApJ, 396, 178
- Halbwachs et al. (2003) Halbwachs, J. L., Mayor, M., Udry, S., & Arenou, F. 2003, A&A, 397, 159
- Hartman et al. (2009) Hartman, J. D., Bakos, G. Á., Noyes, R. W., Sipöcz, B., Kovács, G., Mazeh, T., Shporer, A., & Pál, A. 2009, ArXiv e-prints
- Hawley et al. (2002) Hawley, S. L., et al. 2002, AJ, 123, 3409
- Hebb et al. (2009) Hebb, L., et al. 2009, ApJ, 693, 1920
- Hellier et al. (2009) Hellier, C., et al. 2009, Nature, 460, 1098
- Hünsch et al. (1999) Hünsch, M., Schmitt, J. H. M. M., Sterzik, M. F., & Voges, W. 1999, A&AS, 135, 319
- Kovács et al. (2002) Kovács, G., Zucker, S., & Mazeh, T. 2002, A&A, 391, 369
- Lastennet & Valls-Gabaud (2002) Lastennet, E., & Valls-Gabaud, D. 2002, A&A, 396, 551
- Leinert et al. (1997) Leinert, C., Henry, T., Glindemann, A., & McCarthy, Jr., D. W. 1997, A&A, 325, 159
- Lépine & Shara (2005) Lépine, S., & Shara, M. M. 2005, AJ, 129, 1483
- Lépine et al. (2002) Lépine, S., Shara, M. M., & Rich, R. M. 2002, AJ, 124, 1190
- López-Morales (2007) López-Morales, M. 2007, ApJ, 660, 732
- Lopez-Morales et al. (2006) Lopez-Morales, M., Orosz, J. A., Shaw, J. S., Havelka, L., Arevalo, M. J., McIntyre, T., & Lazaro, C. 2006, ArXiv Astrophysics e-prints
- López-Morales & Ribas (2005) López-Morales, M., & Ribas, I. 2005, ApJ, 631, 1120
- Micela et al. (1998) Micela, G., Sciortino, S., Harnden, Jr., F. R., & Rosner, R. 1998, Ap&SS, 261, 105
- Morin et al. (2008) Morin, J., et al. 2008, MNRAS, 390, 567
- Perryman & ESA (1997) Perryman, M. A. C., & ESA, eds. 1997, ESA Special Publication, Vol. 1200, The HIPPARCOS and TYCHO catalogues. Astrometric and photometric star catalogues derived from the ESA HIPPARCOS Space Astrometry Mission
- Pollacco et al. (2006) Pollacco, D. L., et al. 2006, PASP, 118, 1407
- Popper & Etzel (1981) Popper, D. M., & Etzel, P. B. 1981, AJ, 86, 102
- Reid & Cruz (2002) Reid, I. N., & Cruz, K. L. 2002, AJ, 123, 2806
- Reid et al. (2003) Reid, I. N., et al. 2003, AJ, 126, 3007
- Reid et al. (2004) —. 2004, AJ, 128, 463
- Reid et al. (2007a) Reid, I. N., Cruz, K. L., & Allen, P. R. 2007a, AJ, 133, 2825
- Reid & Gizis (1997) Reid, I. N., & Gizis, J. E. 1997, AJ, 113, 2246
- Reid & Hawley (2005) Reid, I. N., & Hawley, S. L. 2005, New light on dark stars : red dwarfs, low-mass stars, brown dwarfs, ed. I. N. Reid & S. L. Hawley
- Reid et al. (2002) Reid, I. N., Kirkpatrick, J. D., Liebert, J., Gizis, J. E., Dahn, C. C., & Monet, D. G. 2002, AJ, 124, 519
- Reid et al. (2007b) Reid, I. N., Turner, E. L., Turnbull, M. C., Mountain, M., & Valenti, J. A. 2007b, ApJ, 665, 767
- Reiners et al. (2009) Reiners, A., Basri, G., & Browning, M. 2009, ApJ, 692, 538
- Riaz et al. (2006) Riaz, B., Gizis, J. E., & Harvin, J. 2006, AJ, 132, 866
- Schmitt et al. (1995) Schmitt, J. H. M. M., Fleming, T. A., & Giampapa, M. S. 1995, ApJ, 450, 392
- Shkolnik et al. (2009) Shkolnik, E., Liu, M. C., & Reid, I. N. 2009, ApJ, 699, 649
- Shkolnik et al. (2008) Shkolnik, E., Liu, M. C., Reid, I. N., Hebb, L., Cameron, A. C., Torres, C. A., & Wilson, D. M. 2008, ApJ, 682, 1248
- Skrutskie et al. (2006) Skrutskie, M. F., et al. 2006, AJ, 131, 1163
- Slesnick et al. (2006) Slesnick, C. L., Carpenter, J. M., & Hillenbrand, L. A. 2006, AJ, 131, 3016
- Southworth et al. (2007) Southworth, J., Bruntt, H., & Buzasi, D. L. 2007, A&A, 467, 1215
- Tingley (2003) Tingley, B. 2003, A&A, 408, L5
- Torres et al. (2006) Torres, C. A. O., Quast, G. R., da Silva, L., de La Reza, R., Melo, C. H. F., & Sterzik, M. 2006, A&A, 460, 695
- Torres et al. (2009) Torres, G., Andersen, J., & Gimenez, A. 2009, ArXiv e-prints
- Voges et al. (1999) Voges, W., et al. 1999, A&A, 349, 389
- West et al. (2008) West, A. A., Hawley, S. L., Bochanski, J. J., Covey, K. R., Reid, I. N., Dhital, S., Hilton, E. J., & Masuda, M. 2008, AJ, 135, 785
- West et al. (2009) West, R. G., et al. 2009, AJ, 137, 4834
- Worley & Douglass (1997) Worley, C. E., & Douglass, G. G. 1997, A&AS, 125, 523
- Zahn (1977) Zahn, J.-P. 1977, A&A, 57, 383
- Zechmeister & Kürster (2009) Zechmeister, M., & Kürster, M. 2009, A&A, 496, 577
| Name | RA & DEC | SpTint | logaaJ band fluxes calculated here use the full 2MASS bandwidth of 0.29 . | HJD | Dist.bbPhotometric distances from Reid et al. (2002, 2007a) were corrected for the over-luminosity of the binary system. | BinarityccThose targets with directions in parentheses were resolved as visual binaries (VB) at the telescope. Those without directions, are listed as VBs in the Washington Visual Double Star Catalog (Worley & Douglass, 1997). Eclisping SBs are designated as “ESB?”. | |||
|---|---|---|---|---|---|---|---|---|---|
| J2000 | M–() | USNO | 2MASS | km s-1 | –2450000 | pc | |||
| 2MASS J00080642+4757025 | 00 08 06.4 +47 57 02.0 | 3.6 | 10.1 | 8.523 | -2.387 | -29.64 0.44 | 3961.10494 | 16.2 1.9 | SB2 |
| LHS 6032 | 01 45 18.2 +46 32 07.8 | 1.7 | 9.94 | 8.058 | -2.130 | 17.85 0.69 | 4288.12715 | 26.7 2.7 | SB2, VB (NE) |
| G 274-113 | 01 53 11.3 -21 05 43.0 | 1.3 | 10.04 | 8.066 | -2.384 | 14.48 0.51 | 4378.96250 | 28.6 2.0 | SB2 |
| NLTT 6638 | 01 59 12.6 +03 31 11.3 | 2.5 | – | 7.998 | -2.413 | -9.48 0.74 | 4288.13890 | 11.2 2.7 | SB2, VB (NE) |
| GJ 3129 | 02 02 44.2 +13 34 33.0 | 4.7 | 10.9 | 9.652 | -2.225 | -12.94 0.60 | 4378.98460 | 22.7 2.2 | SB2 |
| GJ 3236 | 03 37 14.1 +69 10 49.8 | 4.1 | 10.91 | 9.806 | -2.279 | 16.95 3.55 | 4155.81744 | 22.0 2.7 | SB2 |
| NLTT 11415 | 03 37 33.4 +17 51 14.5 | 1.9 | 9.85 | 9.1 | -2.291 | 40.22 0.51 | 4155.82919 | 31.3 2.7 | SB2, VB of GJ3240B |
| GJ 3240 B | 03 37 33.9 +17 51 00.4 | 4.3 | 10.19 | 9.186 | -2.256 | 38.25 3.57 | 3725.98033 | 21.9 2.7 | E?SB2, VB |
| 2MASS J04244260-0647313 | 04 24 42.6 -06 47 31.0 | 5.2 | 10.93 | 9.566 | -2.066 | 13.05 0.77 | 3726.00509 | 17.9 1.6 | SB3 |
| CCDM J04404+3127B | 04 40 23.0 +31 26 46.2 | 4.5 | 11.22 | 10.023 | -2.359 | 41.73 1.19 | 3726.03777 | 30.5 2.7 | ESB2, VB |
| GJ 206 | 05 32 14.7 +09 49 15.0 | 4.1 | 9.7 | 7.423 | -2.391 | 20.66 0.63 | 3726.08132 | 12.8 0.6ddDistances using trigonometric parallaxes from the Hipparcos & Tycho Catalogues (Perryman & ESA 1997). | SB2 |
| GJ 3362 | 05 40 16.1 +12 39 00.8 | 1.4 | 10.38 | 8.072 | -2.400 | 95.12 1.68 | 3726.08645 | 24.2 2.7 | SB2 |
| G 108-4 | 06 29 50.2 -02 47 45.0 | 5.7 | 10.76 | 9.468 | -2.266 | 83.59 0.38 | 3726.11372 | 37.6 2.2 | SB2 |
| 2MASS J07282116+3345127 | 07 28 21.2 +33 45 12.0 | 3.9 | 10.45 | 9.28 | -2.444 | 11.34 1.04 | 3866.72743 | 32.7 3.7 | SB2 |
| LHS 5134 | 08 08 13.6 +21 06 09.0 | 2.6 | – | 7.336 | -2.327 | 82.87 0.75 | 3726.12839 | 17.1 0.8ddDistances using trigonometric parallaxes from the Hipparcos & Tycho Catalogues (Perryman & ESA 1997). | SB2, VB |
| 2MASS J08082487+4347557 | 08 08 24.9 +43 47 55.0 | 5.5 | 12.56 | 10.493 | -2.267 | 72.95 0.57 | 3726.12411 | 22.4 2.6 | SB2 |
| GJ 1108 B | 08 08 55.4 +32 49 04.7 | 3.0 | – | 7.999 | -2.053 | 12.12 0.70 | 3866.77237 | 20.7 1.5ddDistances using trigonometric parallaxes from the Hipparcos & Tycho Catalogues (Perryman & ESA 1997). | SB2, VB |
| GJ 3547 | 09 19 22.9 +62 03 16.8 | 0.0 | 9.99 | 8.168 | -2.530 | 68.52 1.21 | 3866.82837 | 32.5 2.8ddDistances using trigonometric parallaxes from the Hipparcos & Tycho Catalogues (Perryman & ESA 1997). | SB2 |
| GJ 3630 | 10 52 03.3 +00 32 38.3 | 4.8 | 10.71 | 9.426 | -2.040 | 25.88 1.35 | 3726.14401 | 19.0 2.7 | SB3 |
| 2MASS J12065663+7007514 | 12 06 56.6 +70 07 51.4 | 3.9 | 9.1 | 9.251 | -2.296 | -21.81 0.53 | 4455.04585 | 16.8 1.9 | SB2, VB (W) |
| 2MASS J14204953+6049348 | 14 20 49.5 +60 49 34.0 | 3.5 | 11.16 | 10.06 | -2.473 | -23.15 0.85 | 3960.75723 | 44.6 5.1 | SB2 |
| GJ 616.2 | 16 17 05.4 +55 16 09.0 | 1.2 | 8.55 | 6.6 | -2.487 | -28.25 0.92 | 3960.79603 | 20.7 0.5ddDistances using trigonometric parallaxes from the Hipparcos & Tycho Catalogues (Perryman & ESA 1997). | SB2, VB |
| HAT 199-13890 | 19 31 12.6 +36 07 30.0 | 5.1 | 10.88 | 9.609 | -2.020 | -22.31 1.24 | 3867.04116 | 21.7 1.8 | SB2, VB |
| NLTT 48838 | 20 10 34.5 +06 32 14.1 | 3.6 | 9.6 | 8.021 | -2.186 | -52.15 1.25 | 3960.87589 | 15.3 2.7 | SB2 |
| 2MASS J21021569-3129118 | 21 02 15.6 -31 29 11.0 | 4.3 | 11.26 | 9.853 | -2.384 | -6.98 0.42 | 3867.12034 | 16.9 2.2 | SB2 |
| LSPM J2114+1254 | 21 14 49.1 +12 54 00.2 | 5.5 | 11.21 | 9.908 | -2.358 | -58.58 0.50 | 3867.11455 | 27.8 2.7 | SB2 |
| BD -225866 | 22 14 38.4 -21 41 53.0 | 0.0 | 9.21 | 7.54 | -2.713 | -14.07 2.43 | 3867.12294 | 40.1 3.2 | ESB4 |
| G 67-46 | 23 06 23.8 +12 36 26.7 | 0.7 | 10.45 | 8.375 | -2.356 | -3.53 0.96 | 3960.96632 | 34.3 2.7 | SB2(3?), VB |
| GJ 4359 | 23 43 59.5 +64 44 28.9 | 0.8 | 10.1 | 8.149 | -2.386 | 14.56 1.08 | 3960.98538 | 28.9 1.7ddDistances using trigonometric parallaxes from the Hipparcos & Tycho Catalogues (Perryman & ESA 1997). | SB2 |
| GJ 4362 | 23 48 36.0 -27 39 38.0 | 2.1 | 9.86 | 8.584 | -2.448 | 25.30 0.55 | 3961.08236 | 24.6 1.9 | SB2 |
| Name | SpT | MassaaMasses were derived from the component spectral types using data from Reid & Hawley (2005). | RV | bbRotation periods as observed by WASP photometry. The period uncertainty is 0.1 days. | ||||
|---|---|---|---|---|---|---|---|---|
| M–() | km s-1 | days | days | AU | Gyr | |||
| 2MASS J00080642+4757025 A | 3.6 | 0.2 | 1.00 | 17.01 0.33 | 4.38 | 4.4cc for 2M0008+4757 and G274-113 is 4.63 and 3.63 days, respectively. | 0.04 | 0.151 |
| 2MASS J00080642+4757025 B | 3.5 | 0.2 | -76.30 0.29 | |||||
| LHS 6032 A | 1.9 | 0.44 | 1.00 | 36.56 0.53 | 4.05 | 157.9 | 0.56 | 10 |
| LHS 6032 B | 1.6 | 0.44 | -0.86 0.45 | |||||
| G 274-113 A | 1.1 | 0.49 | 1.00 | -53.72 0.25 | 2.90 | 2.9cc for 2M0008+4757 and G274-113 is 4.63 and 3.63 days, respectively. | 0.04 | 0.027 |
| G 274-113 B | 1.4 | 0.49 | 82.68 0.44 | |||||
| NLTT 6638 A | 2.2 | 0.44 | 0.82 | -23.29 0.67 | 31.10 | 356.4 | 0.93 | 10 |
| NLTT 6638 B | 3.0 | 0.36 | 4.34 0.31 | |||||
| GJ 3129 A | 4.4 | 0.2 | 0.70 | -37.25 0.47 | 4.00 | 27.8 | 0.13 | 10 |
| GJ 3129 B | 5.2 | 0.14 | 11.36 0.38 | |||||
| GJ 3236 A | 3.8 | 0.2 | 1.00 | 45.39 2.90 | no data | 20.4 | 0.11 | 10 |
| GJ 3236 B | 4.4 | 0.2 | -11.49 2.05 | |||||
| NLTT 11415 A | 1.5 | 0.49 | 0.41 | 11.20 0.17 | not variable | 33.2 | 0.18 | 10 |
| NLTT 11415 B | 3.6 | 0.2 | 69.25 0.48 | |||||
| GJ 3240 Ba | 4.2 | 0.2 | 1.00 | -66.23 2.81 | not variable | 0.4 | 0.01 | 1.E-05 |
| GJ 3240 Bb | 4.3 | 0.2 | 142.72 2.20 | |||||
| 2MASS J04244260-0647313 A | 4.5 | 0.17 | 0.77 | -11.86 0.38 | no data | 70.3 | 0.25 | 10 |
| 2MASS J04244260-0647313 Ba | 5.5 | 0.12 | 0.83 | 77.03 0.78 | 1.9 | 0.02 | 0.011 | |
| 2MASS J04244260-0647313 Bb | 5.7 | 0.1 | -26.03 0.67 | |||||
| CCDM J04404+3127 Ba | 4.2 | 0.2 | 0.70 | -7.78 0.64 | 2.048 (EB) | 2.0 | 0.02 | 0.011 |
| CCDM J04404+3127 Bb | 5.0 | 0.14 | 91.24 1.00 | |||||
| GJ 206 A | 3.9 | 0.2 | 1.00 | 0.93 0.34 | 7.60 | 61.1 | 0.23 | 1.4 |
| GJ 206 B | 4.3 | 0.2 | 40.40 0.52 | |||||
| GJ 3362 A | 1.1 | 0.49 | 0.90 | 75.23 1.43 | no data | 138.9 | 0.52 | 10 |
| GJ 3362 B | 2.0 | 0.44 | 115.01 0.88 | |||||
| G 108-4 A | 5.0 | 0.14 | 0.71 | 101.78 0.28 | no data | 46.9 | 0.16 | 10 |
| G 108-4 B | 6.3 | 0.1 | 65.41 0.26 | |||||
| 2MASS J07282116+3345127 A | 3.9 | 0.2 | 1.00 | -1.30 0.79 | 3.55 | 232.7 | 0.55 | 10 |
| 2MASS J07282116+3345127 B | 3.9 | 0.2 | 23.98 0.67 | |||||
| LHS 5134 A | 2.4 | 0.44 | 0.82 | 66.52 0.31 | 9.70 | 215.0 | 0.66 | 6.5 |
| LHS 5134 B | 3.1 | 0.36 | 99.23 0.69 | |||||
| 2MASS J08082487+4347557 A | 5.1 | 0.14 | 0.71 | 16.21 0.48 | not variable | 1.5 | 0.02 | 0.062 |
| 2MASS J08082487+4347557 B | 6.1 | 0.1 | 129.70 0.30 | |||||
| GJ 1108 Ba | 2.8 | 0.36 | 1.00 | -1.06 0.53 | 3.38 | 395.5 | 0.92 | 10 |
| GJ 1108 Bb | 3.3 | 0.36 | 25.30 0.45 | |||||
| GJ 3547 A | -0.1 | 0.6 | 1.00 | 27.36 0.93 | no data | 20.2 | 0.16 | 10 |
| GJ 3547 B | 0.1 | 0.6 | 109.68 0.77 | |||||
| GJ 3630 A | 4.3 | 0.2 | 0.91 | 26.14 1.27 | not variable | 6E7 | 2313 | 10 |
| GJ 3630 Ba | 5.5 | 0.12 | 0.83 | -16.58 0.45 | 28.1 | 0.11 | 10 | |
| GJ 3630 Bb | 6.1 | 0.1 | 68.06 0.65 | |||||
| 2MASS J12065663+7007514 A | 3.9 | 0.2 | 1.00 | 34.13 0.38 | no data | 2.7 | 0.03 | 0.024 |
| 2MASS J12065663+7007514 B | 3.9 | 0.2 | -77.75 0.37 | |||||
| 2MASS J14204953+6049348 A | 3.2 | 0.36 | 0.56 | -33.76 0.75 | no data | 0.4 | 0.01 | 3E-5 |
| 2MASS J14204953+6049348 B | 3.8 | 0.2 | -12.54 0.39 | |||||
| GJ 616.2 A | 1.1 | 0.49 | 1.00 | -41.20 0.75 | not variable | 530.6 | 1.30 | 10 |
| GJ 616.2 B | 1.4 | 0.49 | -15.31 0.54 | |||||
| HAT 199-13890 A | 5.0 | 0.14 | 1.00 | -100.14 0.79 | not variable | 0.7 | 0.01 | 0.002 |
| HAT 199-13890 B | 5.1 | 0.14 | 55.53 0.96 | |||||
| NLTT 48838 A | 3.5 | 0.36 | 0.56 | -77.56 0.67 | 1.12 | 40.1 | 0.19 | 10 |
| NLTT 48838 B | 3.8 | 0.2 | -26.75 1.05 | |||||
| 2MASS J21021569-3129118 A | 4.4 | 0.2 | 1.00 | -32.70 0.30 | not variable | 27.6 | 0.13 | 10 |
| 2MASS J21021569-3129118 B | 4.2 | 0.2 | 18.74 0.30 | |||||
| LSPM J2114+1254 A | 5.3 | 0.14 | 0.71 | -104.46 0.31 | not variable | 2.9 | 0.03 | 0.792 |
| LSPM J2114+1254 B | 5.9 | 0.1 | -12.70 0.40 | |||||
| BD -225866 AaddObservations of this ESB4 are published in Shkolnik et al. (2008). | -0.5 | 0.5881 | 1.00 | -68.97 2.37 | 2.21 (EB) | 2.21107 | 0.0351 | 0.131 |
| BD -225866 Ab | -0.5 | 0.5881 | 58.35 0.72 | |||||
| BD -225866 Ba | 1.0 | 0.49 | 0.90 | -40.23 0.53 | 62 | 0.3 | ||
| BD -225866 Bb | 2.0 | 0.44 | -5.41 0.68 | |||||
| G 67-46 A | 0.3 | 0.6 | 0.82 | -31.45 0.78 | 5.00 | 58.9 | 0.31 | 10 |
| G 67-46 B | 1.4 | 0.49 | 24.39 0.56 | |||||
| GJ 4359 A | 0.4 | 0.6 | 0.73 | -59.78 1.02 | no data | 3.0 | 0.04 | 0.017 |
| GJ 4359 B | 2.1 | 0.44 | 88.89 0.33 | |||||
| GJ 4362 A | 1.7 | 0.44 | 0.82 | -10.32 0.14 | 11.15 | 20.8 | 0.14 | 11.403 |
| GJ 4362 B | 3.2 | 0.36 | 60.92 0.53 |
| Name | N data | Date begin | Date end | PeriodaaThe period uncertainty is 0.1 days. | Amplitude | aaThe period uncertainty is 0.1 days. | Year | Note |
|---|---|---|---|---|---|---|---|---|
| Points | HJD-2450000 | HJD-2450000 | days | mag | ||||
| 2MASS J00080642+4757025 | 5381 | 4306.58 | 4451.50 | 4.38 | 0.022 | 0.48 | 2007 | |
| LHS 6032 | 4118 | 4332.58 | 4460.52 | 4.05 | 0.008 | 0.36 | 2007 | |
| G 274-113 | 5856 | 4677.52 | 4813.45 | 2.89 | 0.006 | 0.30 | 2008 | |
| GJ 3129 | 1009 | 4733.52 | 4767.65 | 4.01 | 0.089 | 1.07 | 2008 | |
| GJ 206 | 4662 | 4752.58 | 4863.47 | 7.59 | 0.013 | 0.89 | 2008-9 | |
| 2MASS J07282116+3345127 | 9658 | 4056.55 | 4172.50 | 3.57 | 0.028 | 0.69 | 2006 | |
| 714 | 4405.58 | 4455.75 | 3.55 | 0.044 | 0.30 | 2007 | ||
| 602 | 4491.40 | 4554.46 | 3.54 | 0.042 | 1.41 | 2008 | ||
| 2MASS J08082487+4347557 | 6784 | 4056.58 | 4172.50 | 9.70 | 0.005 | 0.29 | 2006 | |
| GJ 1108 B | 5616 | 4056.59 | 4172.50 | 3.37 | 0.030 | 2.48 | 2006 | |
| 698 | 4056.59 | 4172.50 | 3.37 | 0.048 | 11.46 | 2007 | ||
| 729 | 4491.39 | 4554.42 | 3.40 | 0.027 | 4.38 | 2008 | ||
| NLTT 48838 | 1780 | 4297.45 | 4369.40 | 1.12 | 0.040 | 1.98 | 2007 | with no systematics |
| BD -225866 | 4579 | 3862.58 | 4052.31 | 2.20 | 0.019 | 1.57 | 2006 | Eclipsing |
| 4557 | 4250.53 | 4418.34 | 2.20 | 0.029 | 4.61 | 2007 | ||
| 5509 | 4622.51 | 4764.41 | 1.10 | 0.006 | 0.21 | 2008 | period harmonic detected at 1/2 , marginal | |
| G 67-46 | 2555 | 4672.56 | 4767.52 | 5.00 | 0.015 | 1.20 | 2008 | |
| GJ 4362 | 5068 | 3870.61 | 4054.47 | 11.13 | 0.024 | 1.42 | 2006 | |
| 5722 | 4268.53 | 4433.44 | 11.16 | 0.026 | 1.10 | 2007 |
| Name | N data | Date begin | Date end | Year | Notes | ||
|---|---|---|---|---|---|---|---|
| Points | HJD-2450000 | HJD-2450000 | |||||
| NLTT 6638 | 11664 | 4677.52 | 4813.45 | 0.13 | 2008 | VB blended in SWASP data | |
| GJ 3240 | 2269 | 3995.58 | 4125.39 | 0.13 | 2007 | blended with J033733.35+175114.3 | |
| NLTT 11415 | 2269 | 3995.58 | 4125.39 | 0.12 | 2007 | blended with J033733.88+175100.6 | |
| 2MASS J04244260-0647313 | 588 | 4491.32 | 4503.46 | 0.14 | 2008, early | ||
| 692 | 4721.50 | 4760.75 | 0.01 | 2008, late | |||
| CCDM J04404+3127B | 949 | 3219.73 | 3278.76 | 0.10 | 2004 | Eclipsing, no detectable rotational signal, blended | |
| 2524 | 3995.59 | 4147.48 | 0.06 | 2006 | |||
| 1189 | 4372.59 | 4460.64 | 0.06 | 2007 | |||
| 2MASS J08082487+4347557 | 1490 | 4419.60 | 4455.75 | 0.02 | 2007 | ||
| 3865 | 4491.39 | 4554.43 | 0.02 | 2008 | |||
| GJ 3630 | 2071 | 4501.52 | 4581.44 | 0.03 | 2008 | ||
| GJ 616.2 | 536 | 3920.38 | 3950.52 | 0.09 | 2006 | ||
| 10581 | 4189.59 | 4316.50 | 0.37 | 2007 | 1.99d period, systematics present | ||
| 8051 | 4553.61 | 4681.52 | 0.17 | 2008 | |||
| HAT 199-13890 | 1686 | 4230.59 | 4296.39 | 0.04 | 2007 | ||
| 2MASS J21021569-3129118 | 11471 | 3862.55 | 4037.38 | 0.03 | 2006 | ||
| 1221 | 4236.50 | 4399.41 | 0.10 | 2007 | 1 day period | ||
| CCDM J2114+1254 | 8715 | 3128.66 | 3278.56 | 0.04 | 2004 | ||
| 7953 | 3908.55 | 4023.48 | 0.03 | 2006 |