Photometric and clustering properties of hydrodynamical galaxies in a cosmological volume: results at
Abstract
In this work, we present results for the photometric and clustering properties of galaxies that arise in a cold dark matter hydrodynamical simulation of the local universe. The present-day distribution of matter was constructed to match the observed large scale pattern of the IRAS 1.2-Jy galaxy survey. Our simulation follows the formation and evolution of galaxies in a cosmological sphere with a volume of Mpc3 including supernova feedback, galactic winds, photoheating due to an uniform meta-galactic background and chemical enrichment of the gas and stellar populations. However, we do not consider AGNs. In the simulation, a total of galaxies are formed above the resolution limit, and around haloes are more massive than M⊙. Luminosities of the galaxies are calculated based on a stellar population synthesis model including the attenuation by dust, which is calculated from the cold gas left within the simulated galaxies. Environmental effects like colour bi-modality and differential clustering power of the hydrodynamical galaxies are qualitatively similar to observed trends. Nevertheless, the overcooling present in the simulations lead to too blue and overluminous brightest cluster galaxies (BCGs). To overcome this, we mimic the late-time suppression of star formation in massive halos by ignoring recently formed stars with the aid of a simple post-processing recipe. In this way we find luminosity functions, both for field and group/cluster galaxies, in better agreement with observations. Specifically, the BCGs then follow the observed luminosity-halo mass relation. However, in such a case, the colour bi-modality is basically lost, pointing towards a more complex interplay of late suppression of star formation than what is given by the simple scheme adopted.
keywords:
hydrodynamics - galaxies: formation - evolution - cosmology: theory - methods: numerical1 Introduction
The observational study of galaxy populations has seen an outstanding progress in recent years. With the advent of large galaxy redshift surveys, such as the Sloan Digital Sky Survey (SDSS; York et al. 2000) and the Two-degree Field Galaxy Redshift Survey (2dFGRS; Colless et al. 2001) it was possible to extend our knowledge of the local Universe to a new level of accuracy.
In particular, it has been possible to carry out a robust determination of the luminosity function (LF) for galaxies in the field (Norberg et al. 2002; Blanton et al. 2003) in different spectral bands and to better establish it for those galaxies populating denser environments, such as groups and clusters (e.g. Popesso et al. 2004, 2006). Consistently with previous work (e.g. Lin et al. 1996; Colless et al. 1999) it has been found that the field LF is well described by a single Schechter function requiring, however, a higher value for the luminosity density of the Universe indicating that previous surveys suffered from selection effects and systematics due to photometry (Blanton et al. 2001). For higher density environments, and by means of the RASS-SDSS galaxy cluster survey, Popesso et al. (2004, 2006) found that a double Schechter function better fits the composite cluster LF accounting for a possible upturn in the number of faint objects as the luminosity of member galaxies decrease.
Moreover, the large number of galaxies with measured spectroscopic redshifts, compared to that obtained in the past, has made possible the determination of their two-point clustering properties in a reliable way out to scales of order of tens of Mpc. These studies have shown that the real, projected and redshift-space correlations can be well described by a decreasing power-law function that depends on the sample colour, having a correlation length that increases with absolute magnitude (e.g. Norberg et al. 2001, 2002; Zehavi et al. 2002; Madgwick et al. 2003; Hawkins et al. 2003).
Both the LFs and the clustering properties of the galaxies are tools of fundamental importance in the study of galaxy formation since they provide a way to describe the most basic galaxy statistics. A successful model for structure formation must account for these observations.
From the theoretical point of view, the widely spread semi-analytic models (SAMs) of galaxy formation (e.g. Kauffmann et al. 1999; Springel et al. 2001; Mathis et al. 2002; De Lucia, Kauffmann & White 2004; Springel et al. 2005; Bower et al. 2006; Cattaneo et al. 2006; Croton et al. 2006; Lagos, Cora & Padilla 2008; Fontanot et al. 2009; Guo & White 2009) provide a way to study the properties of galaxy populations with the advantage of a rapid exploration of the parameter space. In this approach, the galaxy population is followed within the skeleton provided by a parent dark matter simulation with the aid of physically motivated recipes to describe the different baryonic processes involved. These studies have pointed out the need of limiting excessive gas condensation in massive haloes to avoid the formation of very bright central galaxies (also known as brightest cluster galaxies; BCGs) that are inconsistent with observation. The usually invoked channel responsible for the star formation (SF) quenching in massive haloes is the active galactic nucleus (AGN) phenomenon. Similarly, it has been noted that in order to prevent an excess luminosity in the faint end of the galaxy field LF, a relatively strong SN feedback would be needed in smaller systems.
On the other hand, cosmological hydrodynamical simulations of galaxy samples, without including the effects of AGN feedback, have also been used to study the building up of the structure and their resulting properties in periodic boxes (e.g. Pearce et al. 2001; White et al. 2001; Yoshikawa et al. 2001; Oppenheimer & Davé 2006, 2008; Davé & Oppenheimer 2007; Ocvirk et al. 2008). In a similar way, using the dubbed zooming technique, several authors simulated hydrodynamical galaxies within high-resolution regions in a cosmological framework (e.g. Dolag et al. 2005; Saro et al. 2006, 2008, 2009; Crain et al. 2009). In particular, Saro et al. (2006) resimulated a set of galaxy clusters studying the composite cluster LF and the environmental induced galaxy properties in these high density regions. These authors show that it is possible to reproduce the general observed trends of the cluster galaxy population, including, e.g. the colour-magnitude relation, the age and colour cluster-centric distance dependence and the cluster LF (although the bright-end is affected by the presence of very bright BCGs).

The present work makes use of the same zooming technique to simulate the observed local volume following the chemical enrichment of gas and stars until the present epoch. This enables us to estimate in a consistent way the luminosities and colours of galaxies formed in hydrodynamical simulations. The simulated volume is big enough to compute LFs, both for field and group/cluster galaxies, as well as galaxy correlation functions. In order to infer the way feedback acts in massive haloes (e.g. AGN feedback), we use a similar approach as SAMs, applying a simple recipe to the post-processed data of the simulation at . In this way, we ignore a fraction of the late-formed stars which would not appear in such a scenario and study the resulting effects on the luminosity-dependent properties of the simulated galaxies. It is important to note that, within the simple post-processing scheme adopted here, the simulations are no longer fully self-consistent, as also stars which are quenched by our post-processing procedure still interact with the surrounding medium. However, this effect is not expected to change our results significantly and can only be accessed with the next generation of hydrodynamical simulations including sub-scale models for AGN feedback more directly.
The paper is organized as follows. In Section 2 we describe the hydrodynamical cosmological simulation, together with the method used to compute galaxy luminosities and the associated dust-obscuration. In Section 3 we show the main results, presenting luminosities (for field and group/cluster galaxies), galaxy colours and correlation functions. We also discuss the implemented recipe to suppress SF in massive haloes. Finally, we close the paper with a summary and our conclusions in Section 4.
| Model | ||
|---|---|---|
| [km s-1] | [km s-1] | |
| 1 | 100 | 150 |
| 2 | 100 | 200 |
| 3 | 100 | 250 |
| 4 | 150 | 150 |
| 5 | 150 | 200 |
| 6 | 150 | 250 |
| 7 | 200 | 150 |
| 8 | 200 | 200 |
| 9 | 200 | 250 |
2 The simulation
The cosmological simulation analyzed in this paper was generated to reproduce the large scale distribution of matter in the local universe within the context of a flat CDM scenario. The cosmological parameters at present time are a matter density parameter , a baryon density parameter , a Hubble constant km s-1 Mpc-1 with , and a rms density fluctuation , which correspond to the Wilkinson Microwave Anisotropy Probe (WMAP) 1 year best-fitting cosmology (Spergel et al. 2003).
In order to reproduce the local matter density field, the galaxy distribution in the IRAS 1.2-Jy galaxy survey (Fisher et al. 1994, 1995) was Gaussianly smoothed on a scale of 7 Mpc and then linearly evolved back in time up to with the method proposed by Kolatt et al. (1996). The resulting high redshift field is then used as a Gaussian constraint (Hoffman & Ribak 1991) to assign the unperturbed positions of million gas and dark matter particles that are arranged on a glass-like distribution (e.g. Baugh, Gaztañaga & Efstathiou 1995). The mass of gas and dark matter particles is set to and M⊙ respectively. Every gas particle is able to produce three generations of stars, which results in a star particle mass of M⊙.
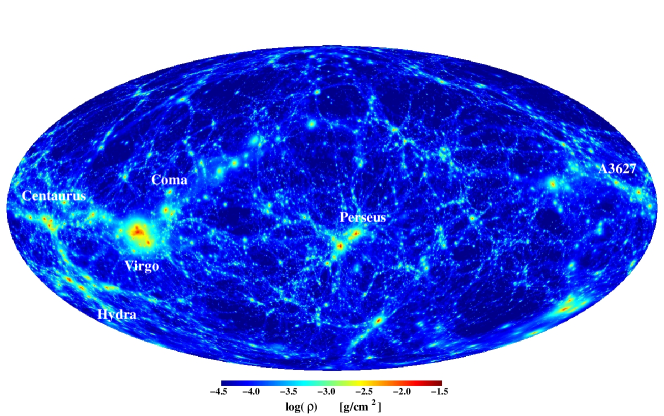
We follow the evolution of the collisionless and gas components within a sphere with a comoving diameter of Mpc that is embedded in a periodic cosmological box of Mpc on a side. This makes the volume of the simulated universe a factor of times larger than in previous studies (e.g. Pearce et al. 2001). The region outside the sphere is sampled with million low resolution dark matter particles, that allow us to asses the effect of long-range gravitational tidal forces. The comoving softening length for gravitational forces is set to 7 kpc (Plummer equivalent), value that is similar to the average particle separation in the cores of the densest simulated clusters. In Fig. 1, we show the projected gas density distribution of the simulated local sphere.
The simulation was run using GADGET-2 (Springel & Hernquist 2002, 2003; Springel 2005) which is a Tree-smoothed particle hydrodynamics (SPH) code that fully conservates entropy during the evolution of the gas component, taking into account radiative cooling, heating by an ultraviolet (UV) meta-galactic background to emulate the reionization era (Haardt & Madau 1996), and a subresolution scheme to treat SF, SN feedback and galactic winds. In particular, the set of parameters of the phenomenological wind model was chosen to obtain a escape velocity of km s-1. For the SF recipe we assume that each star particle of the simulation is a single stellar population (SSP) where the relative number of stars with different masses is obtained by means of the initial mass function (IMF), which in this work is that of Salpeter (1955) normalized in the 0.1–100 M☉ mass range.
The metal content of gas the and stellar components is followed using the model presented in Tornatore et al. (2004; see also Tornatore et al. 2007). This scheme accounts for stellar evolution assessing the effect of the generation of Type II and Type Ia SN events (SNII and SNIa respectively), as well as of massive stars ending up their life in the asymptotic giant branch phase. These events release energy and metals to the surrounding medium according to the stellar lifetimes of the different populations (Maeder & Meynet 1989) and to the SNIa rate (Matteucci & Recchi 2001). It is assumed that energy feedback is only provided by SNs ( erg per event), while metals are distributed in all cases following the production of Fe, O, C, Si, Mg and S using the stellar yields found in Recchi, Matteucci & D’Ercole (2001). In addition, the local cooling rate for each gas particle is self-consistently determined from its estimated [Fe/H] abundance and temperature using the tables given by Sutherland & Dopita (1993). At each time step, the network of primordial species is solved assuming that photoionization only acts on them. In this regard, we expect that metal photoionization will have only a minor impact at the resolution covered by our simulation.
Bound systems at the present time are identified using the SUBFIND algorithm (e.g. Springel et al. 2001; Dolag et al. 2009). Firstly, haloes having more than 32 dark matter particles are selected using the friends-of-friends (FoF) algorithm with a linking length of 0.2 in units of the mean interparticle separation. Then, a total of 20, self bound, particles (ignoring gas particles) is set as a lower limit to identify substructures present in each FoF group that may be elegible as galaxies. As the detection of substructures is difficult at the low mass-end, we consider as numerically resolved galaxies only substructures in the simulation having more than 32 star particles, which results in a stellar mass resolution limit of M⊙.
2.1 Luminosity of galaxies
2.1.1 Stellar population synthesis
Similar to Saro et al. (2006), we compute the luminosities of our simulated galaxies using the stellar population synthesis model of Bruzual & Charlot (2003) in different spectral bands. As mentioned in the previous section, each star particle is treated as a SSP with a formation time that corresponds to redshift and metallicity content . For every galaxy, this enable us to sum up the luminosity contributions of each stellar population in the following way
| (1) |
where is the wavelength of radiation, e is the extinction factor due to the presence of dust (see e.g. Bruzual & Charlot 2003), and is the wavelength-dependent optical depth of the obscuring medium (see next section).
To compute the luminosities we use only stars inside the galactocentric distance that contains 83% of the galaxy’s baryonic mass, the so-called optical radius (e.g. Nuza et al. 2007). We have checked that adopting this condition has a negligible effect on the final absolute magnitudes.
2.1.2 Attenuation by dust
In order to asses the effect of dust in the luminosity of galaxies we apply a similar procedure to Saro et al. (2009) to our hydrodynamical galaxies. The extinction model assumed is the one of Charlot & Fall (2000). These authors considered a scenario where the radiation of newly born stars ( yr) is attenuated by the presence of dust in their birth cloud. Older stellar populations are able to migrate out of the molecular clouds and, as a consequence, are mainly affected by the ambient ISM. Therefore, we assume the following age-dependent extinction curve
| (2) |
where is the optical depth in the -band, is the wavelength of radiation, and is the fraction of the effective optical depth due to the ISM. In this paper we take randomly from a Gaussian distribution centered in 0.3 with a width of 0.2 and truncated at 0.1 and 1 in a similar way as done in previous works (e.g. De Lucia & Blaizot 2007).
Following Guiderdoni & Rocca-Volmerage (1987) we assume that is proportional to the column density of cold gas in the line of sight having mean metallicity . In particular, for the wavelengths of interest here, we can write
| (3) |
where is the hydrogen column density and the mean gas metallicity exponent is equal to (valid for nm; see Guiderdoni & Rocca-Volmerage for details).
To estimate the spatial dependence of for our simulated galaxies we project their gas content onto a plane (say ) with the aim at averaging the cold gas distribution as a function of projected distance to the centre. Using the obtained radial profile we compute the differential dust-attenuated luminosity contributed by every star particle in a given point using its -position as a proxy of its obscuration level, i.e. proportional to the amount of intervening cold gas between them and the galaxy outskirts. As a consequence, star particles behind the parent galaxy receive the total attenuation corresponding to its radial position , while those ahead are almost not attenuated at all. The luminosity of stellar populations with intermediate -positions is accordingly affected.
As an example, in the top panel of Fig. 2 we show the visible optical depth averaged over projected radial bins in one of the most massive galaxies present in the simulation. As stated above, this quantity depend both on metallicity and column density of cold gas present in the system, hence, the visible optical depth tends to be higher in the inner regions of our hydrodynamical galaxies. This is due to the fact that, in the simulation, the galactic central regions tend to have higher column densities with highly enriched gas. In the bottom panel, we plot the fraction of luminosity attenuation for star particles in both - and -bands as a function of central distance (open and filled circles respectively). As expected, it can be seen that the attenuation correlates with the optical depth profile and that it is stronger for bluer bands.
Finally, we integrate over all stellar populations in order to estimate a global corrected magnitude for each galaxy in the volume (see Eq. 1). In the rest of the paper we will always use dust-attenuated quantities unless explicitly stated.
3 Results
3.1 Luminosity functions
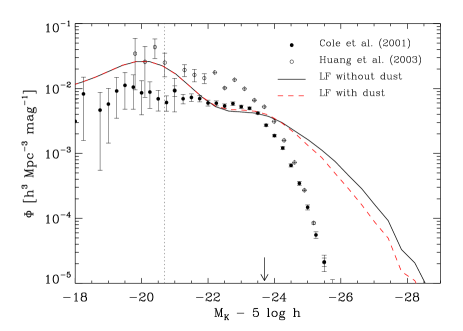
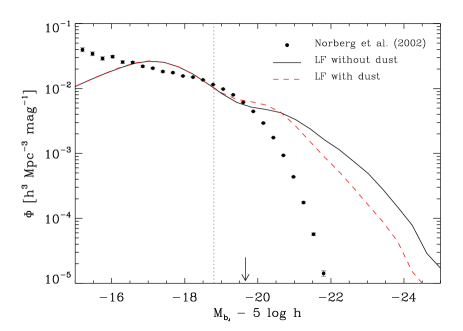
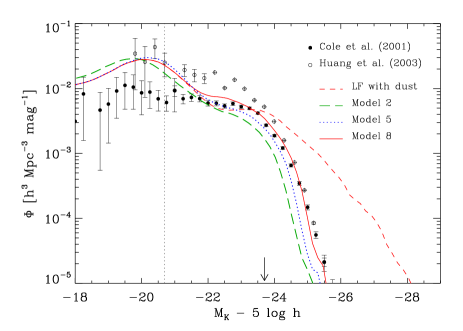
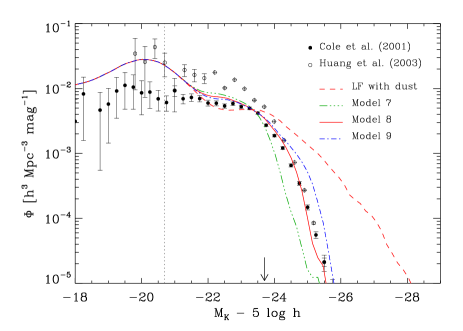
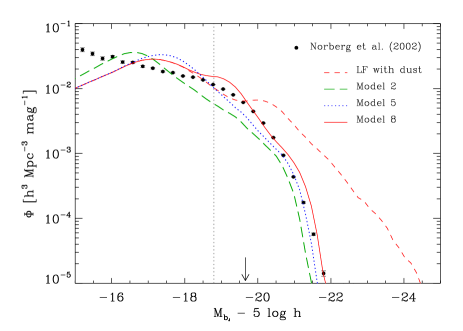
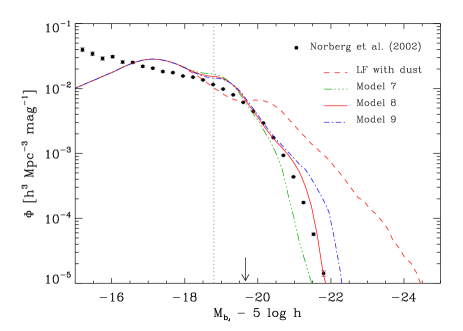
In Fig. 3 we plot the - and -band LFs both for the simulated galaxies at and for the observed local ones determined by Cole et al. (2001), Huang et al. (2003) and Norberg et al. (2002) respectively. In order to match observations at we renormalized our model LFs in each case. In relation to this, we note that the number density of galaxies in our simulation gives a value roughly two times smaller than what is observed in each band. This fact is also consistent with the number density we obtain for simulated galaxies having a typical stellar mass value when comparing with the local stellar mass function (e.g. Li & White 2009). This can be due to several reasons. Firstly, the background cosmology gives a baryon fraction which is smaller than what latest observations suggest. Secondly, the underlying numerical resolution adopted here (due to the large volume captured) can affect the assembly of small mass systems, thus preventing them of being the building blocks of more massive galaxies. These two facts combined could give rise to less galaxies of a given stellar mass. However, it is interesting to note that this is in line with the findings by Saro et al. (2006), where a similar deficit for galaxies within clusters was found, i.e. galaxy number above a given magnitude threshold tends to be smaller than observations by a factor of a few.
To show the effect of our dust implementation we plot both the attenuated (dashed line) and non-attenuated (solid line) LFs. As expected, the dust extinction is more important in the -band mainly affecting in this case to the brightest (and gas-rich) systems. As can be seen in this figure, the simulations are not able to reproduce the bright-end of the LFs given by the observations. This is due to gas cooling excess onto the dark matter potential wells that leads to an overproduction of stars in the most massive objects. As mentioned in the introduction, this behavior was first pointed out by SAMs indicating the need of a mechanism capable of supressing SF as a function of time and halo mass. Nowadays, there is a growing body of evidence, both from theory and observations, that AGN feedback can play an important role in this respect (e.g. Bower et al. 2006; Croton et al. 2006; Rafferty et al. 2006; Malbon et al. 2007; Khalatyan et al. 2008; Lagos, Cora & Padilla 2008; Cattaneo et al. 2009), although the subject is far from being completely understood.
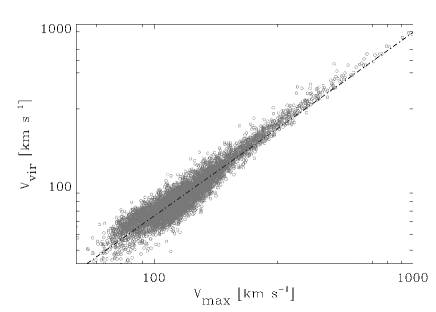
In the same spirit of early SAMs (see below), we approximate the SF suppression in massive haloes ignoring a given fraction of the formed stars, using the stellar population ages and the maximum circular velocities of the parent galaxies present in the selected subhaloes of SUBFIND as a proxy. The maximum circular velocities serve as a measure of subhalo mass and, hence, they can be used to estimate the virial velocity of the systems. The relation between the maximum circular velocity and the virial velocity for haloes in the simulation can be seen in Fig. 4. For each resolved galaxy, we apply a selective cutoff to the stellar populations that were born at different epochs to mimic the required SF suppression and test for its effect on the LFs and other observables. For the sake of simplicity, we assume a linear relationship between the subhalo maximum circular velocity and the redshift from which we do not take into account the newly-formed stars , as follows
| (4) |
where and are free parameters. Although it is a very simplified parametrization aiming at reconciling the bright-end’s LF problem, it should allow to explore the behavior of SF suppression in a simple way. Given a () pair, the net result of this recipe is to only affect systems above the velocity limit given by the zero point of the relation , regulating the strength of the suppression with its slope . The different models explored for this suppression scheme can be seen in Table 1.
This procedure is similar to what was done in earlier semi-analytic work, where switching off gas cooling in haloes over a certain mass threshold was a common procedure to avoid excessive star formation (e.g. Kauffmann et al. 1999; Hatton et al. 2003; Cora 2006; Cattaneo et al. 2006). Nevertheless, it is fair to note that in our simple scheme, it is not possible to ignore the non-trivial interaction between the non-selected stars in a given halo and the surrounding medium for , which will mainly affect the column density estimates for the suppressed systems. For instance, the effect of SN feedback due to the ignored stars is able to heat up the surrounding gas lowering the cold gas fraction. In the same way, the presence of these stars in the simulation will also pollute the gas phase with more chemical elements, accordingly affecting the dust properties of the medium. However, within the simple suppression framework adopted here, a more detailed model for dust extinction taking into account these facts is beyond the scope of this paper.
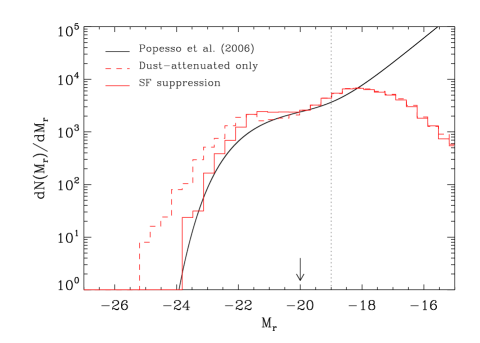
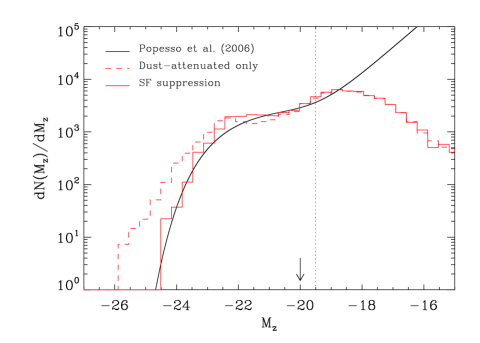
We show the outcome of applying this scheme in Figs. 5 and 6 for different parameter choices, where the - and -band LFs can be seen. In the left-hand panels, three different models are shown maintaining fixed at 200 km s-1, whereas adopt the values 100, 150 and 200 km s-1 (models 2, 5 and 8 of Table 1; long-dashed, dotted and solid lines respectively). As it can be seen, varying the zero point of the relation produces a horizontal shift in the resulting LF keeping its shape almost unchanged. Reducing rises the number of suppressed galaxies thus limiting the number of systems at a given luminosity. In the right-hand panels, we also show three different models but fixing at 200 km s-1 and letting adopt the values 150, 200 and 250 km s-1 (models 7, 8 and 9 of Table 1; three-dot-dashed, solid and dot-dashed lines respectively). In this case, all model LFs coincide at showing appreciable differences only in the bright-end. This reflects the strength of SF suppression recipe in more massive haloes.
For the explored models, the best agreement with observations is obtained for km s-1 (model 8, see Table 1). This maximum circular velocity value roughly corresponds to km s-1 as can be seen from Fig. 4. In this model, systems with km s-1 are not affected by the SF quenching and those having km s-1 are suppressed since , in agreement with previous SAM findings which take into account physically motivated AGN feedback models (e.g. Croton et al. 2006). In what follows, we will refer to this case as the best-fitting model. Even though in this case there is a much better agreement with data in the bright-end compared to the non-suppression case, some improvement is still needed in the faint-end with the simulation results typically overpredicting the number density of galaxies per magnitude bin in relation to observations. As mentioned in the introduction, it is believed that stellar feedback should be more efficient in smaller galaxies. Nevertheless, higher resolution simulations are needed in order to study this effect.
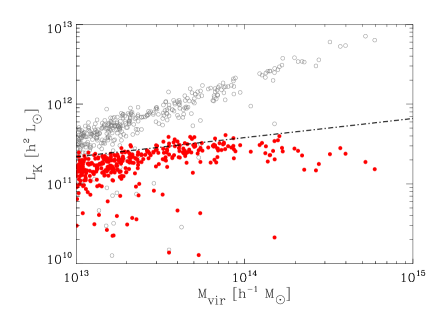
Given the size of the simulated volume it is possible to study the distribution of luminosities in the groups and galaxy clusters formed. However, we do not pretend here to make a rigorous comparison with observations since we will address this issue in future work using high-resolution runs. Instead, we just select all galaxies belonging to groups with virial mass higher than M☉ as our galaxy sample. In Fig. 7 we show the luminosity distribution of this sample for the SDSS - and -bands together with the fit to the data given by Popesso et al. (2006) for the RASS-SDSS galaxy cluster survey (smooth solid line). To take into account the (arbitrary) adopted normalization in observations our cluster LFs are forced to match the data at . As can be seen, the best-fitting model (solid line) does a better work in describing the observed profiles than the dust-attenuated only luminosity distribution (dashed line). This is also true if we study the BCG luminosity as a function of halo mass. Fig. 8 shows the -band luminosity-halo mass relation for BCGs residing in haloes with M☉ in both mentioned cases (open and filled circles respectively), compared to the observational trend given by Brough et al. (2008) (dot-dashed line). It can be seen that the suppression scenario displays a better agreement with data, although the suppression seems to be somewhat stronger than needed for the most massive systems.
3.2 Galaxy colours
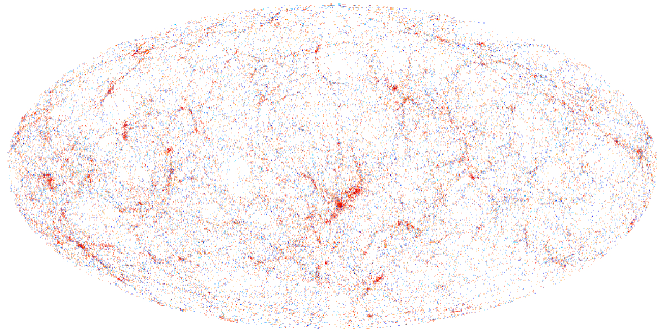
In Fig. 9 we show the distribution of galaxies in our simulated local volume projected onto the sky. The galaxies are colour coded using their colours in the best-fitting suppression case. From this figure it can be stated qualitatively that redder hydrodynamical galaxies tend to inhabit high density environments, in contrast with galaxies populating the field, generally bluer. A similar trend is obtained for the plain simulation output, although in that case there is an excess of blue systems in cluster environments.
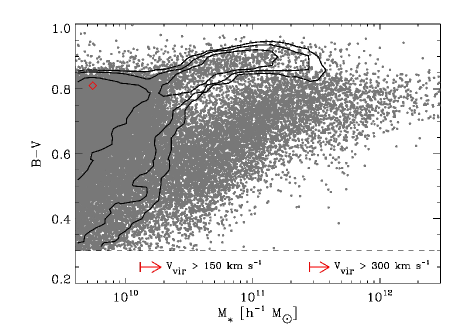
The effect of SF suppression in the colours of galaxies is easily seen in Fig. 10. There we show the colour index of numerically resolved galaxies against their stellar masses for the non-suppression case (filled circles), and what results for the best-fitting suppression procedure presented above (contour lines). Interestingly, the hydrodynamical galaxy population of the non-suppresed simulation shows a clear colour bi-modality for a given stellar mass, where two main branches can be easily seen. Those systems with colour index satisfying populate the so-called red sequence, while the rest populate what we call the blue cloud. This last branch contains a blue galaxy population with M⊙ responsible for the mismatch in the bright-end of the LFs shown in Fig. 3. In particular, most of the systems having km s-1 (arrow in the right) correspond to overluminous BCGs which have acquired around of their stellar mass at late epochs due to the overcooling effect.
This is at variance with the SF suppression scenario (contour lines) in which most of the massive blue galaxies became redder as a result of their older stellar populations. It can be seen that many of the systems with km s-1 (arrow in the left) have been suppressed in such a way that their colours turn redder than what observations suggest. Henceforth, it is clear from the contours that the simple procedure adopted to suppress SF is too efficient for some galaxies, while not efficient enough for the most massive ones. This results in a distribution that cannot fully account for the galaxy colour bi-modality in the stellar mass range – M⊙ (e.g. Baldry et al. 2006), reflecting the fact that physically motivated feedback schemes must be considered for massive haloes in future work.
As a final remark, it is worth noting that a moderately massive red population having M⊙ naturally appears in the simulation. The diamond in Fig. 10 indicates the approximate position of this population in the diagram. These systems correspond to galaxies that have assembled most of their stellar mass at early epochs, being satellites which gas content have been stripped off when accreted by central objects. This mechanism removes gas from galaxies limiting new SF and, as a consequence, stellar populations become older and redder.
3.3 Clustering properties
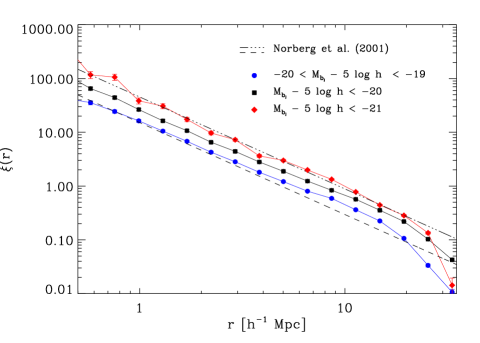
In this section, we explore the clustering properties of galaxies in the simulation, both for the non-suppresed and best-fitting SF suppression cases. The left-hand panel of Fig. 11 shows the real-space two-point correlation function for galaxies in the plain simulation with different -band absolute magnitudes (filled symbols). Circles are related to galaxies with , while squares and diamonds show the resulting correlations for all galaxies brighter than and , respectively. We also plot as dashed and three-dot-dashed lines the observational trends found by Norberg et al. (2001) for and galaxies (corresponding to and respectively). In the first place, it can be seen that brighter galaxies cluster strongly than fainter ones, as expected. The agreement with observations is fairly good taking into account the fact that normalization is a natural outcome of the simulation. In particular, for galaxies (circles) the clustering pattern shows a power-law behavior similar to that observed, although the agreement is worse for higher scales ( Mpc). Likewise, for systems with (diamonds) the agreement with observations is encouraging.
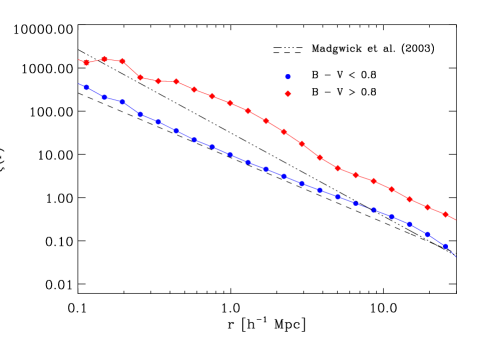
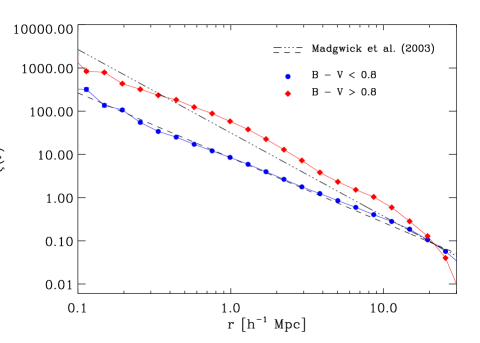
It is also interesting to investigate the clustering of galaxies as a function of their SF activity parametrized using galaxy colours. At , passive systems tend to populate high density environments, having redder colours, in contrast to active systems which are mainly located in the field (e.g. Balogh et al. 2004; Baldry et al. 2004, 2006). We define as passive systems all galaxies having , while active systems satisfy . The right-hand panel of Fig. 11 shows the real-space two-point correlation function for passive red galaxies (diamonds) and bluer ones (circles) in comparison with the observed correlations (valid for scales between –20) given by Madgwick et al. (2003). It is easy to see that both populations are clearly separated, with redder systems clustering more strongly, and displaying a similar behavior than observations. For passive systems, there is a substantial excess of power and a clear departure from a power-law. The power excess in this case is due to the fact that the overcooling present in the simulation makes the number density of red systems low, thus rising the value of the correlation length.
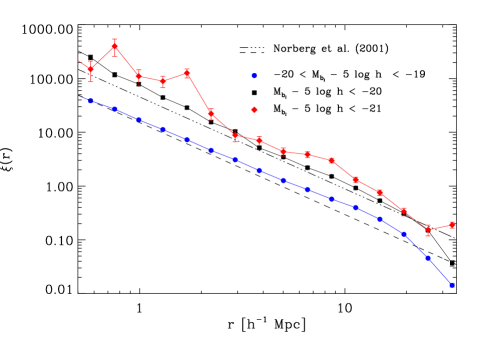
On the other hand, Fig. 12 shows the outcomes when considering the best-fitting suppression scheme. From its left-hand panel, it can be seen that the correlation function for galaxies (circles) exhibits essentially the same behavior as before (compare with Fig. 11), while displaying appreciable differences only for brighter galaxies (squares and diamonds). For objects brighter than the result is affected by low number statistics leading to a noisier correlation function that is somewhat off from the observational expectation. This is partially overcome when including more galaxies in the case. Active galaxies present an excellent agreement with data for all studied scales (right-hand panel of Fig. 12), and the discrepancy with observations found for passive red systems found in Fig. 11 is alleviated. This is somewhat expected since, as can be seen from the contour lines of Fig. 10, after the SF quenching, many of the galaxies have migrated to the red sequence rising the number density of passive systems. Despite of this improvement, it is important to remember that the colour-stellar mass relation is not well reproduced in this case due to the simplistic approach adopted to redden galaxies more massive than km s-1.
4 Summary and Conclusions
In this paper, we have focused on the luminosity, colour and clustering properties of galaxies that arise naturally in a hydrodynamical cosmological simulation of structure formation. The spherical local volume of Mpc3 was simulated using the zooming technique with more than million gas and dark matter particles. In particular, our simulation code include different physical mechanisms such as supernova feedback, galactic winds, an UV pervading background since and chemical enrichment of the gas and stellar populations as time elapses. However, we have not explicitly included a physical mechanism capable of quenching SF in massive haloes (like AGNs). In this way, by a total of objects having more than 32 star particles are formed in the volume. The luminosities of the hydrodynamical galaxies were computed using the differential contribution provided by every star particle present inside the optical radius of the systems. As a way of estimating the dust-attenuated luminosity in the bands of interest, we implemented a simple model for dust extinction that makes use of the cold gas distribution in each galaxy as a tracer of its dust content. In order to mimic the required SF suppression in massive (i.e. km s-1) haloes we also applied a simple recipe to the present day output of the simulation to reconcile the bright-end of the simulated LFs with observations and to further investigate its inclusion on other properties of the simulated galaxies. In the following we summarize the main conclusions of the present work:
-
•
As shown earlier by semi-analytic work, it is essential to suppress SF in massive haloes to describe the bright-end of the field LF at . For instance, haloes with masses corresponding to km s-1 are required to quench their SF since in the best-fitting SF suppression case. In this way, it is possible to avoid the formation of very bright blue BCGs in the simulation. However, after a small renormalization to , the faint-end of the simulated field LFs tends to overpredict the number density of galaxies per magnitude bin in the -band for galaxies with luminosities lower than . To better study this effect higher resolution simulations are needed.
-
•
The group/cluster bright-end luminosity distributions are better described when SF suppression is considered. This is due to the fact that massive cluster satellites used to be BCGs in the past, and also require some level of SF suppression. However, as a consequence of our relatively high-mass galaxy resolution limit we cannot confirm the upturn of faint cluster satellites in the cluster LF function as previously obtained by Saro et al. (2006, 2009) using high-resolution resimulations of galaxy clusters. On the other hand, the -band luminosity-halo mass relation that naturally arises in the simulation also needs further SF quenching in massive haloes to better describe observations given by Brough et al. (2008).
-
•
The stellar masses of the hydrodynamical galaxies in the plain simulation display a clear colour bi-modal behavior as suggested by observations (e.g. Baldry et al. 2006), although the active blue galaxies present very massive systems, due to overcooling, contrary to what data shows. When taking into account the SF suppression scheme, the galaxy colours turn redder, displaying a colour-stellar mass distribution that is not able to fully account for observations. In this case, a bi-modal distribution is observed for stellar masses lower than M⊙, while for higher masses most of the galaxies are red. This is a manifestation of the rough nature of the simple parametrization adopted to quench SF in massive haloes.
-
•
The clustering properties of different hydrodynamical galaxy populations that naturally arise in the simulation are in qualitative agreement with observational results. The scale-dependent correlation function of our objects in the -band displays a power-law behavior up to Mpc that is in good agreement with data given by Norberg et al. (2001). As expected, higher luminosity systems show a stronger clustering pattern, where galaxies having luminosities around display an excellent agreement with observations. On the other hand, it is also possible to disentangle the galaxy correlation properties when the sample is splitted by galaxy colours. The correlation function of active blue () systems is in rough agreement with the results given by Madgwick et al. (2003). However, passive red systems () present an excess of power in comparison with observations, showing a clear departure from the power-law behavior. As shown when using the SF suppression scheme, this discrepancy is alleviated when more galaxies are able to populate the red sequence of the colour-magnitude diagram. This is due to the fact that, typically, the added systems tend to reside in less clustered haloes, thus lowering the correlation length value.
In summary, we conclude that analyzing the global properties of the galaxy population within hydrodynamical, cosmological simulations, start to be a promising tool to study galaxy evolution. Current simulations already fairly represent the underlying hydrodynamical effects (at least in a global sense) and, in general, describe the star formation process well enough to qualitatively reproduce observed environmental trends. However, similar than for the widely used SAMs, overcooling in massive halos has to be quenched by additional feedback effects. It has to be seen in future simulations, which directly include such additional processes, if such a quenching happens mildly enough not to destroy some of general trends already captured in the current generation of hydrodynamical simulations.
Acknowledgments
The authors would like to thank the referee, Adrian Jenkins, for several comments that helped to improve this paper. S. E. N. acknowledges G. De Lucia, E. Puchwein, A. G. Sánchez, F. Stasyszyn and C. Scannapieco for useful discussions and DAAD (Deutscher Akademischer Austausch Dienst) for support. K.D. acknowledges support by the DFG Priority Programme 1177.
References
- [1] Baldry I. K., Glazebrook K., Brinkmann J., Ivezić, Z., Lupton R. H., Nichol R. C., Szalay A. S., 2004, ApJ, 600, 681
- [2] Baldry I. K., Balogh M. L., Bower R. G., Glazebrook K., Nichol R. C., Bamford S. P., Budavari T., 2006, MNRAS, 373, 469
- [3] Balogh M. L., Baldry I. K., Nichol R., Miller C., Bower R., Glazebrook K., 2004, ApJ, 615, 101
- [4] Blanton M. R. et al., 2001, AJ, 121, 2358
- [5] Blanton M. R. et al., 2003, ApJ, 592, 819
- [6] Baugh C. M., Gaztañaga E., Efstathiou G., 1995, MNRAS, 274, 1049
- [7] Bower R. G., Benson A. J., Malbon R., Helly J. C., Frenk C. S., Baugh C. M., Cole S., Lacey C. G., 2006, MNRAS, 370, 645
- [8] Brough S., Couch W. J., Collins C. A., Jarrett T., Burke D. J., Mann R. G., 2008, MNRAS, 385, 103
- [9] Bruzual G., Charlot S., 2003, MNRAS, 344, 1000
- [10] Cattaneo A., Dekel A., Devriendt J., Guiderdoni B., Blaizot J., 2006, MNRAS, 370, 1651
- [11] Cattaneo A. et al., 2009, Nat, 460, 213
- [12] Charlot S., Fall S. M., 2000, ApJ, 539, 718
- [13] Cole S. et al., 2001, MNRAS, 326, 255
- [14] Crain R. A. et al., 2009, MNRAS, 399, 1773
- [15] Croton D. J. et al., 2006, MNRAS, 365, 11
- [16] Colless M., 1999, R. Soc. London Philos. Trans. A, 357, 1750, 105
- [17] Colless M. et al., 2001, MNRAS, 328, 1039
- [18] Cora S., 2006, MNRAS, 368, 1540
- [19] Davé R., Oppenheimer B. D., 2007, MNRAS, 374, 427
- [20] De Lucia G., Kauffmann G., White S. D. M., 2004, MNRAS, 349, 1101
- [21] De Lucia G., Blaizot J., 2007, MNRAS, 375, 2
- [22] Dolag, K., Hansen F. K., Roncarelli M., Moscardini L., 2005, MNRAS, 363, 29
- [23] Dolag K., Borgani S., Murante G., Springel V., 2009, MNRAS, 399, 497
- [24] Fisher K. B., Davis M., Strauss M. A., Yahil A., Huchra J., 1994, MNRAS, 266, 50
- [25] Fisher K. B., Huchra J. P., Strauss M. A., Davis M., Yahil A., Schlegel D., 1995, ApJS, 100, 69
- [26] Fontanot F., De Lucia G., Monaco P., Somerville R., Santini P., 2009, MNRAS, 397, 1776
- [27] Guiderdoni B., Rocca-Volmerange B., 1987, A&A, 186, 1
- [28] Guo Q., White S. D. M., 2009, MNRAS, 396, 39
- [29] Haardt F., Madau P., 1996, ApJ, 461, 20
- [30] Hatton S., Devriendt J.E.G., Ninin S., Bouchet F. R., Guiderdoni B., Vibert D., 2003, MNRAS, 343, 75
- [31] Hawkins E. et al., 2003, MNRAS, 346, 78
- [32] Hoffman Y., Ribak E., 1991, ApJ, 380, 5
- [33] Huang J. S., Glazebrook K., Cowie L. L., Tinney C., 2003, ApJ, 584, 203
- [34] Kauffmann G., Colberg J. M., Diaferio A., White S. D. M., 1999, MNRAS, 303, 188
- [35] Khalatyan A., Cattaneo A., Schramm M., Gottlöber S., Steinmetz M., Wisotzki L., 2008, MNRAS, 387, 13
- [36] Kolatt T., Dekel A., Ganon G., Willick J. A., 1996, ApJ, 458, 419
- [37] Lagos C. Del P., Cora S. A., Padilla N. D., 2008, MNRAS, 388, 587
- [38] Li C., White S. D. M., 2009, MNRAS, 398, 2177L
- [39] Lin H., Kirshner R. P., Shectman S. A., Landy S. D., Oemler A., Tucker D. L., Schechter P. L., 1996, ApJ, 464, 60
- [40] Madgwick D. S. et al., 2003, MNRAS, 344, 847
- [41] Maeder A., Meynet G., 1989, A&A, 210, 155
- [42] Malbon R. K., Baugh C. M., Frenk C. S., Lacey C. G., 2007, MNRAS, 382, 1394
- [43] Matteucci F., Recchi S., 2001, ApJ, 558, 351
- [44] Mathis H., Lemson G., Springel V., Kauffmann G., White S. D. M., Eldar A., Dekel A., 2002, 333, 739
- [45] Norberg P. et al., 2001, MNRAS, 328, 64
- [46] Norberg P. et al., 2002, MNRAS, 336, 907
- [47] Nuza S. E., Tissera P. B., Pellizza L. J., Lambas D. G., Scannapieco C., de Rossi M. E., 2007, MNRAS, 375, 665
- [48] Ocvirk P., Pichon C., Teyssier R., 2008, MNRAS, 390, 1326
- [49] Oppenheimer B. D., Davé R., 2006, MNRAS, 373, 1265
- [50] Oppenheimer B. D., Davé R., 2008, MNRAS, 387, 577
- [51] Pearce F. R., Jenkins A., Frenk C. S., White S. D. M., Thomas P. A., Couchman H. M. P., Peacock J. A., Efstathiou G., 2001, MNRAS, 326, 649
- [52] Popesso P., Böhringer H., Brinkmann J., Voges W., York D. G., 2004, A&A, 423, 449
- [53] Popesso P., Biviano A., Böhringer H., Romaniello M., 2006, A&A, 445, 29
- [54] Recchi S., Matteucci F., D’Ercole A., 2001, MNRAS, 322, 800
- [55] Rafferty D. A., McNamara B. R., Nulsen P. E. J., Wise M. W., 2006, ApJ, 652, 216
- [56] Salpeter E. E., 1955, ApJ, 121, 161
- [57] Saro A., Borgani S., Tornatore L., Dolag K., Murante G., Biviano A., Calura F., Charlot S., 2006, MNRAS, 373, 397
- [58] Saro A., De Lucia G., Dolag K., Borgani S., 2008, MNRAS, 391, 565
- [59] Saro A., Borgani S., Tornatore, L., De Lucia G., Dolag K., Murante G., 2009, MNRAS, 392, 795
- [60] Spergel D.N. et al., 2003, ApJS, 148, 175
- [61] Springel V., White S. D. M., Tormen G., Kauffmann G., 2001, MNRAS, 328, 726
- [62] Springel V., Hernquist L., 2002, MNRAS, 333, 649
- [63] Springel V., Hernquist L., 2003, MNRAS, 339, 289
- [64] Springel V., 2005, MNRAS, 364, 1105
- [65] Springel V. et al., 2005, Nat, 435, 629
- [66] Sutherland R. S., Dopita M. A., 1993, ApJS, 88, 253
- [67] Tornatore L., Borgani S., Matteucci F., Recchi S., Tozzi P., 2004, MNRAS, 349, 19
- [68] Tornatore L., Borgani S., Dolag K., Matteucci F., 2007, MNRAS, 382, 1050
- [69] White M., Hernquist L., Springel V., 2001, preprint (astro-ph/0107023)
- [70] York D. G. et al., 2000, AJ, 120, 1579
- [71] Yoshikawa K., Taruya A., Jing Y.P., Suto Y., 2001, ApJ, 558, 520
- [72] Zehavi I. et al., 2002, ApJ, 571, 172