Giant Hii Regions in NGC 7479 & NGC 6070
Abstract
We present new results from our search for Giant H ii Regions in galaxies visible from the southern hemisphere. In this work we study two galaxies: NGC 7479 and NGC 6070. Using high-resolution spectra, obtained with different instruments at Las Campanas Observatory, we are able to resolve the emission-line profile widths and determine the intrinsic velocity dispersion of the ionised gas. We detect profile widths corresponding to supersonic velocity dispersions in the six observed H ii regions. We find that all of them show at least two distinct kinematical components: a relatively narrow feature (between 11 and 22 km s-1) and a broader (between 31 and 77 km s-1) component. Two of the regions show a complex narrow profile in all ion lines, which can be further split into two components with different radial velocities. Whereas the wing broadening of the overall profile can be fitted with a low-intensity broad component for almost all profiles, in one region it was better reproduced by two separate shell-like wings. We have analysed the impact that the presence of multiple components has on the location of the Hii regions in the plane. Although the overall distribution confirms the presence of a regression, the precise location of the regions in the plane is strongly dependent on the components derived from the profile fitting.
keywords:
(ISM:) H ii Regions - galaxies: starburst - galaxies: individual: NGC 7479 - galaxies: individual: NGC 60701 Introduction
The most extended and luminous objects which are observed on the disks of spirals, in irregulars and in starburst galaxies are called Giant Extragalactic Hii Regions (GHiiRs). GHiiRs are places of very active star formation and they are characterised by the large emission of ultraviolet photons from a large number of young and massive stars. Owing to the large number of ionising photons most of the surrounding gas is ionised, and the recombination process provides a strong signature of recent or ongoing massive star formation.
The emission-line profile widths of the giant Hii regions imply the existence of supersonic motions in the gas (Smith & Weedman, 1970). Furthermore, Terlevich & Melnick (1981) found a correlation between the gas velocity dispersion () and the total luminosity (L) emitted in the respective line. Hippelein (1986) and Arsenault & Roy (1988) confirmed the existence of such a regression, but there was no agreement on the values derived for its slope so no conclusion could be reached regarding the origins of this motion. Fuentes-Masip et al. (2000) and Bosch et al. (2002) using different techniques on different samples agreed on a slope close to a value of 4, which seemed to favour the gravitational source of energy for the observed supersonic motion. Even if the nature of this behaviour is not fully understood, it still allows us to distinguish giant Hii regions from an agglomeration of classical Hii regions by means of high resolution spectroscopy. GHiiRs provide the link between small-scale star forming regions, such as Orion in our Galaxy and violent star formation processes taking place in starburst galaxies.
In Firpo et al. (2005) we have confirmed the giant nature of three candidates to giant Hii regions in the southern sky which were identified as very luminous Hii regions by Feinstein (1997).
Here we continue our search and detailed analysis of GHiiRs in local Universe galaxies. We have selected from the Feinstein catalogue, a sample of the brightest Hii regions from two spiral galaxies: NGC 7479 and NGC 6070.
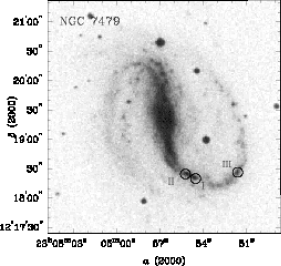
NGC 7479 is a barred spiral galaxy, at a distance of 31.92 Mpc (Rozas et al., 1999), classified as SB(s)c by de Vaucouleurs et al. (1991). Devereux (1989) and Martinet & Friedli (1997) have classified it also as a starburst galaxy, whereas Keel (1983) and Ho et al. (1997) have identified it as a LINER and a Seyfert 1.9 galaxy respectively. Many studies have been performed on this galaxy owing to the presence of a certain asymmetry in the spiral structure (Quillen et al., 1995) that leads several authors to suggest this might be owed to a recent merger event (Laine, 1996; Laine & Heller, 1999). This scenario can also account for perturbations in the velocity field (Laine & Gottesman, 1998) and the latest minor merger model indicates that the remnant may be situated within the bar (Laine, 2001) as no remnant of the merger could be identified in optical images (Saraiva & Benedict, 2003).
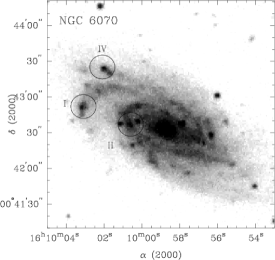
NGC 6070, at a distance of 29.8 Mpc (García-Gómez et al., 2002), is classified as SA(s)cd by de Vaucouleurs et al. (1991) although Grosbøl et al. (2004) state that a bar with two main arms can be identified. Pohlen & Trujillo (2006) further studied the bar structure classifying it as Type II.o.CT according to Erwin et al. (2008). The galaxy shows a normal arm distribution, with two arms that break into several on each side of the central region (see Figure 2). The disk dynamics was studied by Márquez et al. (2002), and García-Gómez et al. (2002) studied the distribution of Hii regions in the galaxy.
In order to verify the nature of our giant Hii region candidates, we obtained high resolution spectra to measure the emission-line profile widths and to estimate if the velocity dispersion is indeed supersonic. To determine the optimum number of Gaussian components to fit each line profile in order to minimise the uncertainty in the velocity dispersion of the ionised gas, we have considered information from other studies available in the literature. Previous papers have dealt with the fact that a single Gaussian profile might not be realistic enough when fitting the observed emission lines. Several studies favour the presence of an omnipresent broad component which explains the integral profile wings. They include Melnick et al. (1999) who identified a broad component in the recombination lines in the central region of the 30 Doradus nebula, Díaz et al. (1987) and Terlevich et al. (1996) in the M33 giant Hii region NGC 604, Mendez & Esteban (1997) in four Wolf-Rayet galaxies, and Homeier & Gallagher (1999) in the starburst galaxy NGC 7673. More recently, Hägele et al. (2007); Hägele (2008); Hägele et al. (2009) and Hägele et al. (2010) found that the best Gaussian fits in circumnuclear star-forming regions involved the presence of broad and narrow components for the emission lines of the ionised gas.
A variety of line broadening mechanisms have been proposed to interpret the existence of the broad supersonic component measured in the emission line profile of GHiiRs. Dynamics of virialised systems (Tenorio-Tagle et al. 1993), superposition of multiple gas bubbles in expansion (Chu & Kennicutt 1994), or turbulence of the same interstellar gas (Medina Tanco et al. 1997). More recently, Westmoquette et al. 2007; 2007 concluded that the narrow component represents the general disturbed ionised interstellar medium (ISM), arising through a convolution of the stirring effects of the starburst and gravitational virial motions. On the other hand, the broad component results from the highly turbulent velocity field associated with the interaction of the hot phase of the ISM with cooler gas knots, setting up turbulent mixing layers.
Other studies support the existence of shell-like profiles on the blue and red wings of the main feature as found by Chu & Kennicutt (1994), who state that the integrated line profiles of the entire 30 Dor region may be fitted with a broad Gaussian with low-intensity wings. Relaño & Beckman (2005) claim that a large fraction of the Hii regions in three barred spiral galaxies shows high-velocity and low-intensity features in its integrated line profiles and Rozas et al. (2006) find that the great majority of their sampled Hii regions show that the brightest principal component is accompanied by low-intensity components symmetrically shifted in velocity.
In this paper we present echelle data obtained at Las Campanas Observatory (LCO) of six GHiiRs candidates in the two mentioned galaxies. We have determined the velocity dispersion and we have evaluated the possible presence of a broad component or two symmetric low-intensity components in the fit with the observed emission line profile widths. In section 2 we present the observations and the data reduction. Section 3 details the analysis performed on the emission-line profiles and discusses each conspicuous case individually. The summary and conclusions of this work are included in Section 4.
2 Observations and Reductions
According to canonical denomination for GHiiRs we have labelled our candidates following their brightness ranking from Feinstein catalogue. NGC 7479 I is therefore the brightest region in NGC 7479, NGC 7479 II is the second brightest and so on. Observed regions from NGC 7479 and NGC 6070 are shown in Figures 1 and 2 respectively. High resolution spectra were obtained with an echelle spectrograph at the 100-inch du Pont Telescope, Las Campanas Observatory (LCO) between 19 and 22, July 2006. The spectral range covered by the observations was from 3800 to 9500Å. Observing conditions were good with 1 arcsec seeing and photometric sky. A 22 binning was applied to the CCD in order to minimise readout contribution to the final spectrum noise. The spectral resolution achieved in our du Pont Echelle data (obtained with 1 arcsec effective slit width) is R25000: =0.25Å at 6000Å, as measured from the FWHM of the ThAr comparison lines. This translates in a resolution of 12 kms-1.
The standard stars, HR 7950, and HR 4468 and the CALSPEC spectrophotometric standard star, Feige 110 (Bohlin et al. 2001), were also observed for flux calibration purposes. In addition, Th-Ar comparison spectra, milky flats (sky flats obtained with a diffuser , during the afternoon) and bias frames were taken every night. The exposure time for standard stars was five seconds for the bright HR stars and 1200 seconds for Feige 110.
We also obtained high resolution spectra for the three Hii regions
in the NGC 6070 galaxy using the echelle
double spectrograph Magellan Inamori Kyocera Echelle (MIKE) at the 6.5-m,
Magellan II (Clay) Telescope, LCO, in July 2004. No binning was applied to the 2K4K CCD detector and a 1 arcsec slit was used. The spectral resolution measured on our MIKE spectra is 11 km, which is quite similar than that obtained at du Pont. The exposure
time for CALSPEC spectrophotometric standard star BD+28D4211 was 900
seconds.
Th-Ar comparison lamps, milky flats (internal flat field lamp with
a diffuser glass slide) and bias frames were used to calibrate these data.
Table 1 lists the journal of observations, together with the exposure times, air masses and the standard stars
that were used for flux calibrating each region.
| Telescope | Region | Date | Exp. | sec z | Standard |
|---|---|---|---|---|---|
| du Pont | 7479 I | 2006 Jul 19 | 1800 | 1.6 | Feige 110 |
| 7479 II | 2006 Jul 20 | 1800 | 1.5 | HR 7950 | |
| 7479 III | 2006 Jul 20 | 1800 | 1.4 | HR 7950 | |
| 6070 I | 2006 Jul 21 | 1800 | 1.2 | HR 4468 | |
| 6070 II | 2006 Jul 21 | 1800 | 1.2 | HR 4468 | |
| 6070 IV | 2006 Jul 21 | 1800 | 1.2 | HR 4468 | |
| Clay | 6070 I | 2004 Jul 12 | 1800 | 1.3 | BD+28D4211 |
| 6070 II | 2004 Jul 12 | 1800 | 1.2 | BD+28D4211 | |
| 6070 IV | 2004 Jul 12 | 1200 | 1.7 | BD+28D4211 |
The data analysis was carried out with IRAF111Image Reduction and Analysis Facility, distributed by NOAO, operated by AURA, Inc., under agreement with NSF. software. After bias subtraction and flat field corrections with Milky Flats, the bidimensional images were corrected for cosmic rays with the task cosmicrays which detects and removes cosmic rays using a flux ratio algorithm. The corrected data were reduced by IRAF routines following similar procedures to those described in Firpo et al. (2005).
We also compared the red end of the wavelength calibrated spectra with the night-sky spectrum by Osterbrock et al. (1996). This turned out to be a very reliable confirmation of the goodness of the wavelength solution, and we were able to check that differences between our wavelengths and the sky line wavelengths were below 0.05Å.
We performed flux calibrations using the observed spectrophotometric standard stars as described in Firpo et al. (2005). The observed standard stars had their fluxes tabulated every 16Å, and the amount of defined intervals within an echelle order ranged from four to twelve, depending on the quality of the spectrum.
For the Magellan spectra, and in the case of the NGC 7479 I region du Pont data, we were able to obtain CALSPEC spectrophotometric standard stars (Bohlin et al. 2001), whose fluxes were tabulated every 2Å. These stars are ideal for calibrating high resolution echelle spectra, although their relatively low brightness (Feige 110, V=11.83 and BD+28D4211, V=10.51) makes them time-consuming targets for two metre class telescopes.
3 Analysis of line profiles
Making use of the known redshifts z=0.006685 for NGC 6070 (Springob et al., 2005) and z=0.007942 for NGC 7479 (Haynes et al., 1998) we identify the hydrogen recombination lines, such as H and H, and collisionally excited lines, such as [Nii]6548,6584Å, [Sii]6717,6731Å, present in the spectra. These strong lines are used to analyse the structure of the profiles as they allow us to verify the existence of more than one component. The adopted laboratory wavelengths are taken from work by García-Rojas et al. (2005).
To determine the radial velocities and the velocity dispersions of the ionised gas, we measure the central wavelength and width of several emission lines. The radial velocity of each emission line is obtained from its central wavelength determined from the Gaussian profile fitting, and their errors are given by the fitting error provided by the resampling done within the ngauss task of IRAF and taking into account the rms of the wavelength calibration. The true velocity dispersion (), of each emission line is calculated as described in Firpo et al. (2005). The width of the observed profile () is affected by the contribution of thermal random motions () and the instrumental profile (). Then, we can obtain the true velocity dispersion as = - - . As in Firpo et al. (2005), a typical kinetic temperature K is assumed, and the instrumental profile () is very well approximated by a single Gaussian function. The velocity dispersion errors have been calculated using the observational errors in the observed profile and assuming negligible errors in and . Owing to the generally high metallicity of these kinds of objects as a class, the temperatures are probably lower than K (see Díaz et al., 2007, and references therein). The low excitation of these objects estimated from their spectra makes any temperature sensitive line too weak to be observed. In fact, in most cases, the [Oiii]5007Å line, which is typically one hundred times more intense than the auroral [Oiii]4363Å one, can barely be seen. In this way, we have also calculated the velocity dispersions assuming a kinetic temperature of 5000K and we do not find great differences with the previous calculations derived using K. These differences are between 0.02 and 3 km s-1 depending on the measured velocity dispersion since is constant for a given temperature and subtracted in quadrature to . Obviously, the estimated are always higher for the lower assumed kinetic temperatures. Then, for consistency with Firpo et al. (2005) we use a kinetic temperature of K. Therefore, this effect owing to the kinetic temperature uncertainty, would produce an underestimation in the derived true velocity dispersions.
When fitting single Gaussian profiles to the emission lines we notice that, although it works well for most of the observed profiles, there is a residual present in the wings of several lines. This has been observed in GHiiRs before. Some authors (Melnick et al., 1999; Hägele et al., 2007, 2009, 2010, among others) have shown that the profile wings are well fitted by single (broad) Gaussian of supersonic widths, whereas other authors (Chu & Kennicutt, 1994; Relaño & Beckman, 2005; Rozas et al., 2006) proposed that the profiles appear to be dominated by a few, well-resolved, expanding shells. Wherever possible, we have considered and applied both suggestions.
In order to fit multiple components to the observed profiles we make use of the ngaussfit task within IRAF. Ngaussfit performs iterative fitting of multiple Gaussian profiles to spectral lines. The task allows us to select individual parameters to be fitted and delivers an estimate for the uncertainty of derived parameters. The task needs initial guesses for the function coefficients, and these are specified through previously generated tables.
In those cases when more than one component is evident, we follow an iterative procedure in which we only allow the task to fit a limited subset of parameters at one time. This is done to constrain the universe of possible solutions to the fit by making use of the different information available from each emission line. Basically, after obtaining an initial guess for the second component parameters, we fit the amplitude, centre and width of each component at one time, leaving the parameters of the other one untouched. Once the central wavelength of all components is relatively well known, we set them as fixed parameters and allow the task to perform a final fit of amplitude and width of all components at the same time.
The profile fittings show the presence of a residual in the emission line wings for all cases, becoming more evident in the strong H emission line. Therefore, we evaluate the presence of either a broad component or shell features. For the former assumption, we introduce a broad component with an initial width which is three times the width of the narrow component(s). This guess comes from an overall view of the values found by Hägele et al. (2007) when performing a similar analysis. We fit the peak values for the narrow components and then their profile widths. The broad component parameters are then fitted before we start the iterative procedure again. In the latter scenario, a similar iterative procedure takes place, but in this case we add a blue and a red narrow component to account for the additional emission. The validity of the profile multiplicity and broadening is checked over the different emission lines available for each region, although the most reliable profile analysis comes from the strongest lines, such as H.
Out of our sample of six GHiiRs we find that all of them show evidence of wing broadening. For these regions we attempt to fit an overall broad component or two narrow components symmetrically shifted in velocity with respect to the intense component. In the following subsections we will discuss our findings grouping them by the outcome profiles.
3.1 NGC7479 I
Rozas et al. (1999) undertook a complete study to date of the Hii regions in NGC 7479 galaxy, determining positions, angular sizes, and absolute fluxes of over 1000 Hii regions and they constructed the luminosity function for the regions over the whole galaxy. We have cross-correlated these results with our sample and find that the three NGC 7479 regions selected in our work can be identified in the Rozas catalogue: NGC7479 I as RZH99=1, NGC7479 II as RZH99=7 and NGC7479 III as RZH99=74 (RZH99 is the number identification used by Rozas et al., 1999).
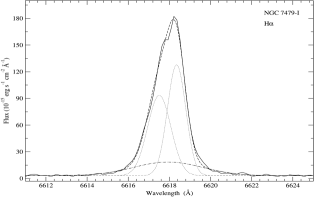
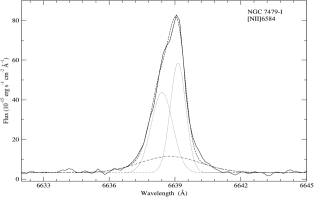
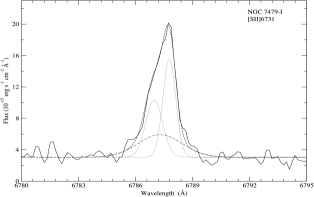
We identify and fit the Gaussian profiles to the H, [Nii]6584Å and [Sii]6717,6731Å lines in NGC 7479 I region with splot routines. The Gaussian fits reveal the presence of two distinctly separated kinematic components (labelled A and B) in all analysed profiles. Component A shows a much broader profile than component B, and both components show little spread in their individual radial velocities among different emission lines present in the spectrum. The reliability of these values is confirmed when we improve the profile fitting using ngaussfit which in turn yields values for the profile width of each component.
Even considering the presence of two distinct components with different radial velocities, the overall fit cannot account for a residual emission in the profile wings. Following the procedures outlined in the previous section, we are able to fit a broad component, with a velocity dispersion of about 75 km s-1 from the H emission line and about 60 km s-1 from the other ones. An attempt to fit twin narrow profiles did not converge to a reliable solution. Table 2 shows parameters for the three components that fit the global profile. Individual Gaussian component fluxes are listed as emission measure (EM) relative to the total line flux following the work by Relaño & Beckman (2005). The overall H flux, uncorrected for reddening, is found to be 3.37 x 10⁻¹⁴ erg s-1cm-2. In Figure 3 we show the ngauss fitting done with three different Gaussian components in the emission lines which have enough signal to provide an accurate fit. The emission lines with a low signal-to-noise ratio for which the fits do not provide accurate results for the broad component, are not listed in the table. The velocity dispersion for the ionised gas is derived by taking = 5.1 kms-1 as instrumental width, and a kinetic temperature of as mentioned above.
| NGC 7479 I | NGC 7479 II | NGC 7479 III | |||||||||||||||
|---|---|---|---|---|---|---|---|---|---|---|---|---|---|---|---|---|---|
| ion | comp. | Vr | error | error | EM | Vr | error | error | EM | Vr | error | error | EM | ||||
| 6563 | H | A | 2500.4 | 0.7 | 22.3 | 0.9 | 39 | 2492.4 | 0.6 | 14.8 | 0.8 | 66 | 2481.1 | 0.7 | 11.3 | 2.9 | 67 |
| B | 2538.9 | 0.6 | 15.3 | 0.8 | 42 | 2532.2 | 0.7 | 11.1 | 0.9 | 23 | … | … | … | … | … | ||
| broad | 2519.6 | 3.9 | 76.5 | 4.8 | 19 | … | … | … | … | … | 2472.5 | 2.1 | 37.8 | 0.9 | 33 | ||
| b wing | … | … | … | … | … | 2442.7 | 1.7 | 13.5 | 2.0 | 5 | … | … | … | … | … | ||
| r wing | … | … | … | … | … | 2573.8 | 1.9 | 18.0 | 1.7 | 6 | … | … | … | … | … | ||
| 6584 | [NII] | A | 2506.8 | 0.7 | 21.6 | 0.9 | 39 | 2494.2 | 1.1 | 16.4 | 1.0 | 53 | 2482.9 | 0.8 | 12.8 | 2.3 | 52 |
| B | 2540.1 | 0.7 | 15.2 | 0.8 | 39 | 2532.5 | 2.0 | 16.7 | 1.3 | 30 | … | … | … | … | … | ||
| broad | 2523.4 | 4.4 | 63.6 | 3.6 | 22 | … | … | … | … | … | 2478.4 | 4.0 | 40.4 | 1.1 | 48 | ||
| b wing | … | … | … | … | … | 2459.8 | 9.1 | 24.8 | 4.3 | 13 | … | … | … | … | … | ||
| r wing | … | … | … | … | … | 2581.5 | 6.5 | 14.7 | 2.5 | 4 | … | … | … | … | … | ||
| 6717 | [SII] | A | … | … | … | … | … | … | … | … | … | … | 2480.9 | 0.8 | 10.2 | 5.3 | 33 |
| B | … | … | … | … | … | … | … | … | … | … | … | … | … | … | … | ||
| broad | … | … | … | … | … | … | … | … | … | … | 2471.1 | 4.1 | 52.2 | 1.4 | 67 | ||
| b wing | … | … | … | … | … | … | … | … | … | … | … | … | … | … | … | ||
| r wing | … | … | … | … | … | … | … | … | … | … | … | … | … | … | … | ||
| 6731 | [SII] | A | 2502.4 | 1.1 | 19.3 | 1.2 | 30 | … | … | … | … | … | 2481.0 | 0.8 | 15.4 | 4.3 | 50 |
| B | 2538.0 | 0.8 | 14.3 | 0.9 | 39 | … | … | … | … | … | …… | … | … | … | |||
| broad | 2516.2 | 4.2 | 52.1 | 5.1 | 31 | … | … | … | … | … | 2454.7 | 6.4 | 51.8 | 1.2 | 50 | ||
| b wing | … | … | … | … | … | … | … | … | … | … | … | … | … | … | … | ||
| r wing | … | … | … | … | … | … | … | … | … | … | … | … | … | … | … | ||
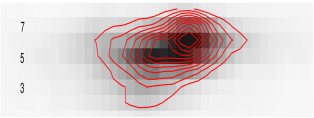
Since part of the spatial information along the slit is lost through the aperture extraction process we generate 2D velocity images in H, [Nii]6584Å and [Sii]6717Å lines. Taking into account that the slit size is 1”x 4”, the data are binned by two pixels in both directions and the seeing was 1”, we take aperture sizes of 0.5 arcsec 1px, therefore dividing the slit into eight sections. We extract traces of the spectrum at eight representative cuts along the slit, preserving the same spatial resolution. This is done for each echelle order where a line of interest is present and each spectral section is rebinned to velocity space. In this reference frame, individual slices are stacked together using the imstack task, which allows us to generate 2D velocity images. Figure 4 shows the 2D H velocity image with the [Nii]6584Å contours overlapped. It can be readily seen that individual knots can only be identified when the kinematical information is considered in this vs. slit section plane. This suggests that 3D spectroscopy will be able to provide a powerful insight on the structure of this type of star forming knots.
| section | comp | Vr | error | error | EM | ||
|---|---|---|---|---|---|---|---|
| 6563 | H-1 | A | 2501.8 | 0.9 | 12.6 | 1.2 | 51 |
| broad | 2500.7 | 4.8 | 59.3 | 4.3 | 49 | ||
| 6563 | H-2 | A | 2503.0 | 0.9 | 11.6 | 1.5 | 63 |
| broad | 2500.3 | 1.6 | 37.7 | 2.5 | 37 | ||
| 6563 | H-3 | A | 2504.7 | 0.6 | 16.4 | 0.8 | 43 |
| broad | 2506.8 | 1.4 | 47.0 | 1.7 | 57 | ||
| 6563 | H-4 | A | 2500.8 | 0.7 | 15.8 | 0.9 | 43 |
| broad | 2519.6 | 2.9 | 55.0 | 3.6 | 30 | ||
| B | 2536.8 | 0.7 | 10.7 | 0.9 | 27 | ||
| 6563 | H-5 | A | 2500.9 | 0.6 | 10.5 | 0.8 | 25 |
| broad | 2515.6 | 1.5 | 55.9 | 1.9 | 35 | ||
| B | 2535.6 | 0.6 | 13.1 | 0.8 | 40 | ||
| 6563 | H-6 | broad | 2502.6 | 1.5 | 45.5 | 1.7 | 39 |
| B | 2538.6 | 0.6 | 17.4 | 0.8 | 61 | ||
| 6563 | H-7 | broad | 2519.4 | 1.2 | 46.0 | 1.3 | 56 |
| B | 2540.7 | 0.6 | 6.0 | 0.8 | 44 | ||
| 6563 | H-8 | broad | 2523.9 | 2.1 | 44.9 | 1.9 | 80 |
| B | 2532.6 | 0.6 | … | 1.2 | 20 |
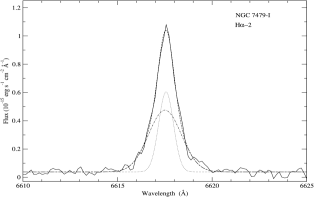
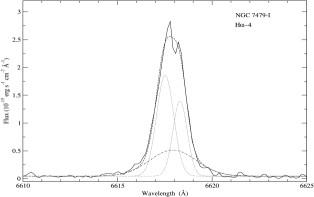
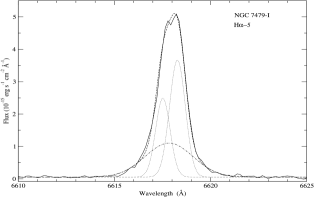
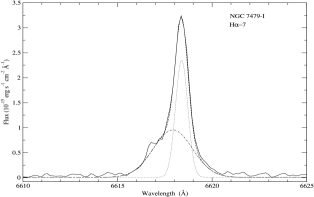
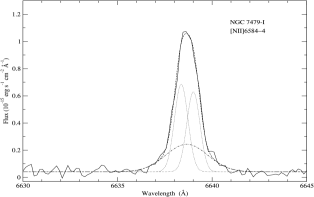
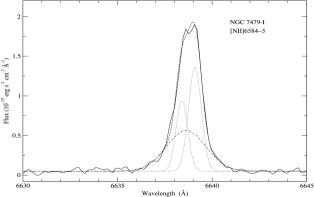
We have performed a detailed analysis on the slit stack, by fitting Gaussian profiles at each slit section. The resulting parameters are listed in Table 3 and the graphics output can be seen in Figure 5 where is shown 2, 4, 5, and 7 H sections, and 4 and 5 [Nii]6584Å sections. Focusing on the slit edges first (sections 1 to 3 and 6 to 8) we identify two distinct kinematical components at 2500 km s-1 and 2540 km s-1 labelled A and B respectively. Each of these relatively narrow features has a broader component associated with it. Although the narrow component can still be deblended in the central region, we are not able to disentangle the broad ones, which results in a single broad profile with a velocity similar to the average between components A and B. Regarding the velocity dispersion of each component, we have listed them in Table 3 as a reference, but they should not be taken as a definite value as the signal-to-noise ratio is variable and somewhat low for the slit edges.
If we compare these results with the radial velocity map derived for the ionised gas in NGC 7479 (Laine, 1996) we find, from visual inspection, that the expected velocity at the position of NGC7479 I ranges between 2520 and 2535 km s-1 close to an average value of our components A and B. A similar comparison, using the H I map by Laine & Gottesman (1998) which has a better spatial and spectral resolution, yields a value between 2530 and 2540 km s-1 much closer to the value measured for component B. Although the latter map is sampling neutral rather than ionised hydrogen, the former might be affected by the complex structure we find within the region. At this stage we can only suggest that component A shows an odd kinematic behaviour and that a detailed study of NGC7479 I and its surroundings is needed to clarify this issue.
3.2 NGC7479 II
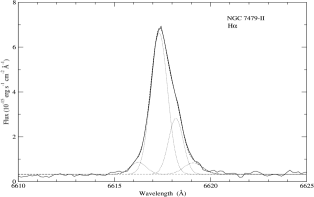
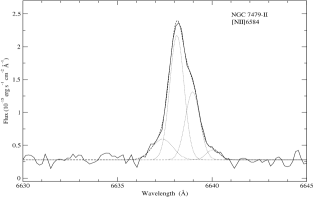
A similar procedure is used to analyse the profiles of the emission lines of NGC7479 II. In this case, two components are identified with different radial velocities, but as the overall signal obtained for this region is lower than for NGC7479 I it is not possible to disentangle them with 2D spectra. These two narrow components are found in the Gaussian profiles of the H, H, [Nii]6548,6584Å and [Sii]6717,6731Å lines. In this region, however, the wings of the brightest component profile could not be fitted with one single broad component. On the other hand, we are able to fit it with two wings only for the two lines with the strongest signal, namely H and [Nii]6584Å (see Figure 6). The final fitting parameters are shown in Table 2. The overall H flux, uncorrected for reddening, is found to be 1.06 x 10⁻¹⁴ erg s-1cm-2. The emission lines with a low signal-to-noise ratio for which the fits do not provide accurate results for the broad and the two wings components, are not listed in the table.
We compare the velocity separation between the red (and blue) shifted components with the average of the central features and the H luminosity of the region. The velocity separation of the red and blue shifted components in this work is in agreement with the regression found by Relaño & Beckman (2005) for their Hii regions sample.
We also analyse the radial velocity behaviour within the galaxy, and observe a similar situation to that of NGC7479 I. There is no difference, within the errors, when we compare our average value derived from the H emission line with the H velocities field map (Laine, 1996). If, however, the comparison is done against the H I rotation velocity map (Laine & Gottesman, 1998), knot B seems to follow galactic rotation whereas knot A does not.
3.3 NGC7479 III
The observed spectrum of this region shows, although weak, the [Oiii]4959,5007Å lines. This is probably owed to a difference in metallicity, NGC7479 III being slightly less metallic than the brightest two regions discussed above, or a difference in the ionisation structure. The latter might be due to a relatively small difference in the hardness of the ionisation radiation field (and, what is equivalent, in the ionising stellar population) responsible for the excitation observed in the spectra or a difference in the nebular geometry (see a detailed discussion in Díaz et al. 2007; Hägele et al. 2006, 2008; Pérez-Montero et al. 2010, and references therein). Unfortunately, as we said above, since no temperature sensitive lines can be observed, we are not able to derive their metallicities, and distinguish the origin of this small difference in the excitation present in the spectra of these regions of NGC 7479.
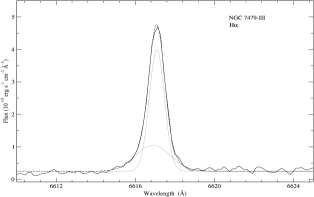
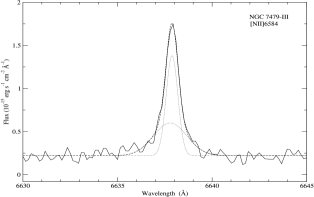
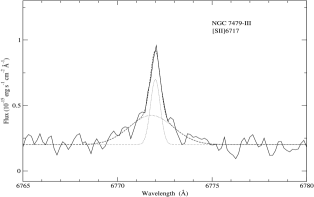
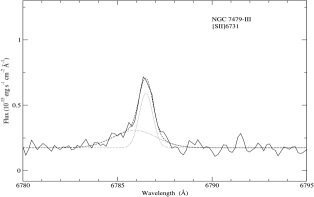
We identify and fit the Gaussian profiles to the [Oiii]5007Å, H, [Nii]6584Å and [Sii]6717,6731Å lines in NGC7479 III region with ngaussfit. In this region we have found one supersonic component, with no evidence of multiple contributions but it is possible to detect flux excess on the wings of the emission lines. We therefore fit a broad Gaussian component together with the narrow component (see Figure 7). This procedure works well for almost all detected lines. In the case of [Oiii]5007Å, however, there are no prominent residuals when we fit only one Gaussian component which has a dispersion of about 20 km s-1and we are therefore not able to fit a broad Gaussian component. For the other listed lines the derived radial velocities, the velocity dispersions (using =5.4 km s-1 and ) and errors are listed in Table 2. The overall H flux, uncorrected for reddening, is found to be 5.43 x 10⁻¹⁵ erg s-1cm-2. It is worth mentioning that there seems to be some systematic offset between the derived profile centres of the narrow and broad profiles which is, in average, about 10 km s-1. This happens for all lines, although it becomes more evident for [Sii]6731Å. An undiscovered blueshifted narrow component could account for the observed behaviour, although better signal-to-noise data are needed to confirm this hypothesis.
The radial velocity average derived for the single component is in agreement with the expected radial velocity at the position of NGC7479 III, showing only a slight offset of (10 km s-1), well within the uncertainties.
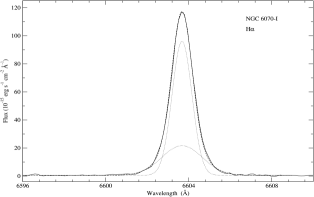
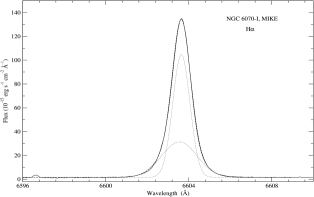
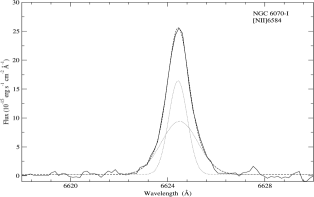
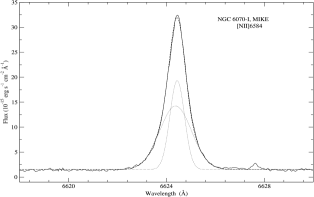
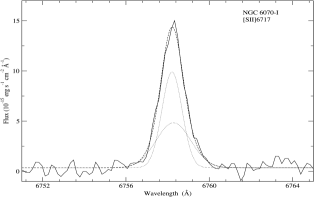
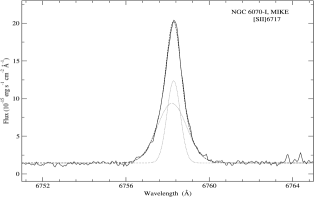
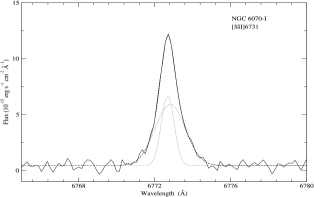
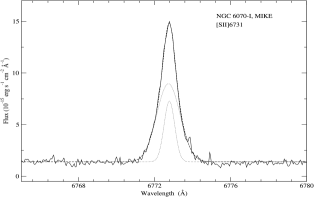
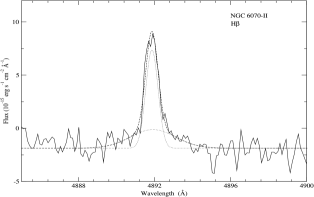
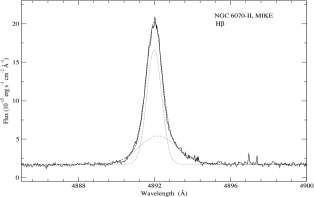
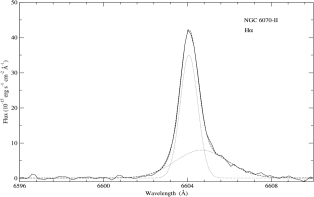
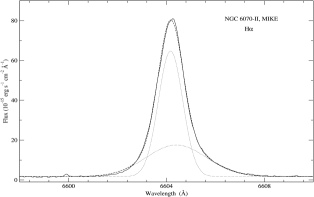
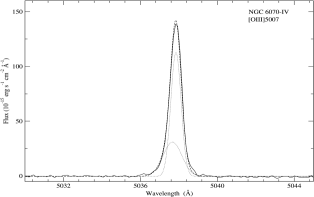
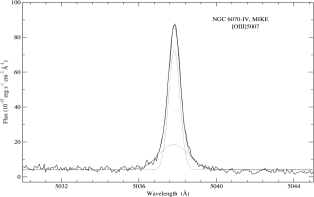
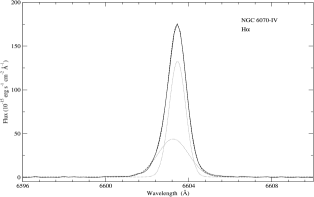
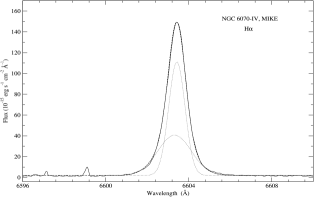
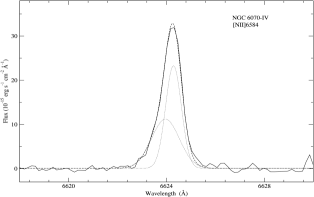
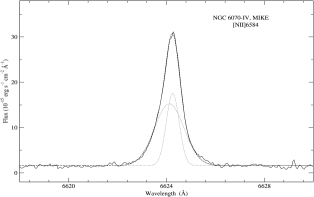
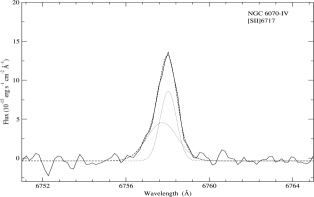
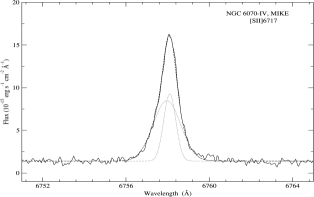
3.4 NGC6070 I, II & IV
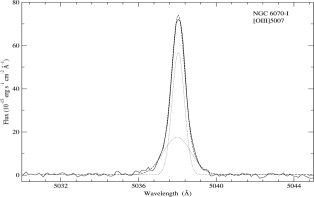
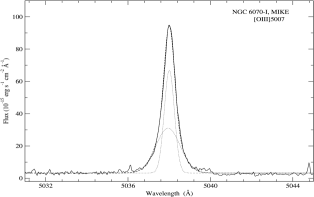
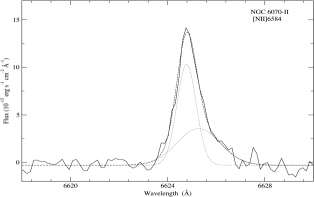
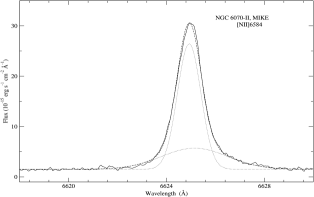
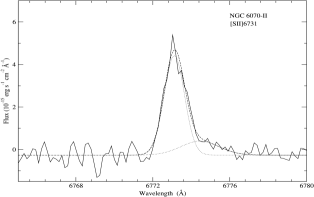
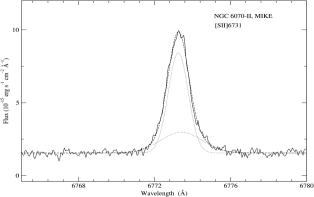
All regions observed in NGC 6070 show one narrow component together with the underlying broad component. We identify and fit the Gaussian profiles to the H, [Oiii]5007Å, H, [Nii]6584Å and [Sii]6717,6731Å lines in almost all regions. (see Figures 8-10). Table 4 shows the derived kinematical parameters (using = 5.3, 5.6 and 5.3 km s-1 for regions I, II and IV respectively; is set to for all regions).
| NGC 6070 I | NGC 6070 II | NGC 6070 IV | |||||||||||||||
| ion | comp. | Vr | error | error | EM | Vr | error | error | EM | Vr | error | error | EM | ||||
| du Pont data | |||||||||||||||||
| 4860 | H | narrow | … | … | … | … | … | 1883.4 | 1.1 | 14.4 | 2.3 | 59 | … | … | … | … | … |
| broad | … | … | … | … | … | 1886.8 | 12.7 | 72.4 | 21.7 | 41 | … | … | … | … | … | ||
| 5007 | [OIII] | narrow | 1871.1 | 0.8 | 18.4 | 1.1 | 59 | … | … | … | … | … | 1859.3 | 0.7 | 15.0 | 1.0 | 66 |
| broad | 1867.8 | 1.2 | 42.4 | 1.9 | 41 | … | … | … | … | … | 1848.7 | 0.7 | 28.9 | 1.2 | 34 | ||
| 6563 | H | narrow | 1868.3 | 0.6 | 17.2 | 0.8 | 69 | 1886.4 | 0.6 | 13.6 | 0.8 | 60 | 1858.0 | 0.6 | 12.2 | 0.8 | 62 |
| broad | 1868.3 | 0.9 | 42.9 | 2.0 | 31 | 1914.0 | 2.0 | 56.2 | 1.7 | 40 | 1848.4 | 0.7 | 31.2 | 0.9 | 38 | ||
| 6584 | [NII] | narrow | 1869.7 | 0.6 | 16.6 | 1.1 | 47 | 1885.6 | 0.9 | 17.2 | 0.9 | 55 | 1863.4 | 0.8 | 13.5 | 0.9 | 54 |
| broad | 1872.6 | 0.6 | 34.2 | 2.4 | 53 | 1908.1 | 2.3 | 40.7 | 2.6 | 45 | 1848.4 | 0.6 | 25.5 | 2.0 | 46 | ||
| 6717 | [SII] | narrow | 1865.2 | 1.7 | 21.2 | 3.2 | 55 | … | … | … | … | … | 1857.0 | 1.4 | 16.8 | 2.6 | 49 |
| broad | 1868.3 | 3.3 | 37.3 | 4.5 | 45 | … | … | … | … | … | 1844.3 | 6.1 | 33.0 | 5.0 | 51 | ||
| 6731 | [SII] | narrow | 1864.7 | 1.0 | 14.3 | 1.3 | 33 | 1883.5 | 1.3 | 23.1 | 1.9 | 79 | … | … | … | … | … |
| broad | 1870.3 | 1.6 | 35.4 | 1.9 | 67 | 1942.7 | 17.4 | 44.2 | 17.1 | 21 | … | … | … | … | … | ||
| MIKE data | |||||||||||||||||
| 4860 | H | narrow | … | … | … | … | … | 1890.9 | 0.3 | 20.0 | 0.4 | 61 | … | … | … | … | … |
| broad | … | … | … | … | … | 1902.8 | 1.1 | 60.3 | 1.6 | 39 | … | … | … | … | … | ||
| 5007 | [OIII] | narrow | 1868.4 | 0.3 | 13.6 | 0.4 | 49 | … | … | … | … | … | 1857.3 | 0.3 | 16.7 | 0.4 | 64 |
| broad | 1864.7 | 0.5 | 35.4 | 0.8 | 51 | … | … | … | … | … | 1855.9 | 0.9 | 46.0 | 2.0 | 36 | ||
| 6563 | H | narrow | 1866.9 | 0.2 | 13.4 | 0.3 | 62 | 1890.4 | 0.2 | 18.4 | 0.3 | 62 | 1856.8 | 0.2 | 11.9 | 0.3 | 58 |
| broad | 1862.4 | 0.3 | 37.2 | 0.4 | 38 | 1901.1 | 0.6 | 55.2 | 0.9 | 38 | 1851.6 | 0.4 | 34.6 | 0.5 | 42 | ||
| 6584 | [NII] | narrow | 1870.2 | 0.2 | 12.3 | 0.4 | 39 | 1892.6 | 0.2 | 21.3 | 0.3 | 68 | 1861.8 | 0.3 | 10.3 | 0.6 | 34 |
| broad | 1867.3 | 0.4 | 29.5 | 0.6 | 61 | 1902.7 | 1.1 | 62.5 | 1.1 | 32 | 1855.6 | 0.6 | 27.0 | 0.9 | 66 | ||
| 6717 | [SII] | narrow | 1868.7 | 0.2 | 13.3 | 0.3 | 38 | … | … | … | … | … | 1860.4 | 0.3 | 12.0 | 0.5 | 33 |
| broad | 1865.2 | 0.4 | 31.6 | 0.5 | 62 | … | … | … | … | … | 1854.2 | 0.4 | 29.3 | 0.6 | 67 | ||
| 6731 | [SII] | narrow | 1868.6 | 0.5 | 11.3 | 1.0 | 26 | 1889.1 | 0.3 | 23.0 | 0.5 | 70 | … | … | … | … | … |
| broad | 1866.4 | 0.7 | 27.1 | 0.8 | 74 | 1896.7 | 2.5 | 49.8 | 4.4 | 30 | … | … | … | … | … | ||
For these three regions, we are also able to compare the du Pont data with higher resolution spectra data obtained with the double echelle spectrograph MIKE in July 2004. The agreement in the kinematical parameters can be seen in Table 4, which shows the reliability of the data here presented. The overall H flux, uncorrected for reddening, for du Pont data are 1.68 x 10⁻¹³, 6.26 x 10⁻¹⁴ and 2.15 x 10⁻¹³ erg s-1cm-2 for regions I, II and IV respectively. And for MIKE data are 1.74 x 10⁻¹³, 1.29 x 10⁻¹³ and 1.88 x 10⁻¹³ erg s-1cm-2. Only a slight bias towards lower velocity dispersion can be seen for NGC6070 I, which can be probably attributed to differences in the centering of the slit during acquisition of the target. There seems to be some systematic offset between the derived profile centres of the narrow and broad profiles. Theses values are, in average, about -25 km s-1 for du Pont data and -10 km s-1 for MIKE data in the case of NGC 6070 II, and about 10 km s-1 and 5 km s-1 for NGC 6070 IV.
Regarding radial velocities of the three observed regions in NGC 6070, there is no detailed velocity map in the literature. We are able to compare them with rotation curves derived from long slit observations made by Márquez et al. (2002). Although the orientation of the slits does not match exactly the location of all our regions, the velocities are in fair agreement considering the angular distance of the Hii regions to the centre of NGC 6070.
3.5 Relation between H Luminosities and Velocity Dispersion
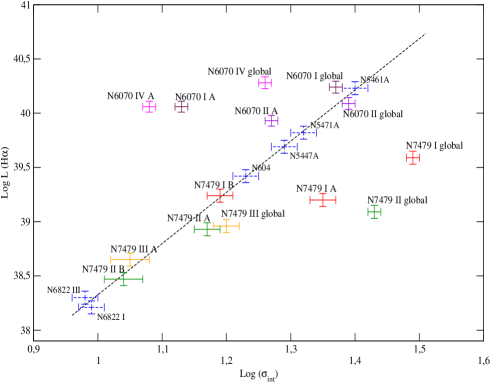
We have also analysed the impact that the presence of multiple components has on the location of Hii regions in the plane. To evaluate this we have plotted in Figure 11 the luminosities and velocity dispersions derived directly from our spectrophotometric data. Luminosities were derived from the fluxes measured directly from the component fitting to our echelle spectra (uncorrected by reddening), and using distances as published by Rozas et al. (1999) for NGC 7479 and by García-Gómez et al. (2002) for NGC 6070. We are aware that slit spectra might not provide the most realistic sample of the overall flux of the ionised nebula, but the accuracy of acquisition and guiding is not good enough as to allow us to perform a proper identification with published luminosity values in fields relatively “crowded” with Hii regions by Feinstein (1997) and Rozas et al. (2006). Velocity dispersion values and its errors are taken directly from Tables 2 and 4. The luminosity errors have been estimated taking into account the errors in the amplitude (A) and the FWHM in the component fitting (F=1.0645*A*FWHM), and the distance errors. As a reference value we have plotted a few Giant Hii regions from Bosch et al. (2002) together with their linear fit to their “young” GHii regions.
Inspection Figure 11 reveals that the distribution of points in the plane are strongly dependent on the components derived from the profile fitting. Individual components, labelled A and B (when applicable) as in their respective tables, and global values are those derived from a single Gaussian fitting to the line profile. As expected, individual components have smaller fluxes and velocity dispersions than the global profile and points are therefore shifted in the diagram. The incidence of this analysis has, however, a different outcome for regions in NGC 6070 and NGC 7479. In NGC 6070 the values derived from the global profile seem to lie, within observational errors, in the expected location if they follow the relation expected for virialised systems. When the individual components are plotted in the same diagram, only NGC 6070 II lies close to the regression, and NGC 6070 I and IV seem to be too luminous for their measured velocity dispersion. On the other hand, two out of three regions in NGC 7479 lie well away this regression if parameters are derived from a single Gaussian, but four out of five individual components show a very good agreement when plotted in the same diagram.
The interpretation of this behaviour is not straightforward. Definitely, the presence of more than one Gaussian component rules the final position of the Hii regions in the plane. Our high resolution spectroscopic data has allowed us to disentangle multiple kinematic components, which reflects in a big improvement in the x axis of the plot. But limitations in spatial resolution prevent us from identifying multiple components, if present, which do not become evident in the spectral signature. This has been a problem in previous attempts to derive relations in the as discussed by Bosch et al. (2002) when they were able to obtain photometry for individual knots within Giant Hii regions in M101.
4 Summary and Conclusions
From new high resolution spectra of the Hii regions NGC7479 I, NGC7479 II, NGC7479 III, NGC6070 I, NGC6070 II and NGC6070 IV obtained at the 100-inch du Pont Telescope, LCO, we have confirmed the giant nature of all these regions. We have also found that all of them show evidence of wing broadening evident mainly in the H line and confirmed in other emission lines. In five of them we are able to fit a broad component which explains the integral profile wings. Only in NGC7479 II can we fit the integrated profile wings with two narrow components symmetrically shifted in velocity with respect to the average of the two intense components.
NGC7479 I and NGC7479 II reveal the presence of two separated kinematic components with relatively narrow profiles in all analysed emission lines. For NGC7479 I region we can also generate 2D velocity images in H, [Nii]6584Å and [Sii]6717Å lines. These images show that the two narrow components are spatially resolved and the kinematical information helps to split the knot in the velocity-distance plane. There is also evidence of the presence of a broad component in all the narrower extracted sections, at least in the H emission line. For NGC7479 II region we can also fit two relatively narrow Gaussian components. In both regions the radial velocity average value of our components A and B derived from the H emission line matches the global velocity in the galaxy when we project our value over the isovelocity contours in H velocity field map. A similar comparison, using the H I map yields a value much closer to the value measured for component B. Then, we could only suggest that component A shows an odd kinematic behaviour. New observations with better spatial and spectral resolution are needed to clarify this point.
In the rest of the studied Hii regions, we find one narrow Gaussian component together with an underlying broad component, with no evidence of multiple narrow contributions. The radial velocity average derived for the narrower component corresponds to the one expected from galaxy rotation curves, within the observational errors, in all of these cases.
In most cases, the velocity dispersions of the broad components for these HII regions derived by optimal Gaussian fit are in agreement with Hägele et al. (2009, 2010) for circumnuclear star-forming regions with in H line 34 to 65 km s-1, and those derived by Chu & Kennicutt (1994) and Melnick et al. (1999) for 30 Doradus nebula with in H line 45 km s-1.
The estimated offsets between the narrow and broad components in NGC 7479 III, NGC 6070 II, and NGC 6070 IV are in complete agreement with the values found in NGC 2903 and NGC 3310 by Hägele et al. (2009, 2010) respectively, which are between -25 and 35 km s-1.
The distribution of the regions in the plane are strongly dependent on the components derived from the profile fitting. Individual components have smaller fluxes and velocity dispersions than the global profile and points are therefore shifted in the diagram. In NGC 6070 the values derived from the global profile seem to lie, within observational errors, in the expected location if they follow the relation expected for virialised systems. When the individual components are plotted in the same diagram, only NGC 6070 II lies close to the regression, and NGC 6070 I and IV seem to be too luminous for their measured velocity dispersion. On the other hand, two out of three regions in NGC 7479 lie well away this regression if parameters are derived from a single Gaussian, but four out of five individual components show a very good agreement when plotted in the same diagram. Definitely, the presence of more than one Gaussian component rules the final position of the Hii regions in the plane.
Acknowledgements
We are grateful to R. Terlevich for useful discussions and comments about the 2D velocity images that greatly improved the data analysis. We thank to C. Feinstein for providing us with the original data and images used for his published work and we are grateful to the director and staff of LCO for technical assistance and warm hospitality. Finally, we appreciate the comments and suggestions by the referee which significantly improved this paper. This research has made use of the NASA/IPAC Extragalactic Database (NED) which is operated by the Jet Propulsion Laboratory, California Institute of Technology, under contract with the National Aeronautics and Space Administration.
Support from the Spanish MEC through grant AYA2007-67965-C03-03 and from the Comunidad de Madrid under grant S-0505/ESP/000237 (ASTROCAM) is acknowledged by GH. VF and GB thank the Universidad Autónoma de Madrid, specially to Ángeles Díaz, for their hospitality.
References
- Arsenault & Roy (1988) Arsenault R., Roy J., 1988, Astronomy and Astrophysics, 201, 199
- Bohlin et al. (2001) Bohlin R. C., Dickinson M. E., Calzetti D., 2001, Astrophysical Journal, 122, 2118
- Bosch et al. (2002) Bosch G., Terlevich E., Terlevich R., 2002, Monthly Notices of the Royal Astronomical Society, 329, 481
- Chu & Kennicutt (1994) Chu Y. H., Kennicutt R. C. J., 1994, Astrophysical Journal, 425, 720
- de Vaucouleurs et al. (1991) de Vaucouleurs G., de Vaucouleurs A., Corwin H. G., Buta R. J., Paturel G., Fouque P., 1991, Third Reference Catalogue of Bright Galaxies. Volume 1-3, XII, 2069 pp. 7 figs.. Springer-Verlag Berlin Heidelberg New York
- Devereux (1989) Devereux N. A., 1989, Astrophysical Journal, 346, 126
- Díaz et al. (2007) Díaz Á. I., Terlevich E., Castellanos M., Hägele G. F., 2007, Monthly Notices of the Royal Astronomical Society, 382, 251
- Díaz et al. (1987) Díaz A. I., Terlevich E., Pagel B. E. J., Víilchez J. M., Edmunds M. G., 1987, Monthly Notices of the Royal Astronomical Society, 226, 19
- Erwin et al. (2008) Erwin P., Pohlen M., Beckman J. E., 2008, Astronomical Journal, 135, 20
- Feinstein (1997) Feinstein C., 1997, Astrophys. J. Suppl. S., 112, 29
- Firpo et al. (2005) Firpo V., Bosch G., Morrell N., 2005, Monthly Notices of the Royal Astronomical Society, 356, 1357
- Fuentes-Masip et al. (2000) Fuentes-Masip O., Muñoz-Tuñón C., Castañeda H. O., Tenorio-Tagle G., 2000, Astronomical Journal, 120, 752
- García-Gómez et al. (2002) García-Gómez C., Athanassoula E., Barberà C., 2002, Astronomy and Astrophysics, 389, 68
- García-Rojas et al. (2005) García-Rojas J., Esteban C., Peimbert A., Peimbert M., Rodríguez M., Ruiz M. T., 2005, Monthly Notices of the Royal Astronomical Society, 362, 301
- Grosbøl et al. (2004) Grosbøl P., Patsis P. A., Pompei E., 2004, Astronomy and Astrophysics, 423, 849
- Hägele (2008) Hägele G. F., 2008, PhD thesis, Universidad Autónoma de Madrid
- Hägele et al. (2007) Hägele G. F., Díaz Á. I., Cardaci M. V., Terlevich E., Terlevich R., 2007, Monthly Notices of the Royal Astronomical Society, 378, 163
- Hägele et al. (2009) Hägele G. F., Díaz Á. I., Cardaci M. V., Terlevich E., Terlevich R., 2009, Monthly Notices of the Royal Astronomical Society, 396, 2295
- Hägele et al. (2010) Hägele G. F., Díaz Á. I., Cardaci M. V., Terlevich E., Terlevich R., 2010, Monthly Notices of the Royal Astronomical Society, 402, 1005
- Hägele et al. (2008) Hägele G. F., Díaz A. I., Terlevich E., Terlevich R., Pérez-Montero E., Cardaci M. V., 2008, Monthly Notices of the Royal Astronomical Society, 383, 209
- Hägele et al. (2006) Hägele G. F., Pérez-Montero E., Díaz A. I., Terlevich E., Terlevich R., 2006, Monthly Notices of the Royal Astronomical Society, 372, 293
- Haynes et al. (1998) Haynes M. P., van Zee L., Hogg D. E., Roberts M. S., Maddalena R. J., 1998, Astronomical Journal, 115, 62
- Hippelein (1986) Hippelein H. H., 1986, Astron. Astrophys, 160, 374
- Ho et al. (1997) Ho L. C., Filippenko A. V., Sargent W. L. W., 1997, Astrophysical Journal Supplement, 112, 315
- Homeier & Gallagher (1999) Homeier N. L., Gallagher J. S., 1999, Astrophysical Journal, 522, 199
- Keel (1983) Keel W. C., 1983, Astrophysical Journal, 269, 466
- Laine (1996) Laine S., 1996, PhD thesis, University of Florida, USA, (1996)
- Laine (2001) Laine S., 2001, Astrophysics and Space Sciences, 276, 667
- Laine & Gottesman (1998) Laine S., Gottesman S. T., 1998, Monthly Notices of the Royal Astronomical Society, 297, 1041
- Laine & Heller (1999) Laine S., Heller C. H., 1999, Monthly Notices of the Royal Astronomical Society, 308, 557
- Márquez et al. (2002) Márquez I., Masegosa J., Moles M., Varela J., Bettoni D., Galletta G., 2002, Astronomy and Astrophysics, 393, 389
- Martinet & Friedli (1997) Martinet L., Friedli D., 1997, Astronomy and Astrophysics, 323, 363
- Medina Tanco et al. (1997) Medina Tanco G. A., Sabalisck N., Jatenco-Pereira V., Opher R., 1997, Astrophys. J., 487, 163
- Melnick et al. (1999) Melnick J., Tenorio-Tagle G., Terlevich R., 1999, Monthly Notices of the Royal Astronomical Society, 302, 677
- Mendez & Esteban (1997) Mendez D. I., Esteban C., 1997, Astrophysical Journal, 488, 652
- Osterbrock et al. (1996) Osterbrock D. E., Fulbright J. P., Martel A. R., Keane M. J., Trager S. C., Basri G., 1996, Publications of the Astronomical Society of the Pacific, 108, 277
- Pérez-Montero et al. (2010) Pérez-Montero E., García-Benito R., Hägele G. F., Díaz Á. I., 2010, Monthly Notices of the Royal Astronomical Society, pp 386–+
- Pohlen & Trujillo (2006) Pohlen M., Trujillo I., 2006, Astronomy and Astrophysics, 454, 759
- Quillen et al. (1995) Quillen A. C., Frogel J. A., Kenney J. D. P., Pogge R. W., Depoy D. L., 1995, Astrophysical Journal, 441, 549
- Relaño & Beckman (2005) Relaño M., Beckman J. E., 2005, Astronomy and Astrophysics, 430, 911
- Rozas et al. (2006) Rozas M., Richer M. G., López J. A., Relaño M., Beckman J. E., 2006, Astronomy and Astrophysics, 455, 539
- Rozas et al. (1999) Rozas M., Zurita A., Heller C. H., Beckman J. E., 1999, Astronomy and Astrophysics Supplement Series, 135, 145
- Saraiva & Benedict (2003) Saraiva M. F., Benedict G. F., 2003, Astronomy and Astrophysics, 409, 899
- Smith & Weedman (1970) Smith M. G., Weedman D. W., 1970, Astrophys. J., 160, 65
- Springob et al. (2005) Springob C. M., Haynes M. P., Giovanelli R., Kent B. R., 2005, Astrophysical Journal Supplement, 160, 149
- Tenorio-Tagle et al. (1993) Tenorio-Tagle G., Muñoz-Tuñón C., Cox D. P., 1993, Astrophys. J., 418, 767
- Terlevich et al. (1996) Terlevich E., Díaz A. I., Terlevich R., González-Delgado R. M., Pérez E., García Vargas M. L., 1996, Monthly Notices of the Royal Astronomical Society, 279, 1219
- Terlevich & Melnick (1981) Terlevich R., Melnick J., 1981, Mon. Not. R. Astron. Soc., 195, 839
- Westmoquette et al. (2007) Westmoquette M. S., Exter K. M., Smith L. J., Gallagher J. S., 2007, Monthly Notices of the Royal Astronomical Society, 381, 894
- Westmoquette et al. (2007) Westmoquette M. S., Smith L. J., Gallagher J. S., Exter K. M., 2007, Monthly Notices of the Royal Astronomical Society, 381, 913