Chromospheric activity among fast rotating M-dwarfs in the open cluster NGC 2516
Abstract
We report radial velocities (RVs), projected equatorial velocities () and Ca ii triplet (CaT) chromospheric activity indices for 237 late-K to mid-M candidate members of the young open cluster NGC 2516. These stars have published rotation periods between 0.1 and 15 days. Intermediate resolution spectra were obtained using the Giraffe spectrograph at the Very Large Telescope. Membership was confirmed on the basis of their RVs for 210 targets. For these stars we see a marked increase in the fraction of rapidly rotators as we move to cooler spectral types. About 20 per cent of M0–M1 stars have km s-1, increasing to 90 per cent of M4 stars. Activity indices derived from the first two lines of the CaT (8498Å and 8542Å) show differing dependencies on rotation period and mass for stars lying above and below the fully convective boundary. Higher mass stars, of spectral type K3–M2.5, show chromospheric activity which increases with decreasing Rossby number (the ratio of period to convective turnover time), saturating for Rossby numbers . For cooler stars, which are probably fully convective and almost all of which have Rossby numbers , there is a clear decrease in chromospheric activity as increases, amounting to a fall of about a factor of 2–3 between spectral types M2.5 and M4. This decrease in activity levels at low Rossby numbers is not seen in X-ray observations of the coronae of cluster M-dwarfs or of active field M-dwarfs. There is no evidence for supersaturation of chromospheric activity for stars of any spectral type at Rossby numbers . We suggest that the fall in the limiting level of chromospheric emission beyond spectral type M3 in NGC 2516 is, like the simultaneous increase in rotation rates in field stars, associated with a change in the global magnetic topology as stars approach the fully convective boundary and not due to any decrease in dynamo-generated magnetic flux.
keywords:
stars: rotation – stars: magnetic activity; stars: low-mass – clusters and associations: NGC 2516.1 Introduction
Measurements of the masses and radii of M-dwarfs are significantly discrepant from the predictions of evolutionary models (Ribas et al. 2008). Initial evidence for this comes from eclipsing binaries, where radii are 10–15 per cent higher at a given mass than predicted (López-Morales 2007; Morales et al. 2009). It has been suggested that the presence of dynamo-generated magnetic fields in what are relatively fast rotating stars, can suppress convection, produce cool star spots and hence reduce the stellar effective temperature (D’Antona, Ventura & Mazzitelli 2000; Mullan & MacDonald 2001; Chabrier, Gallardo & Baraffe 2007). Jackson, Jeffries & Maxted (2009) measured the radii of single, rapidly rotating M-dwarfs in the young open cluster NGC 2516. They found that their radii, at a given luminosity, are also larger than predicted by evolutionary models. The discrepancy increases from a few per cent for early (M0) M-dwarfs, to some 50 per cent for mid-M dwarfs (M4). The same evolutionary models correctly predict the radii of magnetically inactive M-dwarfs, thus implicating rotationally induced magnetic activity as the source of the discrepancy. Whilst this appears credible in qualitative terms, further data are required to correlate measurements of mass and radii with measurements of rotation, magnetic field strength and indicators of chromospheric and coronal activity.
In low-mass F-, G- and K-type stars, the ratio of coronal X-ray to bolometric flux, , or a variety of similarly defined chromospheric flux indicators, are used as proxies for magnetic activity. Magnetic flux and X-ray/chromospheric activity both appear to depend primarily on rotation rate, but also on the convective turnover time, as expected from simply dynamo models (e.g. Mangeney & Praderie 1984). Magnetic flux and magnetically induced emissions increase with rotation speed and with decreasing Rossby number – defined as the ratio of rotation period to convective turnover time (). However, for , magnetic activity reaches a saturation plateau where (Stauffer et al. 1994). Similar saturation plateaus are also found in chromospheric emission lines (Soderblom et al. 1993; James & Jeffries 1997). More limited observational evidence shows that for extremely fast rotating G- and K-stars with in the range 100 to 200 km s-1 (and hence ) there is a downward trend in from the saturation plateau (Pizzolato et al. 2003). This effect has been dubbed supersaturation by Prosser et al. (1996).
Less is known about the behaviour of magnetic activity in fast rotating M-dwarfs, but these may harbour crucial clues to the explanation of saturation and supersaturation. They have much deeper convection zones than hotter stars and as a result have longer convective turnover times and hence lower Rossby numbers at the same rotation period. Furthermore, main-sequence M-dwarfs with spectral types of M3 and cooler are probably fully convective (Siess, Dufour & Forestini 2000), so a dynamo operating at the interface between radiative core and convective envelope can no longer explain their magnetic activity.
Rotation and magnetic activity in low-mass M-dwarfs have been the focus of much recent work. The key points are that in field M-dwarfs there appears to be an abrupt change in rotational properties at spectral type M3. Hotter than this there are few rapid rotators, but for cooler stars there are many fast rotators and almost no slowly rotating stars (Delfosse el al. 1998; Reiners & Basri 2008; Jenkins et al. 2009). This has been interpreted as a rapid lengthening of the spin-down timescale, roughly coinciding with the transition to fully convective stars. Field M-dwarfs earlier than M3 show clear evidence of a rotation-activity relation similar to F-K stars for coronal indicators, including saturation at small Rossby numbers (Pizzolato et al. 2003; Kiraga & Stepien 2007). For fully convective stars the data are sparse. Most fully convective field M-dwarfs are likely to have very small Rossby numbers. Their coronal activity appears to saturate at out to spectral types of at least M6 (Delfosse et al. 1998; Reiners, Basri & Browning 2009), but peak levels of chromospheric emission, as measured by , are lower in stars cooler than M6 and may begin to decline at spectral type M4 (Mohanty & Basri 2003).
Supersaturation either in coronal or chromospheric indicators is largely uninvestigated for M-dwarfs, though tentative evidence for the effect has been claimed at X-ray wavelengths by James et al. (2000) and by Reiners & Basri (2010) for the chromospheric H emission of rapidly rotating M7-M9 dwarfs.
A difficulty in most of these studies is that they (understandably) concentrate on nearby field M-dwarfs. However, this inevitably leads to samples with a range of ages and metallicities, a wide spread of rotation velocities and often no information about rotation periods. A complementary approach is to target M-dwarfs in open clusters which are presumably coeval and chemically homogeneous and where ages and chemical compositions have already been determined from higher mass stars. The disadvantage here is the distance, but this can be mitigated using multiplexing instruments which operate over a significant area within a cluster – for example, simultaneous time-series montitoring of many M-dwarfs to find rotation periods or fibre spectroscopy of many targets in one exposure.
In this paper we report the results of intermediate resolution spectroscopy, over the wavelength range 8060Å to 8600Å, for 237 late-K to mid-M dwarfs. These are all photometric candidate members of the open cluster NGC 2516 with published rotation periods and an age of Myr (Irwin et al. 2007). The spectra were analyzed to identify cluster members and measure radial velocities (RVs), projected equatorial velocities () and chromospheric activity using the CaT lines. In section 2 we review the properties of NGC 2516. In sections 3 and 4 we report on our target selection and the observations and data analysis of fibre spectroscopy taken with the Very Large Telescope (VLT). Section 5 discusses the selection of cluster members from our data and presents their rotational properties. In section 6 the strengths of two of the CaT lines are used to determine levels of chromospheric activity. In section 7 the results are investigated with respect to spectral type, period and Rossby number to look for evidence of chromospheric saturation or supersaturation. In section 8 the results are compared with other observations and discussed in the context of current theories for the generation of magnetic fields and the magnetic topology in stars with masses above and below the fully convective boundary.
2 NGC 2516
NGC 2516 is a relatively close and well studied, young open cluster. The first reliable estimates of key parameters were by Cox (1955) who analyzed magnitudes and colours of 166 stars in NGC 2516 to estimate a distance of pc and reddening, . More recent papers have described membership surveys and characterisation of the cluster mass function (Jeffries, Thurston & Hambly 2001; Sung et al. 2002; Moraux, Bouvier & Clark 2005). The age of the cluster has been determined as 150 Myr from the nuclear turn off in high mass stars and the lithium depletion and X-ray activity seen in cooler stars (Jeffries, James & Thurston 1998; Lyra et al. 2006). Metallicity is close to solar; being determined spectroscopically as [Fe/H] and photometrically as [M/H]= (Terndrup et al. 2002). The same authors give an intrinsic distance modulus of based on main sequence fitting and a cluster reddening of . These values of distance modulus and reddening are used in this paper. The distance modulus is higher than the value of determined from the new Hipparcos catalogue (van Leeuwen 2009) but the difference is not critical for this paper.
The cluster contains a large population of low mass stars (Hawley, Tourtellot & Reid 1999, Jeffries et al. 2001). These cool stars show similar levels of chromospheric H emission to those in the Pleiades (Hawley et al. 1999) indicating significant magnetic activity. Irwin et al. (2007) described a monitoring survey of low mass stars in NGC 2516, reporting rotation periods for 362 candidate cluster members in the mass range 0.15 to 0.7 . A number of X-ray surveys have been carried out. The most recent and sensitive used a deep XMM-Newton observation to probe low mass members of the cluster down to spectral type M5 (Damiani el al. 2003; Pillitteri et al. 2006).
| Ref No. | Date & | Field Centre | Seeing | No. of |
| Run No. | start time | RA / Dec | Airmass | targets |
| 287508 | 27-11-07 | 118.639 | 0.79 | 45 (45) |
| 1 | 04:57 | -60.804 | 1.50 | |
| 287510 | 27-11-07 | 118.209 | 0.83 | 22 (21) |
| 2 | 05:53 | -61.107 | 1.35 | |
| 287512 | 27-11-07 | 119.102 | 0.74 | 44 (43) |
| 3 | 06:48 | -61.108 | 1.36 | |
| repeat | 27-11-07 | 119.102 | 0.90 | 44 (0) |
| 4 | 07:39 | -61.108 | 1.26 | |
| 287514 | 02-01-08 | 120.010 | 1.09 | 38 (38) |
| 5 | 06:25 | -61.265 | 1.27 | |
| 287516 | 29-11-07 | 119.804 | 1.25 | 55 (50) |
| 6 | 06:51 | -60.934 | 1.24 | |
| 287518 | 02-01-08 | 120.594 | 1.16 | 41 (41) |
| 7 | 05.31 | -60.790 | 1.24 | |
| 287520 | 30-12-07 | 120.097 | 0.90 | 39 (38) |
| 8 | 02:40 | -60.549 | 1.24 | |
| 287522 | 30-12-07 | 119.462 | 1.21 | 32 (22) |
| 9 | 01:44 | -61.402 | 1.76 | |
| The field centres are in degrees and average seeing in arcseconds. | ||||
| Values in brackets indicate the number of new targets observed. | ||||
3 Spectroscopic Observations
The spectroscopy targets were chosen from candidate NGC 2516 members reported by Irwin et al. (2007). These have rotation periods in the range 0.1 to 15 days and we selected from those in the range 14.5 I 18.5, corresponding to an approximate mass range of (Jackson et al. 2009). The targets were observed using the European Southern Observatory (ESO) 8.2m aperture Very Large Telescope (UT-2 Kueyen) FLAMES fibre instrument, feeding the Giraffe and UVES spectrographs. Between 22 and 55 of our targets were observed with Giraffe in each of eight separate fibre configurations (see Table 1). In each configuration, about 15 fibres were placed on “blank” sky positions and another were placed on other photometric candidate members of NGC 2516 with unknown rotation period. The Giraffe spectrograph was used with the HR20A grating, covering the wavelength range 8060-8600Å at a resolving power of 16 000. At least two bright, early-type stars in the same field of view were simultaneously observed using fibres feeding the UVES spectrograph at a resolving power of 47 000.
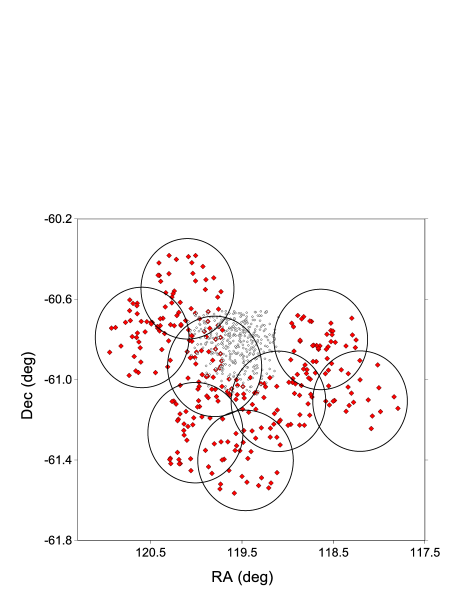
Details of the eight configurations are shown in Table 1 and their spatial locations indicated in Fig. 1. All targets were located within 25 arcmin of the field centres. Each configuration was observed with two sequential 1280 s exposures with Giraffe and three 800 s exposures with UVES. One configuration was observed twice during the same night. These repeated data were useful in assessing measurement uncertainties. A total of 360 spectra were recorded for 294 unique primary targets. Many targets were observed on more than one occasion, either in the repeated observation mentioned above or through different fibres in another, overlapping configuration (see Fig. 1).
It is worth noting in Fig. 1 that Irwin et al. (2007) concentrated their observations in the outskirts of NGC 2516 to avoid problems associated with bright, high-mass stars near the cluster centre. As a result there is little overlap between our target list and the X-ray sources found in the sensitive XMM-Newton observation of Pillitteri et al. (2006).
3.1 Extraction of target spectra
Many of the target spectra were faint, requiring optimal extraction to provide sufficient signal-to-noise ratio (SNR) for useful analysis. There was also strong telluric absorption and sky emission lines present. For these reasons we used our own purpose-built software for data reduction of the Giraffe spectra. However, the high SNR spectra produced from the software pipeline provided by ESO were found to be satisfactory for the telluric reference stars observed with UVES.
For the Giraffe data, images of the target fields and associated flat and arc exposures were debiased and rebinned to compensate for the initial curvature of the spectra on the CCD image. A median of 15 bias images was used for all compensation, with overscan regions used to correct for any time-dependent bias level. The flat frames were the median of three tungsten-lamp flat exposures recorded each day prior to night-time observations. A mask frame was prepared using a 3600 s dark frame. We rejected pixels accumulating more than 5 counts during this period, which appeared to eliminate bad pixels and also a small “hot” region in one corner of the CCD.
One dimensional spectra were extracted from the science frames using the procedure described by Horne (1986). This applies a non-uniform weight to pixels in the extraction sum, minimising statistical noise whilst preserving photometric accuracy. Horne showed that the ideal weighting function is the normalised spatial profile of the image at a given wavelength. In our case the spatial profile of the image was determined from a boxcar average of the flat field spectrum taken over 20 pixels in the wavelength direction. This averages out local variations in the response of individual pixels whilst still allowing the averaged profile to follow minor variations in the horizontal () position of the spectrum centre with wavelength. Science and flatfield spectra were extracted separately and the ratio taken to compensate for pixel-to-pixel response variations.
Arc spectra were extracted from Thorium-Argon lamp exposures recorded during the day prior to an observation. Gaussian fits were used to determine the locations of 13 well separated, unsaturated lines in the arc spectrum recorded through each fibre. Cubic polynomial fits to these were used to bin spectra onto a wavelength scale between 8061Å and 8614Å in 0.05Å steps. A fine adjustment was made to the wavelength scale of each observation through each fibre to compensate for time-dependent drift. The adjustment was determined by comparing the positions of emission lines in the median sky spectra of each observation to their positions in sky spectra averaged over all observations. The magnitude of the offset varied between 0.001Å and 0.008Å (0 to 0.3 km s-1).
Finally, target spectra were sky subtracted, averaged and corrected for telluric absorption. To allow for variations in fibre efficiency, the proportion of the median sky spectrum subtracted from each target spectrum was tuned to minimise the peak amplitude of the cross-correlation function between the sky-subtracted target spectrum and the median sky spectrum. Additionally, the sky subtracted spectrum was masked over the width of the major sky emission lines. The two exposures recorded within each observation block were averaged if they differed by less than otherwise the lower of the two local values was taken (to deal with cosmic rays). Spectra from each configuration were corrected for telluric absorption over the wavelength 8060Å to 8440Å using templates derived from the co-temporal UVES spectra of bright blue stars, which were broadened to mimic the spectral resolution of Giraffe. The broadened spectra showed only minor effects of telluric absorption for Å, so no telluric compensation was made in this wavelength range.
4 Radial and Projected Equatorial Velocities
To determine radial velocities (RV) and projected equatorial velocities (), the spectra of target stars were rebinned onto a logarithmic scale and convolved with template spectra of standard stars over the wavelength range 8061Å to 8530Å, deliberately avoiding the chromospherically contaminated CaT lines and masking out major sky emission features. Templates of type K4.5V (HD 209100) and M6V (HD 34055) from the UVES atlas (Bagnulo et al. 2003) were used, encompassing the full range of target spectral types. These were broadened using a Gaussian kernel to match the resolution of the Giraffe spectra. A Gaussian profile, was fitted to the peak in the cross-correlation function over a width of . The offset of this profile gave the relative RV of the target star and its width, , gave a measure of rotational broadening that we used to estimate . For spectra with a SNR , there was usually a clearly defined, single peak in the cross-correlation function that could be fitted with a Gaussian profile to determine a unique RV and . For spectra with average SNR , the cross-correlation peak was often sufficiently distorted by random noise that we considered the results unreliable and these targets were rejected from our sample at this stage.
| Identifier | RA | Dec | Period | V | SNR | RV | Run | |||
|---|---|---|---|---|---|---|---|---|---|---|
| (J2000) | (J2000) | (d) | (mag) | (mag) | (mag) | (km s-1) | (km s-1) | Nos. | ||
| N2516-1-1-1470 | 7 57 8.92 | -61 29 18.6 | 8.803 | 17.67 | 15.49 | 13.47 | 26 | -0.560.47 | 8.00 | 9 |
| N2516-1-1-1667 | 7 57 16.58 | -61 31 38.7 | 1.347 | 15.74 | 14.53 | 12.72 | 44 | 0.160.46 | 21.981.91 | 9 |
| N2516-1-1-2490 | 7 57 47.14 | -61 30 37.5 | 0.968 | 19.97 | 16.99 | 14.69 | 10 | 1.431.80 | 25.633.04 | 9 |
| N2516-1-1-3264 | 7 58 20.21 | -61 33 53.8 | 1.320 | 19.61 | 16.77 | 14.32 | 11 | 2.501.61 | 24.123.07 | 9 |
| N2516-1-1-351 | 7 56 28.22 | -61 27 46.6 | 2.318 | 18.99 | 16.35 | 14.17 | 16 | 1.400.80 | 14.443.8 | 9 |
| N2516-1-1-3695 | 7 58 34.29 | -61 27 08.0 | 9.606 | 16.95 | 14.97 | 12.97 | 33 | 1.770.41 | 8.00 | 9 * |
| N2516-1-1-958 | 7 56 49.99 | -61 32 19.9 | 6.291 | 18.48 | 15.99 | 13.63 | 19 | 1.060.61 | 8.00 | 9 |
RVs were heliocentrically corrected to an arbitary zeropoint for each standard. Values of were determined from the measured widths using calibration curves derived by broadening standard star spectra to simulate a series of known rotation velocities. This was done in two stages. The standards were first broadened with a Gaussian to match the cross-correlation function widths to the average width, , obtained for 40 slow-rotating targets (with period, days), as these were expected to have negligible broadening compared with the spectral resolution. This gave “zero velocity” widths of km s-1 and km s-1 for the K4.5 and M6 standards respectively. These broadened spectra were then convolved with rotational broadening kernels for values between 0 and 100 km s-1. A linear limb darkening coefficient of 0.6 was used (Claret, Diaz-Cordoves & Gimenez 1995), but the results are insensitive to this parameter. Originally it was intended to interpolate between values found from the two templates, using colour as a proxy for spectral type. However, we found that the two values did not differ significantly, either on average or as a function of colour, so we took their average to minimise any uncertainty.
4.1 Uncertainty in RV and
Uncertainties in the RV and measurements were determined by comparing repeated measurements made on a subset of the targets. The functional form of the uncertainty in RV and width was found by analysing the uncertainty produced by convolving artificially broadened standards with dummy spectra, generated by injecting random noise of a Gaussian distribution at increasing levels of SNR into the standard spectra.This indicated an uncertainty of the form
| (1) |
for both RV and the width of the cross-correlation function, where , and are empirically derived constants.
The constants and which characterise the effects of noise in the measured spectra were found by comparing RVs and widths measured for 60 targets (44 with measured periods) in the repeated runs with the same configuration (see Table 1). The constant which represents additional uncertainties due to changes in fibre allocation and night-to-night calibration variations was estimated by comparing results from spectra for 16 targets recorded on different days with different fibre allocations. The empirically derived uncertainties in RV and cross-correaltion width were
| (2) |
| (3) |
The uncertainty in was then determined from its relationship with and the “zero velocity width” for a particular standard.
| (4) |
where is a scaling constant. Hence the uncertainty in is
| (5) |
4.2 Tabulated results
Spectra with SNR5 were obtained for 239 stars with known periods. One of these (N2516-3-8-1301) showed a clear double peak in the cross correlation and is almost certainly a double-lined spectroscopic binary. The other (N2516-1-2-369) shows a more noisy cross-correlation and is a possible binary system. The measured RV and for the remaining 237 targets are given in Table 1. and photometry was initially taken from Irwin et al. (2007), but we corrected their photometric values to put them onto the better calibrated photometric scale of Jeffries et al. (2001), using a set of stars common to both papers. The corrections added to the Irwin et al. values were and . magnitudes are from the Two-micron All-Sky Survey (2MASS) catalogue (Cutri et al. 2003), transformed to the CIT system using (Carpenter 2001).
The RVs quoted in Table 1 are given relative to the average cluster RV, estimated using the RVs of slowly rotating cluster members ( km s-1, see section 5.1). A minimum resolvable value of of 8 km s-1 was taken for . At this level of broadening the increase in measured width is times the standard deviation of the “zero rotation” width; hence there is a 90 per cent probability that is truly non-zero. For targets with repeated measurements the Table shows the weighted mean of the RV and with appropriate errors. None of the targets with repeated RV measurements showed significant evidence for binarity. The right hand column of Table 1 indicates the run number(s) for the observation. The 27 targets with periods that were identified as non-members are flagged with an asterisk.
5 Results
5.1 Membership
In this section we aim to establish a secure list of cluster members based on photometric colour and RV. Chromospheric activity and rotation are not used as indicators of membership since we wish to study the distribution of these parameters for cluster members. All target stars were identified as potential cluster members by Irwin et al. (2007) based on their position in the / colour magnitude diagram. We made a further selection based on RV relative to the mean RV of cluster members.
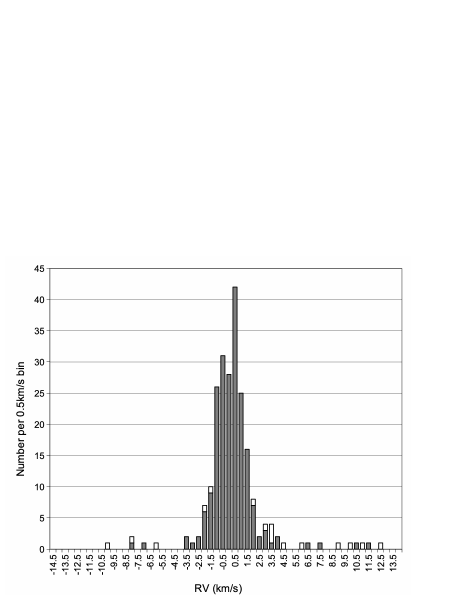
Figure 2 shows a histogram of targets as a function of relative RV in 0.5 km s-1 bins. These are tightly bunched, within a few km s-1, suggesting that the majority of the 237 targets are indeed cluster members. For the purposes of this paper cluster members were defined conservatively as those stars with a measured RV less than from the mean RV, where is the effective velocity dispersion due to the combined effects of RV uncertainty and the true velocity dispersion of the cluster. Assuming the same functional form as equation 1 then the total dispersion will vary as
| (6) |
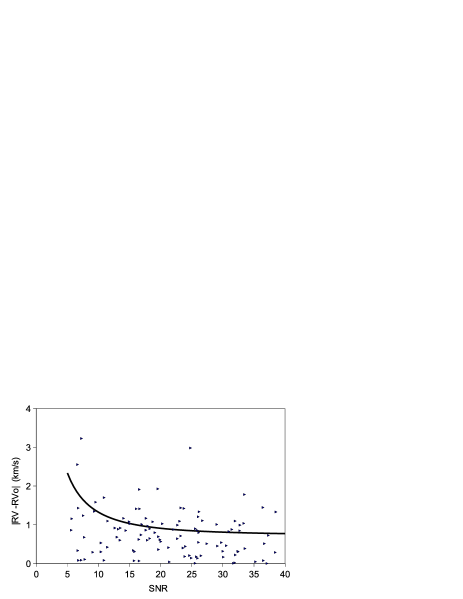
where is the intrinsic velocity dispersion of cluster stars. Figure 3 shows a plot of the modulus of the relative RV against SNR for the slower rotators ( km s-1). Taking the mean RV as the average value clipped at 5 km s-1 then a least squares fit to the relative RV of the slower rotators gave
| (7) |
The constant term 0.72 0.17 km s-1 places an upper bound on the intrinsic velocity dispersion for M-dwarfs in the cluster. The constant was estimated by comparing RVs for repeated measurements made on different days with different fibre configurations. This gave a value of km s-1 (see equation 2) and hence our best estimate for the true velocity dispersion of the cluster is 0.660.17 km s-1.
Using equation 7 gave 210 probable cluster members with a SNR5 and a relative RV less than from the mean (see Fig. 2). A few fast rotating stars with a correspondingly large RV uncertainty were identified as members even though their RVs are some distance from the mean in absolute terms. There is no reason to doubt their membership since fast rotators are rare amongst late-K to mid-M dwarf field stars (Delfosse et al. 1998). Also shown in Fig. 2 is the number of stars classified as non-members. Nine of the non-members lie between and of the mean so could yet be cluster members (possibly SB1 binary systems), as for a Gaussian distribution we expect further members to lie beyond . Others may be be background or foreground stars. To estimate the maximum number of background stars falsely classified as members, the average number of targets in bins centered at km s-1 from the cluster mean was counted. On average these bins contained 3 non-members with periods. Assuming that the distribution of non members is uniform with RV this indicates that of the 210 stars identified as members are likely to be non-members.
5.2 Rotation rates for cluster members
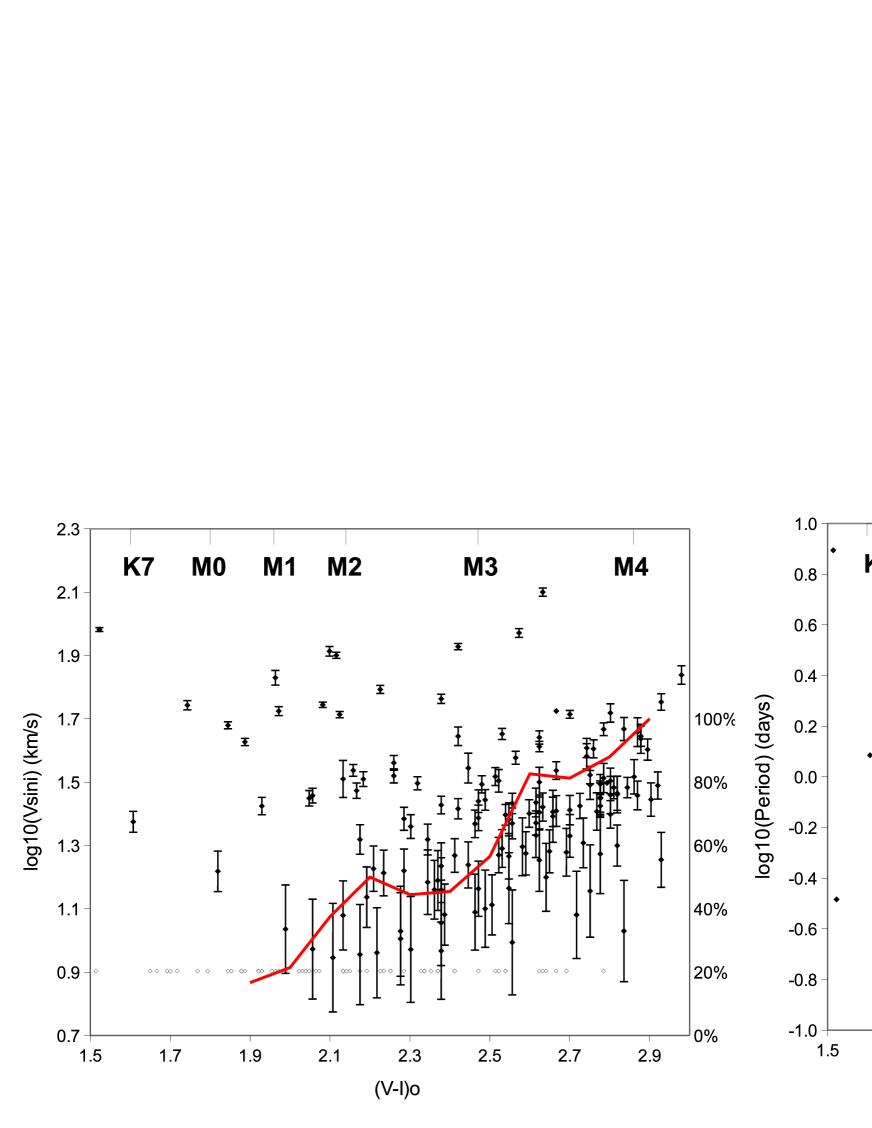
Figure 4 shows the distribution of of and period as a function of colour for cluster members with measured periods. Colour is corrected for reddening assuming a uniform reddening of (Terndrup et al. 2002) and ratios of selective to total extinction (Reike & Lebofsky 1985) and . Spectral types are shown using the calibration from Kenyon & Hartmann (1995).
For the late-K and early-M stars, the distribution of and period are similar to those seen in other clusters at a similar age (e.g. the Pleiades, see Queloz et al. 1998, Terndrup et al. 2000). There is a wide range of rotation rates and periods, with significant populations of slowly rotating stars (periods of a few days and unresolved) and a tail of fast rotators with between 50 and 100 km s-1.
Rotation velocities appear to increase (a decrease in period) as we move to later M-type stars. Of course, the presence of lower limits to means an average cannot be calculated directly. Instead, Fig. 4 shows (on the right-hand -axes) the fraction of rapid rotators with km s-1 or period days, as a function of colour in 0.1 mag bins. These two criteria are approximately equivalent for stars with a radius of 0.6 . The plots show that the fraction of rapid rotators is a sharply increasing function of colour (or decreasing mass). About 90 per cent of stars of spectral type M4 are rapid rotators, compared to about 50 per cent at M3 and only per cent at M0-M1.
This spectral type dependence appears to set in during the first few Myr of stellar evolution and develop slowly over time (Irwin et al. 2007). Samples of field stars, presumably with ages measured in Gyr, have almost no fast rotators earlier than type M3, but a sharp increase in the fraction of rapid rotators among cooler stars (Delfosse et a. 1998; Jenkins et al. 2009; Browning et al. 2010). West et al. (2008) have calibrated age-magnetic activity relationships for field M-dwarfs, suggesting that while M0 dwarfs have an “activity lifetime” of 0.8 Gyr, this increases to 4.5 Gyr for M4 dwarfs. Magnetic activity is closely related to rotation rate, so it is not surprising that the Myr old M0–M2 stars in NGC 2516 rotate much faster on average than field stars (where the majority of field stars would have spun down), but have similar rotation rates to the cooler field stars, which have not had time to spin down.
The usual interpretation of these phenomena (e.g. Delfosse et al. (1998; Jenkins et al. 2009 ) is that spin-down timescales become much longer for cooler stars because the change from stars with radiative cores to fully convective stars changes the magnetic topology and makes angular momentum loss less efficient. As the vast majority of targets with rotation periods have been confirmed here as cluster members, then we refer the reader to Irwin et al. (2007), where the rotation period distribution is modelled in some detail in terms of angular momentum loss from a magnetized stellar wind.
6 Calcium triplet lines
The wavelength range of our spectra (8061–8614Å) includes two of the CaT lines at rest wavelengths of 8498Å and 8542Å. The CaT shares an upper level with the better known Ca ii H and K lines, which are more often used as chromospheric activity indicators. The CaT lines are also known to be effective indicators of chromospheric activity, with stars of similar luminosity and metallicity having different CaT line depths, owing to varying levels chromospheric emission filling the underlying absorption lines (Mallik 1994, 1997). Busà et al. (2007) show that the chromospheric component of the CaT lines is well correlated with the chromospheric Ca ii H and K flux.
The method used here to measure the strength of the CaT chromospheric emission follows that described by Marsden, Carter & Donati (2009). We estimate the chromospheric component of the CaT flux by subtracting the photospheric contribution from a magnetically inactive star of similar spectral type.
6.1 Reference spectra
Marsden et al. (2009) used this technique to measure CaT emission in F,G and K stars. The difficulty in using it for M dwarfs is finding suitable reference spectra at these spectral types with known low rotation and chromospheric activity. Several sources were investigated but none alone could provide a well defined set of standards spanning the range K3 to M5. For this reason results from several sources were combined to generate a semi-empirical reference spectra by scaling the measured high SNR spectrum of a magnetically inactive K3 standard by a colour-dependent scaling factor determined from lower SNR spectra of late-K and M dwarf stars.
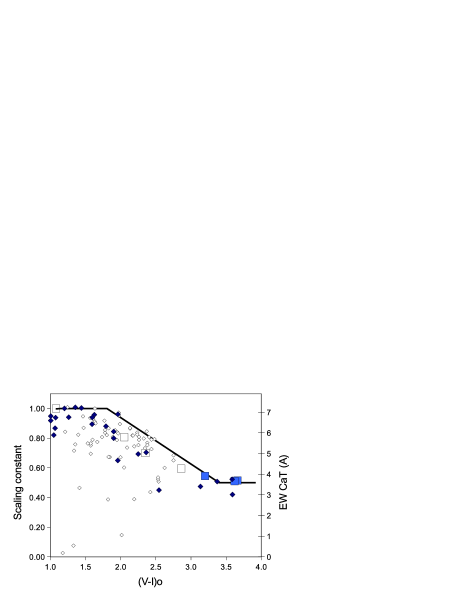
The first source of reference spectra was the library of high resolution spectra of Montes and Martín (1988). This yielded high SNR spectra for a K3 star (GJ105a), an M1.5 star (GJ15a), an M2.5 star (GJ623ab) and an M4 star (GJ748). Unfortunately only the first of these stars, GJ105a, has a known long rotation period of 48 days, and low chromospheric activity indicated by its Ca ii H and K lines (Baliunas et al. 1995). For this reason the spectra of this K3 star, braodened to match the resolution of the target spectra, was chosen as the baseline for semi-empirical reference spectra. This broadened spectrum was then scaled using a factor equal to the ratio of the average depths of the two CaT lines seen in the spectra of stars of later spectral types to those seen in the K3 standard. The scaling factor was determined as a function of .
Figure 5 shows the scaling factor for the Montes & Martín (1988) spectra (as large open squares). The relative depths of CaT lines for these M-dwarf spectra are between 20 and 40 per cent lower than the K3 standard. Unfortunately these spectra cannot be directly used as standards since their degree of activity is not known. Instead we combined these with other spectra to try and delineate the upper boundary of the scaling factor (as a function of colour), which should be defined by the least chromospherically active stars.
A second source of low activity stars are our spectra of targets identified as non-members and for which no periods were reported by Irwin et al. (2007). We additionally filtered these targets on the basis that they had km s-1, a SNR and that their sodium lines at 8183Å and 8193Å had a total equivalent width greater than 1Å indicating that they are dwarf stars rather than background giants (Schiavon et al. 1997). There is a good chance that this subsample contains a number of older, less active stars. Figure 5 shows the relative depths of the CaT lines of these stars as open diamonds.
To extend the range of spectral types beyond M4, additional results were added for three stars, (LHS 3075, LHS 1950 and LHS 302) with known low chromospheric activity ( not in emission) and low measured ( km s-1) (Jenkins et al. 2009). The spectra for these stars (supplied by Jenkins, private communication) were too noisy to be used directly as standards, however (after broadening to match the resolution of the target spectra) they could be used to estimate the relative depth of the CaT lines compared to the K3 standard. These results, shown as filled squares in Fig. 5 confirm that the relative depth of the first two CaT lines falls by per cent between spectral types K3 and M5, presumably owing to depression of the local continuum by increasing molecular opacity.
Finally, we investigated the library of low resolution spectra assembled by Cenarro et al. (2001). The resolution of these spectra (1.5A) is too low for them to be used as standards however we measured the variation in the total equivalent width (EW) of the CaT lines as a function of spectral type. This is not directly comparable with the relative depth of the CaT lines (unless the line profile is independent of colour) but should be broadly similar. Figure 5 shows as solid diamonds the variation of the Paschen-corrected EW of the CaT triplet taken from Table 6 of Cenarro et al. 2001, where the V-I colours are derived from the reported effective temperatures using the colour-temperature relation of Kenyon & Hartmann (1995). The EWs (shown in Å on the RH axis) are scaled to match the K3 standard at the blue end of the plot. The results show a similar upper bound to the previous results, indicating that the variation in scaling constant with colour is closely related to the changes in the underlying EW of the CaT absorption line with spectral type.
The results in Fig. 5 were used to define a semi-empirical reference spectrum, , as a function of colour, which represents chromospherically inactive stars. Using the normalised spectrum of the K3 reference star local to the first two CaT lines and a scaling constant, , we define
| (8) |
We modelled using a simple by-eye three-part linear function to represent the upper boundary of the points in Fig. 5, which we assume represents the CaT line depths for chromospherically inactive stars, where for ( M0) and decreases linearly to for ( M5).
6.2 Equivalent widths of the CaT emission lines
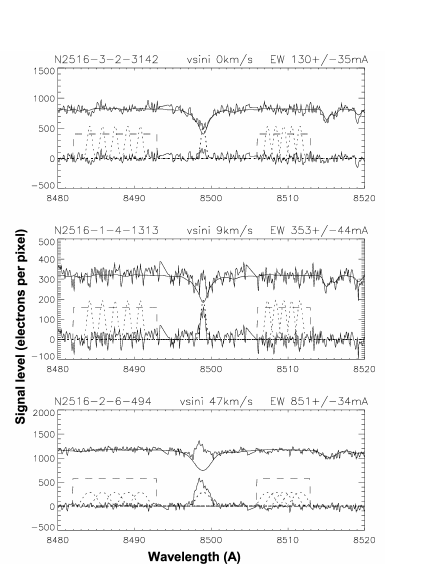
The EWs of the first two CaT emission lines were measured by comparing a section of the the target spectrum local to the CaT line centre, , with the reference spectrum, (see Fig. 6). The reference spectrum was aligned in wavelength and convolved with a broadening kernel, according to the RV and of the target. The target and reference spectra were then normalised to their average levels either side of the CaT line centres over the wavelength ranges indicated in Fig. 6. The reference spectrum was subtracted from the target spectrum to produce a difference spectrum
| (9) |
The EW of the CaT features in gave a measure of chromospheric activity.
In practice the difference spectra can be noisy and the width of the residual chromospheric component depends on the of the target. Integrating under would give different estimates of EW depending on the integration limits. This problem was circumvented using an “optimal extraction” technique – i.e. multiplying the difference spectrum by a Gaussian profile of unit area, which represents the expected profile of the difference spectrum produced by a chromospheric emission line. The width of the Gaussian profile for slowly rotating stars was found by fitting a Gaussian to the difference spectra of 25 long-period stars which showed significant CaT emission lines. This gave a width Å. A Gaussian profile, re-centred according to the target RV and broadened beyond according to , gave a function , which was used to determine the EW as:
| (10) |
Examples of are shown in Fig. 6 as dotted lines centred at the expected emission line wavelength. The uncertainty in the EWs due to noise in the spectrum was estimated as the rms value of the EWs measured using the same centred at five wavelengths either side of the emission line.
| Identifier | Period | Turnover | EW8488 | EW8542 | log10 | log10 | Run | ||
|---|---|---|---|---|---|---|---|---|---|
| (days) | time | Rossby | (Å) | (Å) | R’Ca8488 | R’Ca8542 | Nos. | ||
| (days) | No. | ||||||||
| N2516-1-1-1470 | -1.23 | 8.803 | 52 | -0.77 | 0.450.02 | 0.500.03 | -4.47.02 | -4.42.02 | 9 |
| N2516-1-1-1667 | -0.88 | 1.347 | 35 | -1.41 | 0.420.01 | 0.590.01 | -4.49.01 | -4.34.01 | 9 |
| N2516-1-1-2490 | -1.77 | 0.968 | 96 | -2.0 | 0.290.07 | 0.280.05 | -4.70.05 | -4.71.06 | 9 |
| N2516-1-1-3264 | -01.7 | 1.320 | 89 | -1.83 | 0.630.04 | 0.500.04 | -4.35.05 | -4.45.05 | 9 |
| N2516-1-1-351 | -1.55 | 2.318 | 75 | -1.51 | 0.490.04 | 0.460.05 | -4.45.03 | -4.48.03 | 9 |
| N2516-1-1-3695 | -1.04 | 9.606 | 42 | -0.64 | 0.310.01 | 0.370.02 | -4.62.01 | -4.55.02 | 9 * |
| N2516-1-1-958 | -1.41 | 6.291 | 64 | -1.01 | 0.410.02 | 0.470.01 | -4.52.03 | -4.46.03 | 9 |
6.3 Chromospheric activity indices
We define the activity index as the fraction of a star’s bolometric luminosity emitted from the chromosphere in a CaT line. The conversion between the EW of the chromospheric component of the CaT line and the flux (in erg cm-2 s-1) was established by measuring the continuum flux densities in our defined continuum windows (see Fig. 6) in K- and M-dwarfs from the standard spectral library of Pickles (1998). Using the colours tabulated by Pickles for these stars and their -band fluxes we fitted the following relationship
| (11) |
where is the intrinsic Cousins -band magnitude and EWCa is the EW of either of the CaT lines (the difference in continuum levels is 0.01 dex or less). The bolometric flux is given by
| (12) |
where is the -band bolometric correction (Allen 1973). The difference in these expressions defines the activity index
| (13) |
The bolometric corrections were interpolated from the the dereddened colours using Table A5 of Kenyon & Hartmann (1995). Measurement uncertainties in the activity indices were estimated by comparing repeated observations of the same target. Comparisons for 78 targets showed an uncertainty of in calculated for individual lines (listed in Table 3). This reduced to when the value of was determined from the mean of the EWs of the two CaT lines. Additional random uncertainties arise from the photometry and consequent bolometric correction, but these act in opposite directions and almost cancel (e.g. an increase in from 2.5 to 2.6, would decrease the assumed by about 0.13 mag).
Systematic uncertainties could also be present. The basal photospheric flux level in the CaT lines has been estimated from a known magnetically inactive star in the case of the K-stars, but we have been forced to estimate a basal photospheric flux in M-stars by looking for the deepest photospheric CaT lines in objects with poorly constrained activity levels. We believe this procedure is reasonably robust and demonstrates a trend with colour that agrees with previous work on field stars (see Fig. 5). In addition the spectra of a number of slowly rotating mid-M dwarfs with H in absorption (and therefore presumably inactive) also lie at this basal level. Nevertheless it is possible that all of the stars considered in Fig. 5 have some residual level of chromospheric activity resulting in a misleadingly weak photospheric basal level and hence underestimated chromospheric activity at later spectral types. However, even if were flat as a function of colour, this would only increase by about 0.2 dex in the coolest M4 stars – which assumes an importance in the next section.
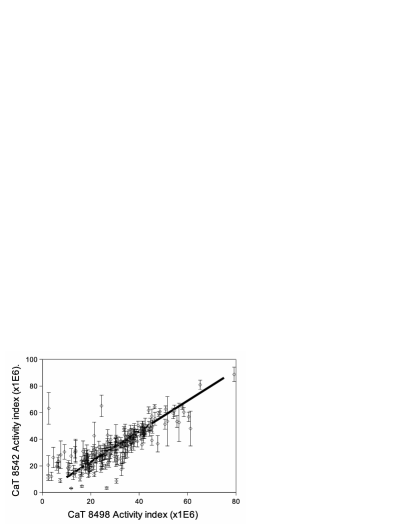
Figure 7 compares activity indices from the two CaT lines. The results show the expected linear correlation for activity indices above . The 8542Å line is the stronger by about 14 percent. The emission EWs and chromospheric activity indices for the 8498Å and 8542Å CaT lines are listed separately in Table 3. The uncertainties in the EWs are those estimated in the extraction process. Uncertainties in are as defined above. In what follows, the plotted values of are calculated from the mean of the two CaT lines.
7 Magnetic activity versus rotation and spectral type
7.1 Chromospheric activity
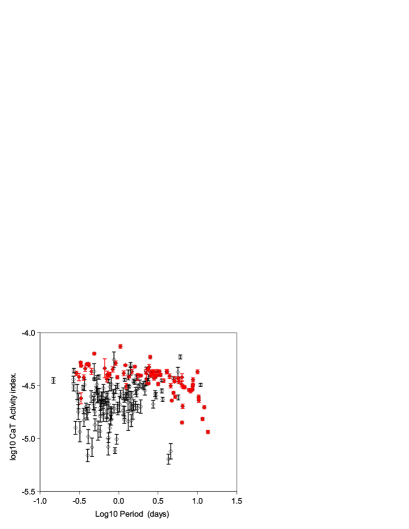
Figure 8 shows the mean chromospheric activity index plotted against rotation period. This plot shows considerable scatter, much more than expected from the measurement uncertainties, suggesting either that the chromospheric activity is very variable in time or that rotation period is not the sole parameter controlling chromospheric activity. If we consider results by spectral type then the earlier K3–M2.5 stars () in our sample show an initial increase in activity index with reducing period, which levels off for periods below about 3 days. Almost all stars of spectral type cooler than M2.5 have periods shorter than 3 days and show roughly the same constant activity index, but with a rms scatter of 0.2 dex. The level of chromospheric activity appears to have a spectral type dependence, because the activity indices of the short-period K3–M2.5 stars are systematically higher on average than those of the M2.5 sample by about 0.3 dex. As we discuss below, the choice of spectral type M2.5 as a division point is driven by the likely location of the point at which M-dwarfs become fully convective in NGC 2516.
The conflation of rotation and spectral type in determining activity levels has been widely studied in F–K stars and unification has been achieved by combining these parameters to study magnetic activity as a function of Rossby number: – the ratio of period to convective turnover time, where the denominator is spectral-type dependent.
The use of Rossby number raises a problem when dealing with M-dwarfs. The widely used semi-empirical formula of Noyes et al. (1984) predicts as a function of . This relationship is poorly defined for and has no constraining data in the M-dwarf regime. Theoretically, little work has been done on turnover times at very low masses. The models of Gilliland (1986) show that increases with decreasing mass, from about 12 days at to 70 days at . Similar calculations, with similar results (except for arbitrary scaling factors) have been presented more recently by Kim & Demarque (1996) and Ventura et al. (1998). The latter also attempted to extend the calculation into the fully convective region, predicting that the convective turnover time would continue to increase.
An alternative approach has been to empirically determine by demanding that activity indicators (chromospheric or coronal) satisfy a single scaling law with Rossby number, irrespective of stellar mass (e.g. Noyes et al. 1984). The most recent work has focused on coronal X-ray emission using as an activity indicator. Using a mixture of slow- and fast-rotating stars, Pizzolato et al. (2003) showed that needs to increase rapidly with decreasing mass in order to simultaneously explain the behaviour of in G-, K- and M-dwarfs, and they find days for . Similar work by Kiraga & Stepien (2007) concentrated on slowly rotating M-dwarfs, finding that increases from 30 days at to days at . An interesting insight into this behaviour was provided by Pizzolato et al. (2003), who noted that the mass dependence of the turnover time is closely reproduced by assuming it is proportional to . In what follows we follow Pizzolato et al. and adopt a Rossby number calculated from the following equation
| (14) |
where has been anchored such that for a solar-type star and is calculated from the bolometric fluxes previously described and an assumed cluster distance modulus of 7.93. The adopted values for our sample are listed in Table 3 along with the derived Rossby numbers.
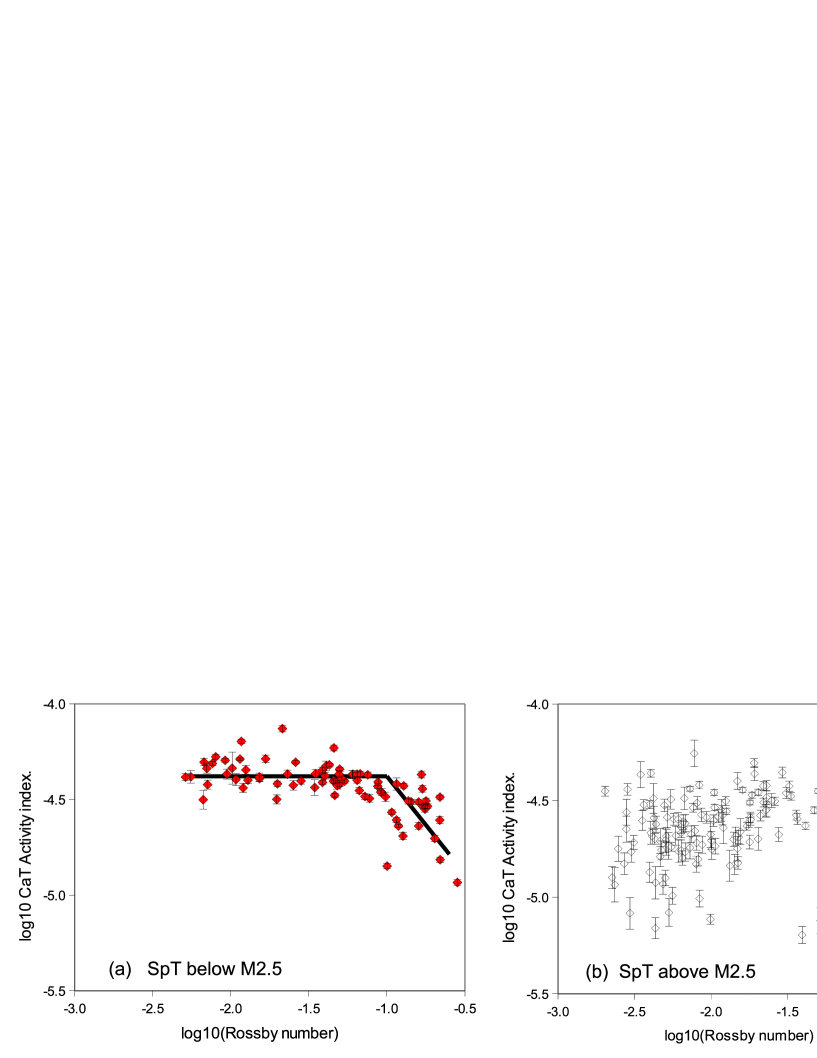
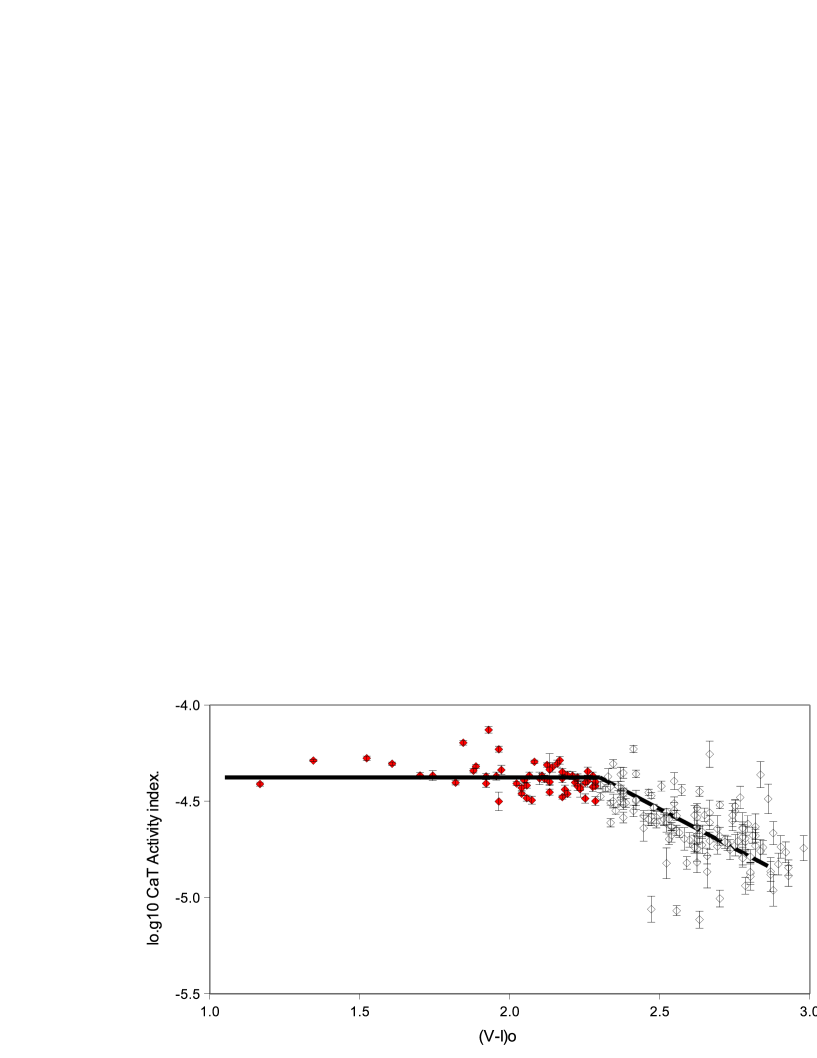
Figure 9 separately shows the behaviour of our CaT activity index with Rossby number for stars earlier and later than M2.5. Unsurprisingly, the features we drew attention to in Fig. 8 are still present, because the range in is only 35 to 155 days, which is considerably smaller than the factor of 100 range in rotation periods. The stars of earlier spectral type show the well-documented rise in activity as decreases (e.g. Pizzolato et al. 2003; Kiraga & Stepien 2007), but for the increase flattens off with, if anything, marginal evidence for a small increase in average activity levels at . There is certainly no evidence for “supersaturation” of chromospheric activity levels in a way analogous to that claimed for coronal activity at (Randich et al. 1996; Marsden et al. 2009).
At first glance, the behaviour of the cooler (M2.5) stars in Fig. 9b is similar. Almost all of these stars have and would be considered “saturated” at these Rossby numbers although it should be noted that we have not observed any cool stars with high enough Rossby numbers to define an unsaturated regime. The chromospheric activity indices are reasonably well described with a constant level of , albeit with a considerable and significant scatter. A marginally better fit is achieved with an activity index that increases with increasing Rossby number. However, the average activity level in these stars is significantly lower, by about 0.3 dex, than that seen in the K3–M2.5 subsample with similar . That is, although the cooler stars appear to show ”saturated” levels of chromospheric emission, the level is lower than that for stars hotter than M2.5. The cooler subsample is similar to the hotter subsample in that there is no strong evidence for “supersaturation”, but in the cool stars this lack of evidence extends to (at least according to our calculation of the turnover time).
The above results suggest that Rossby number is also not the sole determining factor for chromospheric activity and that the limiting level of chromospheric activity at low is spectral type dependent. Figure 10 shows the CaT activity index against intrinsic colour, where we have removed stars with , which may be expected to show lower levels of magnetic activity. Figure 10 shows that the upper envelope of the CaT index is clearly colour-dependent. There appears to be a rather clean break in the data at , corresponding to spectral types between M2 and M3 (Kenyon & Hartmann 1995). Cooler than this, whilst there is considerable scatter, the mean activity index falls with increasing colour in a statistically significant way, reducing by almost a factor of three (0.5 dex) for the coolest stars in our sample with spectral types M4. Recall that although this decline could be mitigated by dex if the basal photospheric scaling factor in Fig. 5 were flat, it cannot be removed.
7.2 X-ray activity in NGC 2516
To assist in deciding whether the fall in the limiting level of chromospheric emission with decreasing mass represents a reduction in the efficiency of the magnetic dynamo, or is instead a redistribution of the activity-related radiative losses to other wavelengths, we examined the coronal activity of low-mass stars in NGC 2516.
Table 1A of Pillitteri et al. (2006) gives the co-ordinates of X-ray sources in NGC 2516. These are shown in Fig. 1 along with our target stars. Unfortunately there is relatively little overlap. Matching co-ordinates within a radius of 10 arcsec showed 10 of our NGC 2516 members to be optical counterparts of identified X-ray sources. A further 21 members were targets for which Pillitteri et al. give upper limits to their X-ray activity. However, we have no reason to believe that M-dwarfs towards the centre of NGC 2516 should have a different rotation period distribution to those in the outskirts studied by Irwin et al. (2007). It therefore seems likely that most of the M-dwarfs detected by Pillitteri et al. (2006) will be in the ”saturated” regime with low Rossby numbers.
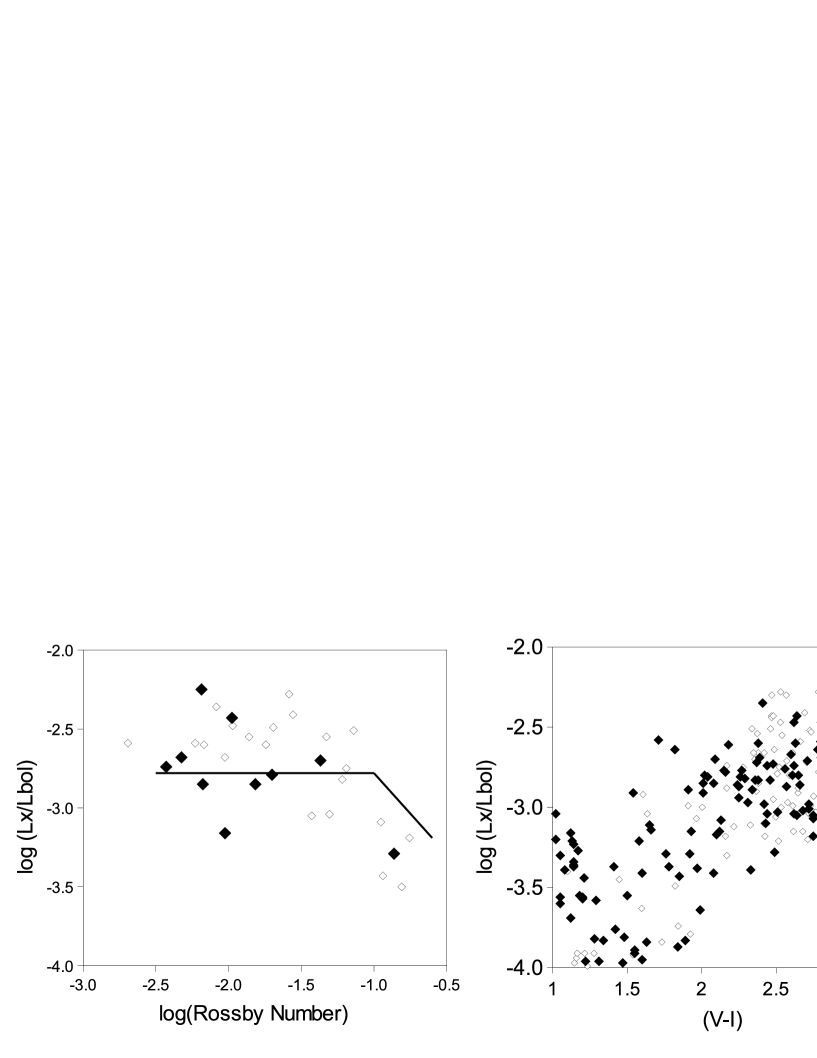
Figure 11a show as a function of Rossby number for those stars with known periods. Also represented schematically is the trend seen in the CaT activity index for K3-M2.5 stars, offset vertically to match the apparent X-ray saturation level. Two results lie 0.7 dex above the others possibly due to X-ray flaring. The remaining results are too sparse to show whether increases or decreases at very small Rossby numbers. However there is evidence of saturation for and there are two objects with the colours and Rossby numbers of saturated M4 dwarfs but which do not show any evidence for the decreased levels of magnetic activity indicated by their CaT indices.
Figure 11b shows versus colour for the whole Pillitteri et al. (2006) sample, including upper limits for photometric candidates without X-ray detections, some of which may not be cluster members. The overall picture suggests that the upper envelope of X-ray emission does not decrease with colour for as is seen for the CaT indices (see Fig. 10) and if anything may increase. We must temper this conclusion by remarking that the number of upper limits among the data make it impossible to say what the spread in X-ray activity is at these colours, so that the average X-ray activity may yet decrease when more sensitive X-ray observations are available. Nevertheless, that the upper envelope of saturated X-ray activity does not decrease with decreasing mass, at least as far as spectral types M5–M6, is reinforced by similar measurements in other open clusters (Jeffries et al. in preparation) and also from volume limited samples of field M-dwarfs (Delfosse et al. 1998; Reiners 2008)
8 Discussion
In section 5.1 we identified 210 low-mass members of NGC 2516 with published periods and spectral types between K3 and M4 (, see Table 2). These stars have a very high probability of membership, being identified as probable members by Irwin et al. (2007) on the basis of their photometry and now also having RVs which are narrowly distributed arond the mean cluster RV. The estimated intrinsic velocity dispersion is only km s-1 and it seems likely that we are dealing with a low-mass population that has a homogeneous age and chemical composition.
The three main results of this study are
-
1.
Low mass stars with spectral type earlier than M2.5 show chromospheric activity, as measured by their CaT activity indices, that increases with decreasing Rossby number, reaching a saturated plateau for . The saturated level is roughly independent of spectral type between mid-K and M2.5.
-
2.
Almost all the stars in our sample with spectral type cooler than M2.5 rotate fast enough to have . However, the average CaT activity indices show a decline towards cooler spectral types of a factor of 2–3 between spectral types M2.5 and M4.
-
3.
For stars of all spectral type we see no evidence of chromospheric supersaturation. That is, there is no evidence that the CaT activity indices fall for the fastest rotators, even for where coronal supersaturation has been claimed for G–K stars.
8.1 Saturation of chromospheric activity at low Rossby numbers
The first of these results is not surprising. Pizzolato et al. (2003) found that if convective turnover times and Rossby numbers were calculated according to the simple approximation we have used, then all stars of spectral types F–K (and a few M-dwarfs) displayed coronal magnetic activity that behaves in a similar way to the chromospheric activity we have observed. This includes a saturated level of activity for . The similarity of the threshold Rossby number for the saturation of coronal and chromospheric emission, when convective turnover times are calculated consistently, suggests that the two phenomena are driven by similar physical mechanisms.
8.2 The dependence of chromospheric activity on spectral type
The second result is also not new in a qualitative sense. Mohanty & Basri (2003) and West et al. (2004, 2008) have also found that the peak levels of chromospheric activity in large samples of M-dwarf field stars, as indicated by , tend to fall as one moves to cooler objects. Where exactly the decline begins is extremely difficult to ascertain using current field star samples. Rapid rotation is rare among field M-dwarfs earlier than spectral type M3, so most reside in the unsaturated part of the activity-Rossby number relationship. At later spectral types, field M-dwarfs are faster rotators on average and many do show ”saturated” levels of activity which clearly falls by about a factor of three between spectral types of M4 and M7 (the envelope of falls from to , see Fig. 7 in Mohanty & Basri 2003). A fall in the limiting level of chromospheric activity that begun at M2.5 or M3 might be disguised in field star samples because of the low number stars with at earlier spectral types.
Limiting levels of chromospheric activity can be found in the early-type M-dwarfs of young open clusters (as we have found here of course). Comparable measurements of are given for rapidly rotating early M-dwarfs in the Pleiades (Terndrup et al. 2000). Converting their H EWs into , we find that these fast rotating M-dwarfs exhibit a flat upper activity envelope between spectral types M0 and M3, but as there are only a handful of measurements for stars with , we cannot tell if the saturated level declines in cooler stars.
A further problem with H measurements is deciding what portion of the H flux is chromospheric. The CaT lines are well-behaved in the sense that chromospheric activity monotonically fills in the photospheric absorption profile. The behaviour of the H line is much more uncertain. The investigations above simply take the chromospheric component of H to be the emission flux above a pseudo-continuum, but it is quite likely that chromospherically inactive stars exhibit at least some H absorption (Cram & Mullan 1985). For instance, Walkowicz & Hawley (2009) show that in M3 dwarfs, a modest amount of activity results in deeper H absorption (with an EW of Å), prior to becoming an emission line at high activity levels. This absorption will become less significant for cooler stars where the saturated chromospheric H lines have much larger emission EWs, but could significantly increase the deduced chromospheric activity of earlier M-dwarfs where the most active have emission EWs of Å. A careful account of this effect may lead to the conclusion that also begins to decline at M2.5. Alternatively, a difference in behaviour could be telling us that these features are formed in two or more chromospheric components in ratios that vary with spectral type (e.g. Houdebeine 2009).
Uniquely then, the sample in this paper, with its large size, spectral type range and preponderance of fast rotators, is well placed to to refine our picture of the behaviour of chromospheric activity in the most active M-dwarfs. It seems that the peak levels of chromospheric activity (as measured by our CaT index) do begin to decline at spectral type M2.5. There is however no evidence that coronal X-ray emission behaves in the same way. The upper envelope of in NGC 2516 rises slightly with increasing colour in the same range where the CaT emission declines. Of course the upper limits that are still present in the X-ray data for mean that average levels of X-ray emission for stars rotating fast enough to be saturated could yet show a decline. However, this would also require that the scatter in the X-ray activity levels would have to be several times larger than the scatter seen in the chromospheric activity. Many of the M3–M4 objects would need to have activity levels of only . Perhaps this might be possible if X-ray activity among the most rapid rotators shows “supersaturation” (see below), but a recent deep X-ray observation of fast rotating M-dwarfs in NGC 2547 shows that they do not and that the average level of X-ray activity in such objects is flat or slightly rising to at least (Jeffries et al. in preparation).
8.3 No evidence for chromospheric supersaturation
Supersaturation is a phenomenon that has only been persuasively demonstrated in the coronal emission from G- and K-dwarfs (Prosser et al. 1996; Stauffer et al. 1997). Specifically, James et al. (2000) searched for evidence of the effect in field and cluster M-dwarfs but were unable to detect more than one or two examples showing any significant reduction in X-ray activity levels at very low Rossby numbers, partly through a lack of ultra-fast rotating M-dwarfs. Here we have many M-dwarfs with , which is comfortably below the threshold that coronal supersaturation sets in for G- and K-dwarfs. If the chromospheric activity of M-dwarfs with was reduced by a factor of two with respect to M-dwarfs with , which is the size of the effect claimed for coronal supersaturation in G- and K-dwarfs, then it would clearly be seen in our data.
One uncertainty in this work is the lack of theoretical predictions for turnover times for stars with . However, even if we were to cap our turnover times at a maximum value of 70 days, as predicted for stars of 0.5 , this would only increase Rossby numbers for the coolest stars in our sample by a maximum of 0.3 dex and many stars would still have . As an aside, larger Rossby numbers would also underpredict the X-ray activity of slowly rotating field M-dwarfs (Kiraga & Stepien 2007).
The lack of chromospheric supersaturation in M-dwarfs concurs with a similar observation for fast-rotating G- and K-type dwarfs in the IC 2391 and IC 2602 clusters (Marsden et al. 2009). The difference in that work, is that the fast-rotating G- and K-stars of IC 2391 and IC 2602 did show evidence for coronal supersaturation.
8.4 Interpretation and speculation
A 150 Myr isochrone from the Siess et al. (2000) evolutionary models places the transition to a fully convective star at a mass, M and temperatures of 3590K. The models of Baraffe et al. (2002) give a similar mass for the transition and a temperature of 3480K. Using the colour/temperature relations of Kenyon & Hartmann (1995) this puts the transition at , at about spectral type M2.5. The decline we have observed in the limiting levels of chromopsheric emission also begins at spectral type M2.5 and this also coincides with the increase in rotation rates seen in our own sample and in samples of field M-dwarfs.
Whether the fall in chromospheric emission and increase in rotation rates are directly linked to the transition to a fully convective core is uncertain. Firstly, the decline in CaT activity index does not start at precise point, rather there is a change from a constant saturated level to a declining level between and . Secondly, the magnetic fields in active stars may reduce . Mullan & MacDonald (2001) showed that including an internal magnetic field in evolutionary models could reduce the effective temperature and luminosity of active stars and would, if the internal magnetic field were strong enough, reduce to as low as 0.1 . In the case of our sample of M-dwarfs in NGC 2516 we already know that they have increased radii and reduced effective temperatures at a given luminosity when compared to standard (non-magnetic) evolutionary models (see Jackson et al. 2009). This could be due to the effects proposed by Mullan & Macdonald (2001) or perhaps more likely due to extensive coverage by cool magnetic starspots (eg. Chabrier et al. 2007). Hence, the changes seen in the chromospheric activity (and the rotation rates in field stars) as a function of spectral type might be due to an increasing convective fraction rather than a transition to full convection.
If we proceed on the basis that the decline in the limiting levels of chromospheric emission and the increase in rotation rates occur around the same spectral type as the transition to a fully or near-fully convective core, and that this is more than a chance coincidence, we can ask why chromospheric activity declines for fully convective stars? The evidence from the coronal activity in NGC 2516 is that it is not necessarily due to a decline in the efficiency of the dynamo that produces the magnetic flux responsible for non-radiative heating in the outer atmosphere. This is supported by measurements of total magnetic flux, which show kilogauss field covering large fractions of the stellar surface in active field M-dwarfs at masses both above and below the fully convective transition (Reiners 2008). The fact that our targets were all detected due to photometric modulation by magnetic starpsots also shows that strong magnetic activity of a qualitatively similar nature continues in fully convective stars.
Instead, it seems more likely that it is the magnetic topology that changes as the magnetic dynamo shifts from operating predominantly at the interface between the convection zone and radiative core, to a distributed dynamo operating throughout a fully convective star (e.g. Chabrier and Küker 2006; Browning 2008). Donati et al. (2008) and Morin et al. (2008) have shown, using Zeeman doppler imaging, that M-dwarfs with radiative cores have modest large-scale fields with predominantly toroidal and non-axisymmetric poloidal fields, whereas fully convective M-dwarfs have stronger large-scale fields that are almost fully poloidal and axisymmetric. Reiners & Basri (2009) point out that most of the magnetic energy is still in small-scale fields that are unresolved by Zeeman doppler imaging for both groups of stars, but there is a clear shift towards larger-scale ordered fields in the fully convective stars.
The transition from an interface to a turbulent convective boundary means that the chromospheric emission may trace altogether different structures in each regime. One could speculate that the loss of some magnetic flux on small scales also results in the loss of regions responsible for bright chromospheric emission, whilst at the same time having little effect on the coronal volume and density.
9 Conclusions
We have measured rotation rates and RVs, which confirm 210 late-K to mid-M dwarfs as members of the open cluster NGC 2516. These were previously identified as photometric members by Irwin et al. (2007) and have measured rotation periods. The RVs of cluster members are tightly bunched about the mean showing an intrinsic dispersion of km s-1. The projected equatorial velocities show an increase in the proportion of fast rotators for later spectral types, such that 90 per cent of M4 stars have km s-1. Fewer stars are rapid rotators at earlier spectral types, but still a much greater proportion than are found in a field star sample, which is expected because the cluster is younger than the probable spindown timescales for all M-dwarfs.
We have gauged chromospheric activity using intermediate resolution spectroscopy of the first two of the near infrared calcium triplet lines (8498Å and 8542Å) and a spectral subtraction technique to remove the photospheric contribution. The chromospheric activity of stars that are hotter or cooler than spectral type M2.5 () show a differing dependence on rotation period and colour/mass. Our main findings are: (i) Stars with spectral type earlier than M2.5 behave like other samples of young G- and K-type stars. Their chromospheric activity increases with decreasing period, or decreasing Rossby number, and reaches a saturated plateau for Rossby numbers smaller than about 0.1. (ii) Cooler stars almost all rotate fast enough that they have Rossby numbers less than 0.1. For these stars we find almost no dependence on rotation period or Rossby number, but a rather steep decline in chromospheric activity with colour, amounting to factors of 2–3 between spectral types M2.5 and M4 (). (iii) There is no evidence in our data for any systematic fall in activity at very low Rossby numbers (), a phenomenon that has been seen in the coronal emission from fast-rotating G- and K-stars and dubbed “supersaturation”.
It is tempting to identify changes in the properties of chromospheric activity with the disappearance of the radiative core of a star at and presumably the emergence of a new, distributed or turbulent dynamo that operates in fully convective M-dwarfs. We do not see any corresponding decline in peak levels of X-ray emission across the fully convective boundary in NGC 2516 and none has been reported in field stars. This, combined with literature suggesting that magnetic flux continues to be generated strongly in fully convective stars leads us to favour a changing magnetic topology as the cause of both the decline in chromospheric emission and the rapid increase in angular momentum loss timescales as stars approach or cross the fully convective boundary.
Acknowledgments
Based on observations collected at the European Southern Observatory,Paranal, Chile through observing programs 380.D-0479 and 266.D-5655. RJJ acknowledges receipt of an STFC studentship.
References
- Allen (1973) Allen C. W., 1973, Astrophysical quantities 3rd ed.. University of London, Athlone Press, London
- Bagnulo et al. (2003) Bagnulo S., Jehin E., Ledoux C., Cabanac R., Melo C., Gilmozzi R., The ESO Paranal Science Operations Team 2003, The Messenger, 114, 10
- Baliunas et al. (1995) Baliunas S. L., Donahue R. A., Soon W. H., Horne J. H., Frazer J., Woodard-Eklund L., Bradford M., Rao L. M., Wilson O. C., Zhang Q., Bennett W., Briggs J., Carroll S. M., Duncan D. K., 1995, ApJ, 438, 269
- Baraffe et al. (2002) Baraffe I., Chabrier G., Allard F., Hauschildt P. H., 2002, A&A, 382, 563
- Bessell & Weis (1987) Bessell M. S., Weis E. W., 1987, Publ. astr. Soc. Pacif. , 99, 642
- Browning (2008) Browning M. K., 2008, ApJ, 676, 1262
- Browning et al. (2010) Browning M. K., Basri G., Marcy G. W., West A. A., Zhang J., 2010, Astron. J. , 139, 504
- Busà et al. (2007) Busà I., Aznar Cuadrado R., Terranegra L., Andretta V., Gomez M. T., 2007, A&A, 466, 1089
- Carpenter (2001) Carpenter J. M., 2001, AJ, 121, 2851
- Cenarro et al. (2001) Cenarro A. J., Cardiel N., Gorgas J., Peletier R. F., Vazdekis A., Prada F., 2001, MNRAS, 326, 959
- Cenarro et al. (2002) Cenarro A. J., Gorgas J., Cardiel N., Vazdekis A., Peletier R. F., 2002, MNRAS, 329, 863
- Chabrier et al. (2007) Chabrier G., Gallardo J., Baraffe I., 2007, A&A, 472, L17
- Chabrier & Küker (2006) Chabrier G., Küker M., 2006, A&A, 446, 1027
- Claret et al. (1995) Claret A., Diaz-Cordoves J., Gimenez A., 1995, A&AS, 114, 247
- Cox (1955) Cox A. N., 1955, ApJ, 121, 628
- Cram & Mullan (1985) Cram L. E., Mullan D. J., 1985, ApJ, 294, 626
- Cutri, R. M. et al. (2003) Cutri, R. M. et al. 2003, Technical report, Explanatory supplement to the 2MASS All Sky data release. http://www.ipac.caltech.edu/2mass/
- Damiani et al. (2003) Damiani F., Flaccomio E., Micela G., Sciortino S., Harnden Jr. F. R., Murray S. S., Wolk S. J., Jeffries R. D., 2003, ApJ, 588, 1009
- D’Antona et al. (2000) D’Antona F., Ventura P., Mazzitelli I., 2000, ApJ, 543, L77
- Delfosse et al. (1998) Delfosse X., Forveille T., Perrier C., Mayor M., 1998, A&A, 331, 581
- Donati et al. (2008) Donati J., Morin J., Petit P., Delfosse X., Forveille T., Aurière M., Cabanac R., Dintrans B., Fares R., Gastine T., Jardine M. M., Lignières F., Paletou F., Velez J. C. R., Théado S., 2008, MNRAS, 390, 545
- Gilliland (1986) Gilliland R. L., 1986, ApJ, 300, 339
- González & Lapasset (2000) González J. F., Lapasset E., 2000, Astron. J. , 119, 2296
- Hawley et al. (1999) Hawley S. L., Tourtellot J. G., Reid I. N., 1999, Astron. J. , 117, 1341
- Horne (1986) Horne K., 1986, Publ. astr. Soc. Pacif. , 98, 609
- Houdebine (2009) Houdebine E. R., 2009, MNRAS, 397, 2133
- Irwin et al. (2007) Irwin J., Hodgkin S., Aigrain S., Hebb L., Bouvier J., Clarke C., Moraux E., Bramich D. M., 2007, MNRAS, 377, 741
- Jackson et al. (2009) Jackson R. J., Jeffries R. D., Maxted P. F. L., 2009, MNRAS, 399, L89
- James et al. (2000) James D. J., Jardine M. M., Jeffries R. D., Randich S., Collier Cameron A., Ferreira M., 2000, MNRAS, 318, 1217
- James & Jeffries (1997) James D. J., Jeffries R. D., 1997, MNRAS, 292, 252
- Jeffries (2007) Jeffries R. D., 2007, MNRAS, 381, 1169
- Jeffries et al. (1998) Jeffries R. D., James D. J., Thurston M. R., 1998, MNRAS, 300, 550
- Jeffries et al. (2001) Jeffries R. D., Thurston M. R., Hambly N. C., 2001, A&A, 375, 863
- Jeffries et al. (1997) Jeffries R. D., Thurston M. R., Pye J. P., 1997, MNRAS, 287, 350
- Jenkins et al. (2009) Jenkins J. S., Ramsey L. W., Jones H. R. A., Pavlenko Y., Gallardo J., Barnes J. R., Pinfield D. J., 2009, ApJ, 704, 975
- Kenyon & Hartmann (1995) Kenyon S. J., Hartmann L., 1995, Astrophys. J. Suppl. , 101, 117
- Kim & Demarque (1996) Kim Y., Demarque P., 1996, ApJ, 457, 340
- Kiraga & Stepien (2007) Kiraga M., Stepien K., 2007, Acta Astronomica, 57, 149
- López-Morales (2007) López-Morales M., 2007, ApJ, 660, 732
- Lyra et al. (2006) Lyra W., Moitinho A., van der Bliek N. S., Alves J., 2006, A&A, 453, 101
- Mallik (1994) Mallik S. V., 1994, A&AS, 103, 279
- Mallik (1997) Mallik S. V., 1997, A&AS, 124, 359
- Mangeney & Praderie (1984) Mangeney A., Praderie F., 1984, A&A, 130, 143
- Marsden et al. (2009) Marsden S. C., Carter B. D., Donati J., 2009, MNRAS, 399, 888
- Mohanty & Basri (2003) Mohanty S., Basri G., 2003, ApJ, 583, 451
- Montes & Martin (1998) Montes D., Martin E. L., 1998, A&AS, 128, 485
- Morales, J. C. et al. (2009) Morales, J. C. et al. 2009, ApJ, 691, 1400
- Moraux et al. (2005) Moraux E., Bouvier J., Clarke C., 2005, Astron. Nachr., 326, 985
- Morin et al. (2008) Morin J., Donati J., Petit P., Delfosse X., Forveille T., Albert L., Aurière M., Cabanac R., Dintrans B., Fares R., Gastine T., Jardine M. M., Lignières F., Paletou F., Ramirez Velez J. C., Théado S., 2008, MNRAS, 390, 567
- Mullan & MacDonald (2001) Mullan D. J., MacDonald J., 2001, ApJ, 559, 353
- Noyes et al. (1984) Noyes R. W., Weiss N. O., Vaughan A. H., 1984, ApJ, 287, 769
- Pillitteri et al. (2006) Pillitteri I., Micela G., Damiani F., Sciortino S., 2006, A&A, 450, 993
- Pizzolato et al. (2003) Pizzolato N., Maggio A., Micela G., Sciortino S., Ventura P., 2003, A&A, 397, 147
- Prosser et al. (1996) Prosser C. F., Randich S., Stauffer J. R., Schmitt J. H. M. M., Simon T., 1996, Astron. J. , 112, 1570
- Queloz et al. (1998) Queloz D., Allain S., Mermilliod J.-C., Bouvier J., Mayor M., 1998, A& A, 335, 183
- Randich et al. (1996) Randich S., Schmitt J. H. M. M., Prosser C. F., Stauffer J. R., 1996, A&A, 305, 785
- Reiners (2008) Reiners A., 2008, in S. Röser ed., Reviews in Modern Astronomy Vol. 20 of Reviews in Modern Astronomy. p. 40
- Reiners & Basri (2008) Reiners A., Basri G., 2008, ApJ, 684, 1390
- Reiners & Basri (2009) Reiners A., Basri G., 2009, A&A, 496, 787
- Reiners & Basri (2010) Reiners A., Basri G., 2010, ApJ, 710, 924
- Reiners et al. (2009) Reiners A., Basri G., Browning M., 2009, ApJ, 692, 538
- Ribas et al. (2008) Ribas I., Morales J. C., Jordi C., Baraffe I., Chabrier G., Gallardo J., 2008, Memorie della Societa Astronomica Italiana, 79, 562
- Rieke & Lebofsky (1985) Rieke G. H., Lebofsky M. J., 1985, ApJ, 288, 618
- Schiavon et al. (1997) Schiavon R. P., Barbuy B., Rossi S. C. F., Milone A., 1997, ApJ, 479, 902
- Siess et al. (2000) Siess L., Dufour E., Forestini M., 2000, A&A, 358, 593
- Soderblom et al. (1993) Soderblom D. R., Stauffer J. R., Hudon J. D., Jones B. F., 1993, ApJs, 85, 315
- Stauffer et al. (1994) Stauffer J. R., Caillault J., Gagne M., Prosser C. F., Hartmann L. W., 1994, Astrophys. J. Suppl. , 91, 625
- Sung et al. (2002) Sung H., Bessell M. S., Lee B.-W., Lee S.-G., 2002, Astron. J. , 123, 290
- Terndrup et al. (2002) Terndrup D. M., Pinsonneault M., Jeffries R. D., Ford A., Stauffer J. R., Sills A., 2002, ApJ, 576, 950
- Terndrup et al. (2000) Terndrup D. M., Stauffer J. R., Pinsonneault M. H., Sills A., Yuan Y., Jones B. F., Fischer D., Krishnamurthi A., 2000, Astron. J. , 119, 1303
- van Leeuwen (2009) van Leeuwen F., 2009, A&A, 497, 209
- Ventura et al. (1998) Ventura P., Zeppieri A., Mazzitelli I., D’Antona F., 1998, A&A, 334, 953
- Walkowicz & Hawley (2009) Walkowicz L. M., Hawley S. L., 2009, Astron. J. , 137, 3297
- West et al. (2008) West A. A., Hawley S. L., Bochanski J. J., Covey K. R., Reid I. N., Dhital S., Hilton E. J., Masuda M., 2008, Astron. J. , 135, 785
- West et al. (2004) West A. A., Hawley S. L., Walkowicz L. M., Covey K. R., Silvestri N. M., Raymond S. N., Harris H. C., Munn J. A., McGehee P. M., Ivezić Ž., Brinkmann J., 2004, Astron. J. , 128, 426