Sub-arcsecond radio continuum mapping in and around the spiral galaxy NGC 3351 using MERLIN
Abstract
We report sub-arcsecond scale radio continuum observations of a field of 35 by 22 arcmin centred in NGC 3351 obtained with the Multi-Element Radio Linked Interferometer Network (MERLIN). We found 23 radio sources in this field, 6 of which are projected within the D25 isophote of the galaxy, and 3 are located inside the central 100 arcsec in radius. Two of these three are significantly extended, while the third one is relatively compact. This one is the only source with a previously detected counterpart at other wavelengths and could constitute the radio counterpart of a young supernova remnant. The other two are probably related to jets from a background AGN. We are not able to detect individual supernovae or SNRs in the central region ( pc) of the galaxy. This could imply that the ionising populations of the circumnuclear star-forming regions (CNSFRs) are too young (less than a few Myr) to host supernovae. Also the diffusion length of the relativistic electrons in the ISM associated with the SN from previous events of star formation seems to be larger than our maximum resolution of 50 pc in radius. Detecting the thermal bremsstrahlung emission from the circumnuclear Hii regions probably requires deeper observations.
keywords:
Galaxies: individual: NGC 3351 – radio continuum: galaxies – galaxies: starburst.1 Introduction
The radio emission of a normal spiral galaxy consists of a thermal bremsstrahlung component, arising from inelastic Coulomb collisions between the free electrons and ions of the interstellar medium (ISM), and a synchrotron component emitted by relativistic cosmic-ray electrons from supernova remnants (SNRs) and active galactic nuclei (AGN) spiralling in the galactic magnetic field (see e.g. Condon, 1992). Star-forming regions may host a large number of supernovae, and the Hii regions created by young massive stars can be detected as thermal sources (e.g. Kobulnicky & Johnson, 1999; Turner et al., 2000; Johnson et al., 2001; Johnson et al., 2003, 2009; Cannon & Skillman, 2004; Tsai et al., 2006, 2009; Rosa-González et al., 2007). In particular, the inner ( kpc) parts of some spiral galaxies show higher star formation rates (SFRs) than usual, frequently arranged in a ring pattern around the nucleus. Circumnuclear star-forming regions (CNSFRs), also referred to as “hot-spots” (Sérsic & Pastoriza, 1965, 1967), are similar to luminous and large disk Hii regions, but they are more compact and show higher peak surface brightness (Kennicutt et al., 1989). Their massive stars can dominate the observed ultraviolet (UV) emission even in the presence of AGN (González Delgado et al., 1998; Colina et al., 2002), and the ionised gas can contribute up to 50 per cent to the total H luminosity in some Seyfert 2 nuclei (Cid Fernandes et al., 2001). The luminosities, typically higher than erg s-1, overlap with those of Hii galaxies (see e.g. Melnick et al., 1988; Díaz et al., 2000; Hoyos & Díaz, 2006, and references therein). Due to their location near the centre of the galaxy, CNSFRs display high metal abundance (see e.g. Díaz et al., 2007, and references therein), which makes them ideal laboratories to investigate star formation in environments of large metallicity.
NGC 3351, also known as M95 and UGC5850, is a nearby (10.05 Mpc, 49 pc/arcsec, Graham et al., 1997) SBb(r)II early-type barred spiral galaxy (Sandage & Tammann, 1987) in the Leo group. Its coordinates are , , and its major- and minor-axis diameters at the 25 magnitude isophote (D25) are arcmin, with a position angle (PA) of 13∘ (RC3 catalogue, de Vaucouleurs et al., 1991). NGC 3351 has a star-forming circumnuclear ring, and has been classified as a “hot-spot” galaxy by Sérsic & Pastoriza (1967). Early detailed studies of its nuclear regions by Alloin & Nieto (1982) showed that NGC 3351 harbours high-mass star formation along a ring of about 20 arcsec in diameter in its central zone. In fact, it can be considered a nuclear starburst galaxy, since the SFR per unit area is significantly higher in the nuclear region than in the disc (Devereux et al., 1992). HST UV images show that the present star formation in the ring of NGC 3351 is arranged in complexes of diameters between 1.4 and 2.0 arcsec, made up of several high-surface brightness knots a few parsec in size embedded in a more diffuse component (Colina et al., 1997). A circumnuclear SFR of 0.38 M⊙ yr-1 was inferred by Elmegreen et al. (1997) from near infrared (IR) photometry in the J and K bands, and a value of 0.24 M⊙ yr-1 was derived by Planesas et al. (1997) from the H emission. From CO observations, these authors estimated a mass of molecular gas of 3.5 108 M⊙ inside a circle of 1.4 kpc in diameter. According to Jogee et al. (2005), NGC 3351 hosts 5.3 108 of molecular hydrogen, with most of the emission coming from the inner pc. Within this radius, a SFR of 0.5 M⊙ yr-1 can be estimated from the Br luminosity given by Puxley et al. (1990), whereas the non-thermal component of the radio continuum emission favours a lower value of 0.3 M⊙ yr-1 (Jogee et al., 2005). van de Ven & Chang (2009) estimated that the molecular mass inside the circumnuclear ring is about 5 107, and Leroy et al. (2009) found a well-defined molecular ring with a diameter of about 50 arcsec, located at the end of the stellar bar (with a semimajor axis of 47 arcsec; see e.g. Martin, 1995). These CO structures are compatible with the excesses observed by Regan et al. (2001) and Helfer et al. (2003). A small CO bar perpendicular to the large-scale stellar bar was also observed by Devereux et al. (1992) and Helfer et al. (2003).
NGC 3351 is part of the SINGS Legacy Science Program sample (Kennicutt et al., 2003), and it has been included in a wide variety of statistical studies. The SINGS data set provides broadband imaging, as well as low- and high-resolution spectral maps in the IR. The integrated spectral energy distribution (SED) of NGC 3351 from 0.15 to 850 m has been derived by Dale et al. (2007) by combining the Spitzer data with those from 2MASS and IRAS in the IR, GALEX in the UV, and other data in the optical, modelling the dust and stellar contributions. They concluded that most of the sample’s spectral variations stem from two underlying components, one representative of a galaxy with a low IR-to-UV ratio and one representative of a galaxy with a high IR-to-UV ratio, as given by a principal component analysis of the sample. Draine et al. (2007) used the IRAC and MIPS observations to estimate the total dust mass (107.46 ) and the fraction of the dust mass contributed by PAHs (3.2 per cent). They found that the dust properties of spiral galaxies resemble those in the local environment of the Milky Way, with similar dust-to-gas ratio and similar PAH abundance. Muñoz-Mateos et al. (2009) found that NGC 3351 shows significantly larger IR concentration indices than the remaining galaxies of the same morphological type of the SINGS sample.
We have studied the circumnuclear region of NGC 3351 in two previous works. In Díaz et al. (2007), the physical conditions of the gas were determined for 7 CNSFRs. We developed a semi-empirical method for the derivation of chemical abundances in the high-metallicity regime, obtaining values consistent with solar within the errors and comparable to those found in high-metallicity disc Hii regions using direct measurements of electron temperatures. An analysis of the kinematics of the gas and stars in 5 CNSFRs and the nucleus of NGC 3351 is presented in Hägele et al. (2007). We derived the dynamical masses (between and M⊙) for the stellar clusters in these regions, and found that the CNSFR complexes, with sizes of about 100 to 150 pc in diameter, are seen to be composed of several individual star clusters (with sizes between 1.7 and 4.9 pc on a HST image). The radial velocity curve shows deviation from circular motions for the ionised hydrogen, consistent with infall towards the central regions of the galaxy at a velocity of about 25 km s-1 (in agreement with Rubin et al., 1975; Dicaire et al., 2008). These last authors also point out that the H velocity field is fairly regular outside the central bar, and Jogee et al. (2005) found that the velocity field of the molecular material in the inner 500 pc is generally dominated by circular motions, with some evidence of weaker non-circular streaming.
In this paper, we will look for radio-continuum signatures of massive star formation in NGC 3351, both in the nucleus (in particular, the CNSFRs) and the galaxy disk. Section 2 describes the observations and the data reduction. The spatial distribution of radio sources and their observed properties are discussed in Section 3, and Section 4 is devoted to the interpretation of these results in terms of star formation activity. Our main conclusions are briefly summarised in Section 5.
| Source | FIRST | Radius | R.A. | Dec. | Peak | Int. | |||
|---|---|---|---|---|---|---|---|---|---|
| name | (arcmin) | (J2000) | (mas) | (mas) | (mJy b-1) | (mJy) | (mJy b-1) | ||
| 1 | J104252.6+114853 | 17.283 | 10 42 52.5564 | +11 48 54.157 | 47 | 76 | 0.31 | 1.78 | 0.08 |
| 2 | J104253.2+114848 | 17.076 | 10 42 53.3084 | +11 48 48.482 | 27 | 44 | 0.55 | 1.91 | 0.08 |
| 3 | J104254.6+114841 | 16.727 | 10 42 54.6482 | +11 48 41.204 | 24 | 38 | 0.63 | 5.33 | 0.08 |
| 4 | J104301.1+115230 | 17.228 | 10 43 01.1845 | +11 52 30.364 | 27 | 44 | 0.54 | 1.28 | 0.08 |
| 5 | 15.086 | 10 43 12.8952 | +11 52 35.685 | 48 | 78 | 0.31 | 0.73 | 0.08 | |
| 6 | J104320.5+114301 | 9.1344 | 10 43 20.5287 | +11 43 01.933 | 10 | 16 | 1.48 | 5.00 | 0.08 |
| 7 | J104328.4+113723 | 8.6480 | 10 43 28.4280 | +11 37 23.613 | 5 | 10 | 2.43 | 5.53 | 0.08 |
| 8 | 5.2228 | 10 43 36.7801 | +11 43 15.556 | 21 | 34 | 0.72 | 1.65 | 0.08 | |
| 9 | J104342.7+115209 | 10.575 | 10 43 42.7584 | +11 52 09.373 | 2 | 4 | 4.33 | 11.82 | 0.08 |
| 10 | 2.8629 | 10 43 47.3236 | +11 40 54.775 | 35 | 57 | 0.42 | 0.81 | 0.08 | |
| 11 | J104349.1+113628 | 6.1266 | 10 43 49.1642 | +11 36 28.452 | 3 | 5 | 2.74 | 4.00 | 0.09 |
| 12 | 1.9497 | 10 43 49.8033 | +11 41 58.791 | 43 | 70 | 0.43 | 0.85 | 0.08 | |
| 13 | 2.8251 | 10 43 50.6611 | +11 39 59.677 | 35 | 56 | 0.42 | 0.78 | 0.08 | |
| 14(R1) | J104355.2+114129 | 0.9541 | 10 43 55.2618 | +11 41 29.337 | 2 | 4 | 4.11 | 4.08 | 0.07 |
| 15(R2) | J104359.5+114332 | 1.3864 | 10 43 59.5464 | +11 43 32.638 | 3 | 5 | 3.53 | 22.04 | 0.07 |
| 16(R3) | J104401.4+114323 | 1.4793 | 10 44 01.4482 | +11 43 23.623 | 21 | 18 | 1.38 | 15.93 | 0.06 |
| 17 | 2.9359 | 10 44 08.4135 | +11 40 54.837 | 38 | 58 | 0.39 | 1.09 | 0.08 | |
| 18 | 3.0888 | 10 44 10.3120 | +11 42 08.643 | 35 | 57 | 0.42 | 0.50 | 0.08 | |
| 19 | J104417.4+114614 | 6.2824 | 10 44 17.4533 | +11 46 14.678 | 1 | 1 | 62.77 | 125.40 | 0.21 |
| 20 | 6.6425 | 10 44 17.5254 | +11 46 46.157 | 15 | 24 | 0.96 | 1.79 | 0.09 | |
| 21 | J104423.4+114458 | 6.8677 | 10 44 23.4286 | +11 44 58.340 | 3 | 3 | 14.05 | 32.41 | 0.32 |
| 22 | J104429.2+113811 | 8.7224 | 10 44 29.2655 | +11 38 11.349 | 7 | 6 | 4.05 | 13.05 | 0.14 |
| 23 | J104430.6+113811 | 9.0252 | 10 44 30.6493 | +11 38 11.184 | 1 | 1 | 21.12 | 88.18 | 0.13 |
2 Observations and data reduction
We observed NGC 3351 at 1.42 GHz on 2008 Jan 26-28 using 6 antennas of the Multi-Element Radio Linked Interferometer Network (MERLIN). The Cambridge telescope has a diameter of 32 m and provides the longest baselines of up to 217 km; the other five antennas have effective diameters of 25 meters. The field centre was at right ascension , declination +11°42′14000 (J2000). We used the point-like QSO B1023+131, at a separation of less than °, as the phase reference source, with a duty cycle of about 6.5:1.5 min on the target and phase reference, respectively. The position used for B1023+131 (, +12°53′49024) was taken from Browne et al. (1998). We used a 4 s integration time. After flagging bad data, the total, usable time on NGC 3351 was 15.4 hours, which is expected to give a noise level of Jy beam-1 under good conditions. The point-like QSO OQ208 was used as a bandpass calibration source and to set the flux scale on all baselines. Its flux density was found to be Jy by comparison with 3C286 on the shorter baselines, where the latter is unresolved and has a flux density of 14.73 Jy at 1.42 GHz (Baars et al., 1977).
We followed the standard MERLIN continuum data reduction procedure (MERLIN User Guide, Diamond et al. 2003111http://www.merlin.ac.uk/user_guide/OnlineMUG/), using the aips package222http://www.aips.nrao.edu/ for calibration and imaging. We applied the flux scale, bandpass and time-variable phase and amplitude solutions from the reference sources to NGC 3351 and split out the data. We retained 15 1-MHz channels. This spectral resolution gives the most stringent restriction on the field of view, of about 10 percent smearing at 140 arcsec radius. We used separate facets of a few arcmin in all mappings in order to avoid distortions due to sky curvature and natural weighting, giving a beam size of arcsec with a position angle of 23°. We searched for confusing sources by making a grid of 1681 100-arcsec maps, without cleaning, over a 1-degree square field. We then re-imaged and cleaned all fields containing sources brighter than 2 mJy, using the clean components as a model for self-calibration of the whole dataset. We carried out further rounds of imaging and self-calibration, testing different strategies such as establishing that restricting self-calibration to the inner sources gave poorer results. We established that sidelobes fell to percent of the peak at distances arcmin from a source and identified all sources brighter than 1 mJy within the central 12 arcmin. Fainter sources should not produce sidelobes above the expected in the central region.
3 Results
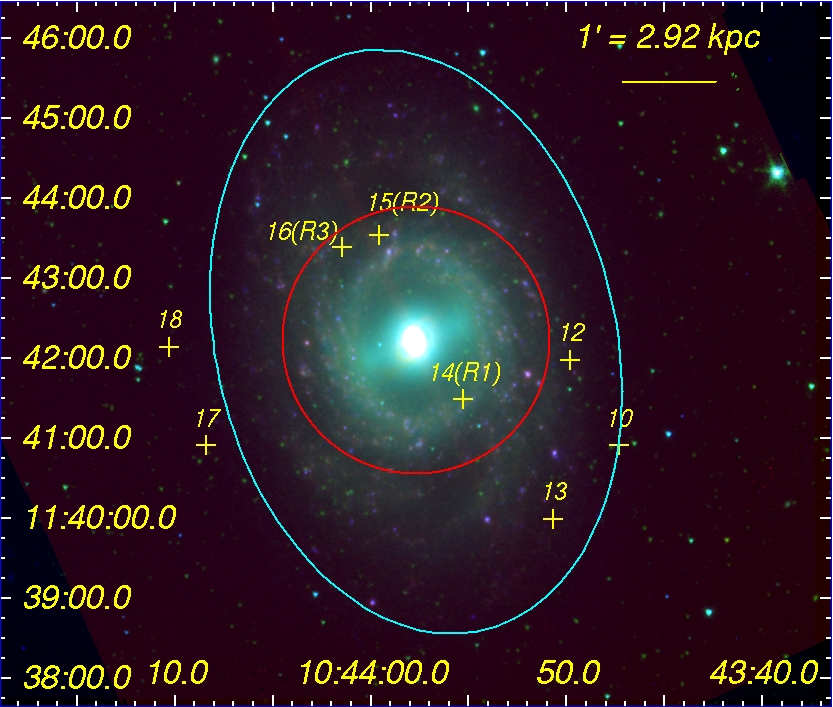
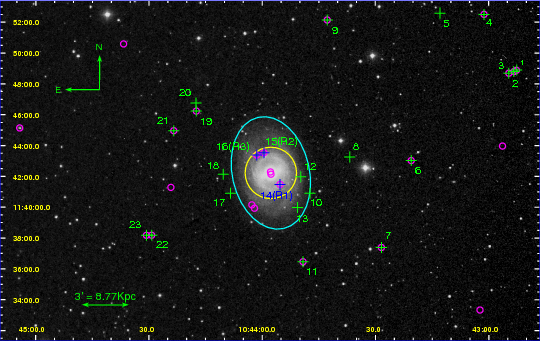
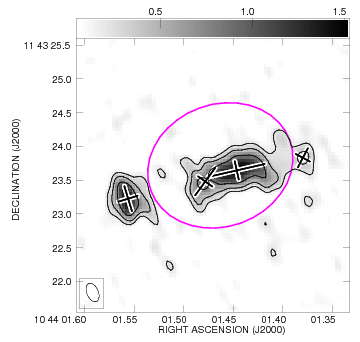
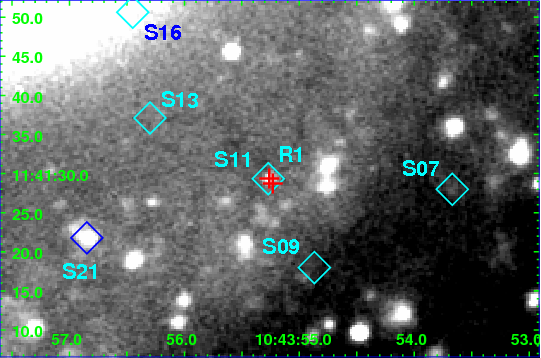
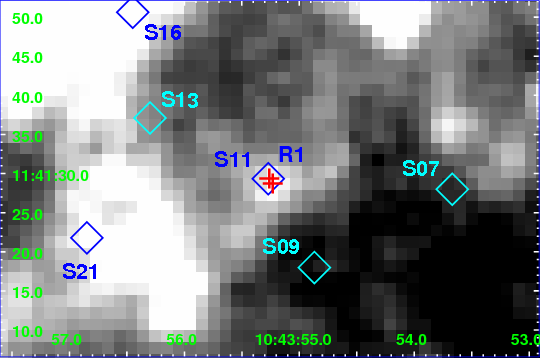
Table 1 gives the properties of the 23 radio-continuum sources at 1.42 GHz found by MERLIN within a arcmin region around NGC 3351. The first column identifies the sources. The three objects that are closest to the centre (14, 15, and 16) will be referred to as R1, R2, and R3 in what follows. Fifteen of the MERLIN sources have a counterpart in the VLA FIRST (Very Large Array, Faint Images of the Radio Sky at Twenty-cm) survey catalogue (White et al., 1997) within 1 arcsec radius; names of the FIRST counterparts are quoted in column 2. Column 3 shows the radial offset from the MERLIN pointing centre, and columns 4 to 7 give the coordinates of each source and their corresponding errors. Peak surface brightness, integrated flux densities, and local noise levels are listed in columns 8, 9, and 10, respectively. The distribution of the MERLIN sources is shown in Fig. 1 overplotted on an H image acquired with the Palomar 48-inch Schmidt telescope and obtained from the Digitized Sky Survey333http://stdatu.stsci.edu/cgi-bin/dss_form (DSS) through the NASA/IPAC Extragalactic Database444http://nedwww.ipac.caltech.edu/ (NED).
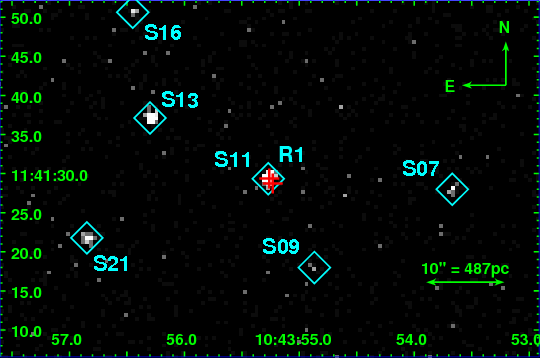
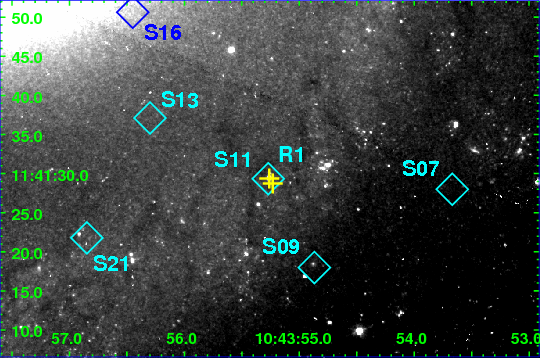
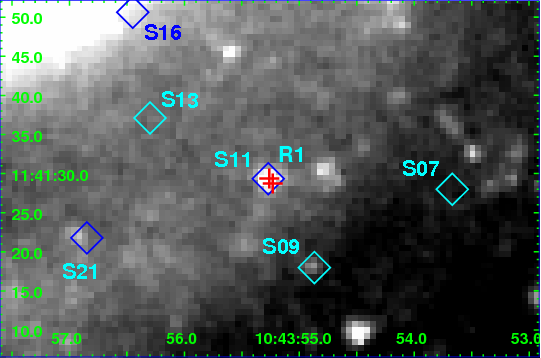
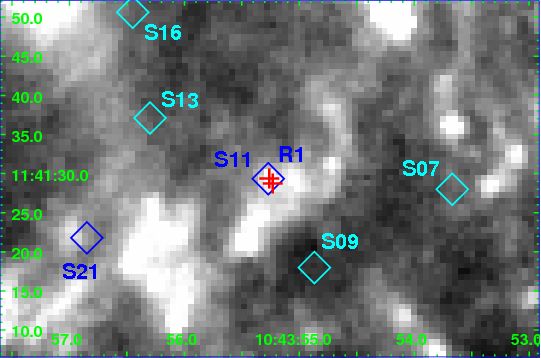
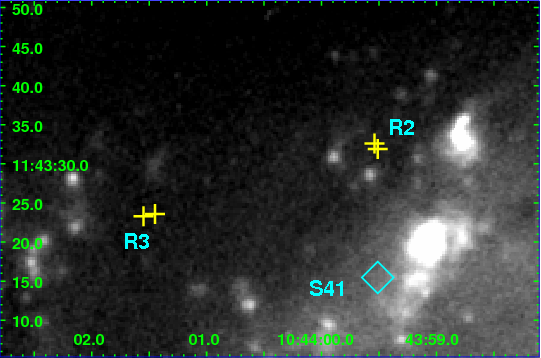
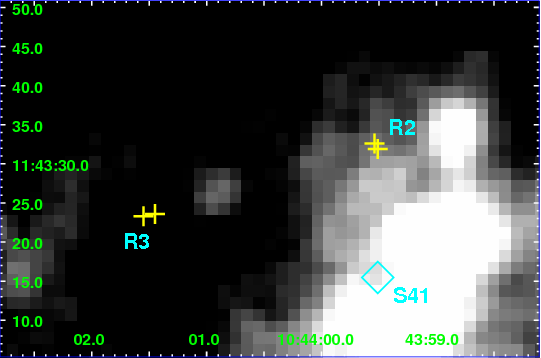
We found six sources inside the D25 isophote whose intensity peaks are brighter than the local 6 confidence limit of Jy beam-1, corresponding to a brightness temperature of 1000 K. Outside this ellipse (D25), the noise increases, reaching about 0.07–0.08 mJy beam-1 in the regions out to 15-20 arcmin radius which are affected by bandwidth and other smearing, making accurate deconvolution difficult. We visually examined each candidate source, rejecting those which seemed spurious. Artefacts did not exceed 6 within the primary beam FWHM, except for clearly-recognisable sidelobes reaching 10 within arcmin of some of the brightest outlying sources In the outer part of the field, we retained fifteen sources exceeding 10 ( mJy beam-1) and two fainter sources (5 and 18) which are conspicuously isolated from any contaminating sidelobes. The distribution of radio sources close to the centre of NGC 3351 is shown with crosses in Figure 2. This false colour image is made using two Spitzer images at 8.0 and 3.6 m (red and green channels, respectively) and a continuum-subtracted H image (blue channel) from CTIO 4.0 m Mosaic2 (correction to the celestial coordinates of this image was provided by Douglas Swartz, private communication).
MERLIN detected 15 (about 63 %) of the 24 sources listed in the FIRST survey catalogue within the field of view shown in Fig. 1. The area of the MERLIN beam is of the FIRST resolution of arcsec, giving a brightness sensitivity for MERLIN K compared with 20-30 K for FIRST. In addition, the shortest MERLIN baselines correspond to a maximum imageable angular scale of arcsec. All the non-detected sources are fainter than 7 mJy per FIRST beam. On the other hand, we have discovered 8 new sources that were not previously catalogued in FIRST, due to our greater sensitivity to compact emission. The position errors quoted in Table 1 are the noise-based relative errors of the source peaks. Astrometric uncertainties also arise from the assumed positions of the phase reference source ( 3 mas) and the MERLIN antennas ( 10 mas), as well as from the phase reference-target separation ( 5 mas), giving a total astrometric uncertainty of about 12 mas. The sources at increasing distances from the centre, over a few arcmin, may suffer from additional errors in the peak position due to smearing.
The best images of the central region were achieved by using all sources identified in a 1-degree region for self-calibration and subtracting the clean components for sources further than 2 arcmin from the centre. After all calibration and subtraction, we made a cleaned image of the region within 100 arcsec of the centre. Using natural weighting gave Jy beam-1. We tried giving the longer baselines lower weight (tapering) and used a restoring beam of arcsec, giving Jy. Although these levels are close to the predicted noise (allowing for the low declination of NGC 3351), even the best images contained ripples of magnitude due to the severe distortions introduced by bright sources at large offsets (which have peaks of up to a few Jy in FIRST) that could not be adequately subtracted or cleaned out.
| Region | MERLIN | FIRST | |||||
|---|---|---|---|---|---|---|---|
| R.A. | Dec. | Peak | Int. | Size | Int | Size | |
| (J2000) | (mJy beam-1) | (mJy) | (arcsecarcsec,deg.) | (mJy) | (arcsecarcsec,deg.) | ||
| R1 | 10 43 55.2618 | +11 41 29.337 | 4.11 | (compact) | 1.91 | (compact) | |
| R2 | 10 43 59.5480 | +11 43 32.572 | 3.82 | ,101 | 22.12 | ,151.3 | |
| 10 43 59.5338 | +11 43 32.810 | 3.53 | (unresolved) | – | – | ||
| R3 | 10 44 01.4465 | +11 43 23.646 | 1.50 | ,103 | 23.19 | ,109.6 | |
| 10 44 01.5560 | +11 43 23.228 | 1.46 | ,17 | – | – | ||
| 10 44 01.4783 | +11 43 23.482 | 0.92 | ,144 | – | – | ||
| 10 44 01.3798 | +11 43 23.832 | 0.47 | ,152 | – | – | ||
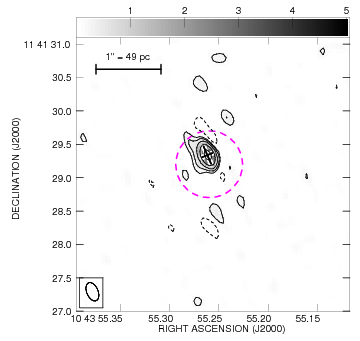
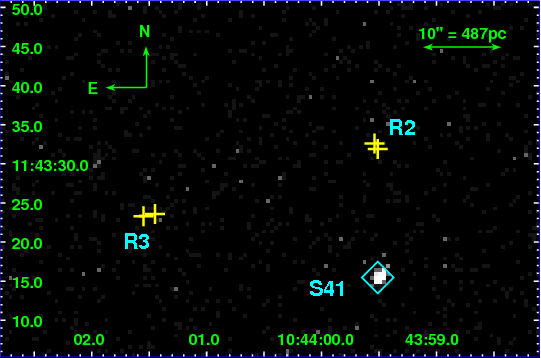
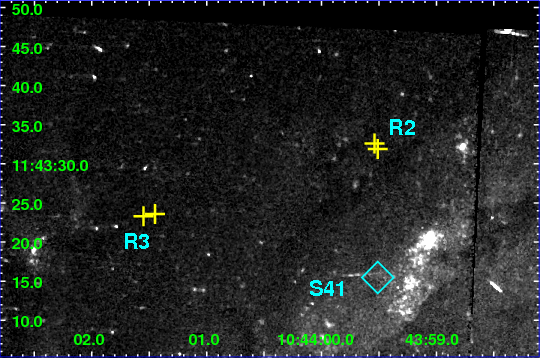
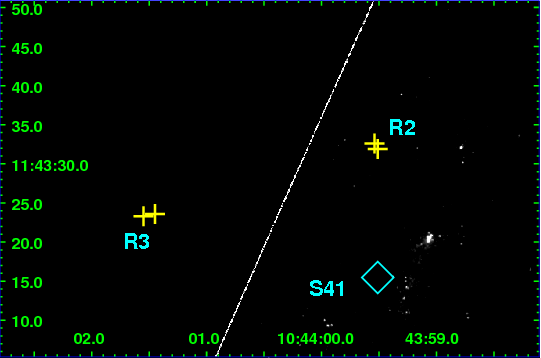
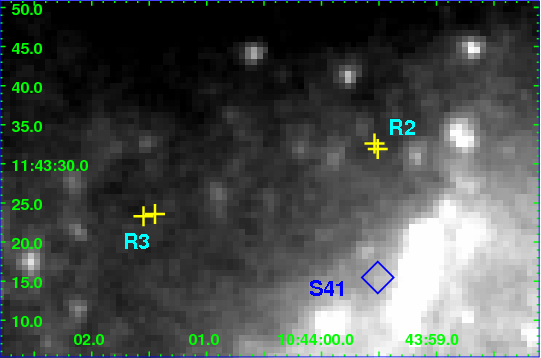
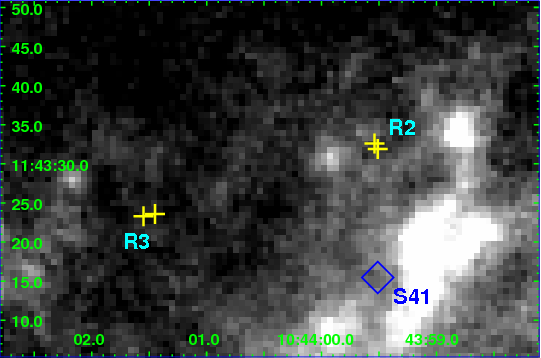
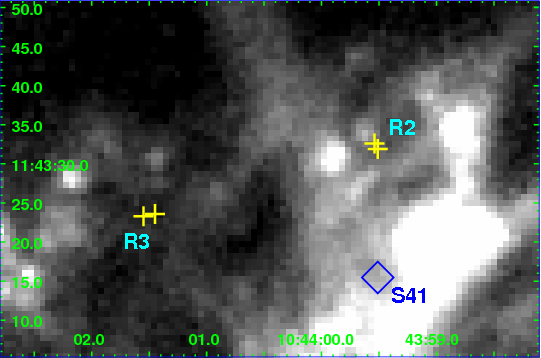
Three sources, abbreviated by us as R1, R2 and R3, were found within the central 100 arcsec in radius (see Figures 2 and 3). All of them are brighter than 1 mJy, and both R2 and R3 are significantly extended. R1 seems to be very compact, and MERLIN measured a higher flux density (4.1 mJy) than FIRST (1.9 mJy), suggesting not only that this source is smaller than the MERLIN beam, but also that it is compact enough to be highly variable, having approximately doubled in flux between the date of the FIRST survey and that of the MERLIN observations. The FITS header of the observations in the VLA archive shows that they were made in Dec 1999 and Jan 2000. That means that the size of R1 is constrained to be about 2.4 pc, corresponding to a light-travel diameter of 8 yr.
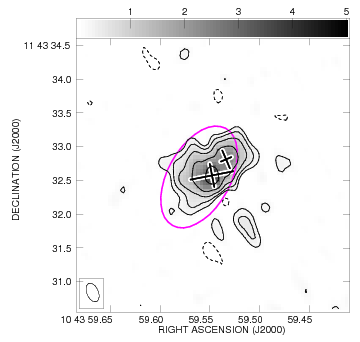
As can be appreciated in Figure 3, these sources display several faint, yet observable, substructures. R1 displays a relatively compact main knot, and the other features are too faint to be sure they are real. R2 has an unresolved knot to the southwest, not necessarily compact, but its components are too faint and irregular, or too blended, to measure their extent reliably. R3 shows three fainter knots. Although the intensity peak (in mJy per beam) of the brightest one is almost equal to that of the main knot, its integrated flux is less than a half. Table 2 lists the coordinates, peak surface brightness, integrated flux densities, and sizes for each knot, compared to the analogous values given in the FIRST survey (White et al., 1997). There are a few other features extended along the beam angle, but they seem to be artefacts and thus we have not listed them in the table. All fluxes and sizes, as well as their corresponding errors, have been estimated from the 4, 6 and 8 level contours. Sizes are given after deconvolution of the restoring beam, and their errors are smaller than 0.02 arcsec (5 ° in position angle) for sources brighter than 1 mJy. For fainter sources, the errors increase to 0.05 arcsec and 20 ° for sizes and position angles, respectively. The discrepancy between the two quoted position angles of R2 between the FIRST and MERLIN measurements (see middle panel of Figure 3) is partly due to the fact that the MERLIN PA is for the brighter peak only, whilst the FIRST PA is derived from a fit to the entire patch of emission. The position angle between the two MERLIN peaks is 136 deg, which agrees with the FIRST PA within the errors. FIRST does not give individual position angle errors. We have downloaded the image from the FIRST archive555http://sundog.stsci.edu/ and fitting R2 and R3 we have obtained an uncertainty of 14 and 18 deg, respectively.
| Region | SFR | ||||||||||
|---|---|---|---|---|---|---|---|---|---|---|---|
| (arcsec) | ( erg s-1) | (cm-3) | ( K) | (mJy) | ( yr-1) | (mJy) | |||||
| CNSFRs | 1.00 | 5.43 | 360 | 0.48 | 0.021 | 0.212 | 0.30 | 0.060 | 4.4 | 0.119 | 8.38 |
| 1.00 | 2.83 | 440 | 0.45 | 0.007 | 0.165 | 0.16 | 0.031 | 2.3 | 0.062 | 4.37 | |
| 1.00 | 7.00 | 430 | 0.45 | 0.018 | 0.296 | 0.36 | 0.077 | 5.7 | 0.154 | 10.80 | |
| 0.80 | 2.32 | 310 | 0.44 | 0.022 | 0.145 | 0.13 | 0.026 | 1.9 | 0.051 | 3.58 | |
| 0.60 | 1.03 | 360 | 0.54 | 0.021 | 0.106 | 0.06 | 0.011 | 0.8 | 0.023 | 1.59 | |
| 1.50 | 0.75 | 360 | 0.55 | 0.001 | 0.034 | 0.05 | 0.008 | 0.6 | 0.017 | 1.16 | |
| 1.00 | 1.80 | 410 | 0.46 | 0.005 | 0.114 | 0.10 | 0.020 | 1.5 | 0.040 | 2.78 | |
| 0.60 | 0.54 | 400 | 0.50 | 0.008 | 0.079 | 0.03 | 0.006 | 0.4 | 0.012 | 0.83 | |
| Centre | 24.00 | 23.60 | 10 | 1.00 | 0.016 | 0.001 | 2.14 | 0.260 | 19.2 | 0.519 | 36.41 |
| Disk | 400.00 | 45.50 | 1 | 1.00 | 0.001 | 0.000 | 4.13 | 0.500 | 125.1 | 1.001 | 70.20 |
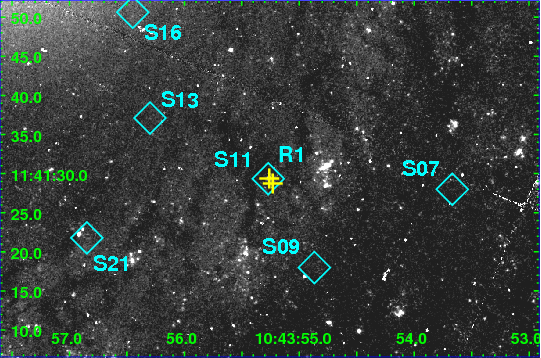
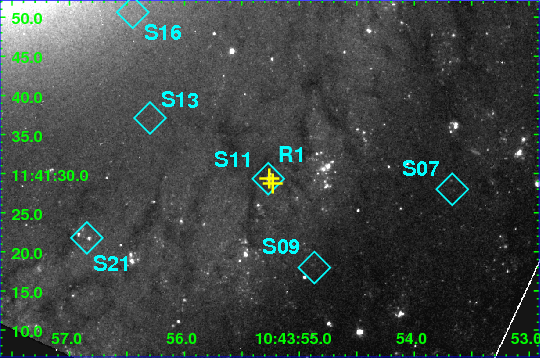
R1 is the only source that has a clear counterpart at other wavelengths, from X-rays to radio. It has already been observed and identified as an X-ray point source using Chandra data (S11 in the catalogue of Swartz et al., 2006). Galex at near- and far-UV, as well as Spitzer-MIPS at 70 and 160 m in the far-IR, do not show a clear counterpart due to their lower spatial resolution, leading to confusion and blending with nearby objects. Images of the region around R1 in different bands are shown in Figure 4: X-rays from the Chandra Data Archive666http://cda.harvard.edu/chaser/mainEntry.do, H and IR images from NED, HST-WFPC2 images from the Hubble Legacy Archive777http://hla.stsci.edu/hlaview.html (HLA) and the Multimission Archive at STScI888http://archive.stsci.edu/ (MAST). The X-ray image has been built by combining the three ks images available in the archive using the ciao 3.4 software (Fruscione et al., 2006). For R2 and R3, we find no obvious counterpart at any wavelength (see Figure 5). In fact, they seem to be located in regions devoid of emission in other bands. There is no correlation between these MERLIN radio sources and other catalogues, such as the atlas of Hii regions by Hodge & Kennicutt (1983) or Bradley et al. (2006). A general search in NED for entries around the positions of R2 and R3 also yielded negative results. They do not have satisfactory cross-identifications in SPECFIND (Vollmer et al., 2010), although either or both could be associated with 611 and 4850 MHz sources observed at lower resolution. The high flux densities observed at 611 MHz hint at these sources having a non-thermal origin.
We found no further sources brighter than 6 in the central region. In particular, the two nuclear sources catalogued in FIRST are resolved out in the present data. At larger radii, MERLIN observed 3 additional sources above the 6 limit that are projected inside the D25 isophote of NGC 3351. These sources (entries 10, 12, and 13 in Table 1, located at 2–3 arcmin from the centre of the observed field) were not detected in the FIRST survey nor in the VLA observations reported in Paladino et al. (2006).
4 Discussion
Early-type spiral galaxies such as NGC 3351 provide an ideal laboratory to study the very different environments in which star formation may take place, from the peculiar conditions of the CNSFRs (e.g. Hägele et al., 2009, 2010, and references therein) to the outskirts of the galaxy disk. Maps of radio-continuum emission can reveal the presence of SNRs and Hii regions through their synchrotron and thermal emission, respectively. These are closely related to the evolution of massive stars and are, therefore, excellent tracers of the recent star formation activity within the galaxy (see e.g. Muxlow et al., 1994). Moreover, young massive star-forming regions have very characteristic signatures in the radio band, providing strong constraints on the age of the most recent starbursts (see e.g. Rosa-González et al., 2007).
We have divided the galaxy in several regions, corresponding to different star formation regimes: the centre, which we define as the central 600 pc (12 arcsec radius) features the highest densities and metallicities, . The CNSFR complexes identified in Planesas et al. (1997) have been considered separately from the diffuse nuclear star formation. Finally, the galaxy disk ( pc, arcsec) represents a more typical, low-density environment with low to moderate metallicities. The main properties (diameter, luminosity, electron density and temperature, filling factor, thermal optical depth and flux density, star formation rate, total number of SNRs, expected number above our detection threshold, and total synchrotron flux density) of each region are summarised in Table 3. The eight CNSFRs are listed in the same order as in Planesas et al. (1997).
Diameters () of the CNSFR complexes are estimated from the HST F606W image, and luminosities [] are taken from Planesas et al. (1997), corrected for internal extinction using the colour excess [E(B-V)] estimated by Pérez-Olea (1996) and assuming the Galactic extinction law of Miller & Mathews (1972) with = 3.2 (Hägele, 2008). For the rest of the nuclear region (excluding the CNSFRs), the star formation rate derived from the Br luminosity (Puxley et al., 1990) has been converted to an luminosity by means of the empirical relation given by Rosa-González et al. (2002). For the galactic disk, the SFR measured by Leroy et al. (2008) has been used.
Electron densities () of the emitting gas in the CNSFRs have been computed from the [Sii]6717/6731 Å line ratio, and electron temperatures refer to ([Oiii]) (Díaz et al., 2007). For the eighth region, values of 400 cm-3 and 5000 K have been assumed. The ambient ISM densities of the central diffuse region and the disk are 10 and 1 cm-3, respectively, with a temperature of K. The associated filling factors () are given by expression (5). As explained in Appendix A, the predicted optical depth () and flux density () at 1.42 GHz arising from thermal bremsstrahlung take into account self-absorption, although the effect is found to be mild at this frequency.
Star formation rates have been estimated from the luminosity (Rosa-González et al., 2002), and the expected number of SNRs () has been computed according to equation (18), assuming an ambient ISM density of 10 cm-3 for the CNSFRs. The number of SNRs brighter than 0.3 mJy () is given by expression (24), and the total synchrotron emission from the whole population of unresolved supernovae () has been estimated from the empirical relation between the star formation rate and the 1.4 GHz luminosity density reported by Yun et al. (2001).
As shown in the previous section, our analysis of the sub-arcsecond spatial resolution radio map of NGC 3351 shows the presence of 23 sources in the L-band. Three of them (R1, R2 and R3) are located within the central 100 arcsec in radius. They have clear counterparts in the FIRST survey (White et al., 1997) and the VLA data analysed by Paladino et al. (2006), but only R1 seems to be visible at other wavelengths. It is unresolved by MERLIN, putting an upper limit of pc on its size, but its variability (Section 3) suggests that it is pc. As shown in Figure 5, neither R2 nor R3 display significant emission in X-ray, UV, optical, or IR images. These sources are significantly extended (see Figure 3). They are separated by about half an arcmin and could possibly be associated with jets from a background AGN. FIRST contains about 7 sources deg-2 brighter than 20 mJy; the probability of finding one of them within a region of 100 arcsec radius chosen at random is only per cent, but their observed fluxes and extents are difficult to reconcile with a stellar origin. Moreover, the chance of two unrelated sources of such high brightness occurring so close together is extremely low, favouring the background AGN scenario. Thus, the only radio point source above 0.3 mJy that may be related to star formation in NGC 3351 is R1.
In particular, we have not detected any point source in the nuclear region. The thermal emission predicted for each of the CNSFR complexes ranges from 0.03 to 0.36 mJy, slightly below our detection limit999For the requested observing time of 48 hours, the expected noise level would have been mJy under good weather conditions.. The estimated fluxes are fairly robust with respect to the adopted sizes. Smaller diameters, appropriate for the individual knots (see e.g. Hägele et al., 2007), yield higher filling factors and optical depths, smaller areas, and, then, similar fluxes. On the other hand, a number of supernovae is expected to be present in these regions. The expected probability of finding a SNR brighter than 0.3 mJy in the circumnuclear ring is relatively high ( per cent), and the synchrotron flux associated to the unresolved population within each CNSFR (last column of Table 3) would have been easily detected by MERLIN. Therefore, the observed lack of emission suggests that these systems are younger than the lifetimes of the most massive stars (see e.g. Rosa-González et al., 2007). This seems also to be the case in similar CNSFRs observed in other galaxies (e.g. Dors et al., 2008, in NGC 6951).
Regarding the star formation activity in the rest of the central region, the predicted number of bright SNR is also , and the total synchrotron flux is estimated to be about 36 mJy. Indeed, VLA observations at a minimum resolution of arcsec reveal a large central core, about 20 arcsec in size, featuring a double emission peak with maximum surface brightness about 1010 mJy sr-1 (Paladino et al., 2006), mJy per MERLIN beam (close to the rms noise of our observations) if the emission was uniformly distributed. If star formation takes place in compact knots, similar in size to those in the CNSFRs, this emission ought to display conspicuous small-scale structure that should be detected by MERLIN. However, MERLIN is only sensitive to scales smaller than arcsec, which is pc at the distance of NGC 3351. Therefore, the relativistic electrons generated by the supernova explosions must have diffused over distances longer than our maximum resolution radius of pc, and the true diffusion scale would thus be somewhere in between this value and the 300 pc (6 arcsec) where the radio-IR correlation is observed by Paladino et al. (2006).
The total flux density at 1.42 GHz, integrated over the whole galaxy, is predicted to be Jy. According to equation (24), the expected number of radio sources above 0.3 mJy in the disk of NGC 3351 is of the order of one, consistent with the interpretation that R1 is a young SNR. However, an increase in flux of a factor of two between the FIRST observations and our data seems difficult to justify in this scenario. Two possible explanations would be that FIRST caught the supernova near the time of the explosion, where the radio continuum was still rising, and we are now observing a very young remnant, as suggested by its high luminosity. An alternative possibility would be that the radio flux has increased due to density variations in the ambient medium. Some Galactic nebulae, such as Cas A (Erickson & Perley, 1975; Read, 1977; Chevalier et al., 1978) and GK Per (Anupama & Kantharia, 2005) also show anomalous increases in flux density, albeit at lower frequencies. Ideally SNRs could be identified based on the radio spectral index, and future observations will be sought based on the results of the current work.
5 Summary
We present high spatial resolution radio continuum observations at 1.42 GHz acquired with the Multi-Element Radio Linked Interferometer Network (MERLIN) in and around NGC 3351. We found 23 radio sources in a field of 35 by 22 arcmin centred in this galaxy. 6 of them are projected within its D25 isophote, and 3 are located inside the central 100 arcsec in radius. Two of these three are significantly extended, and the other one is the only source with a previously detected counterpart at other wavelengths. Our results suggest that this radio source might correspond to a young supernova remnant, while the other two are probably related to jets from a background AGN.
We do not detect individual supernovae or SNRs in the central region of the galaxy. The CNSFRs are too young (less than a few Myr) to host supernovae, and the diffusion length of the relativistic electrons in the ISM seems to be larger than our maximum resolution of 50 pc. Detecting the thermal bremsstrahlung emission from the circumnuclear Hii regions requires deeper observations. e-MERLIN will allow NGC 3351 to be mapped at a sensitivity of Jy beam-1 in a similar observation, thanks not only to the increased sensitivity provided by 0.5 MHz bandwidth around 1.5 GHz but also to the new correlator which will allow the entire primary beam to be imaged without distortion.
Acknowledgments
We are grateful to an anonymous referee for his/her constructive comments and revision of our manuscript.
MERLIN is a National Facility operated by the University of Manchester at Jodrell Bank Observatory on behalf of STFC.
Some of the data presented in this paper were obtained from the Multimission Archive at the Space Telescope Science Institute (MAST) and the Hubble Legacy Archive, which is a collaboration between the Space Telescope Science Institute (STScI/NASA), the Space Telescope European Coordinating Facility (ST-ECF/ESA) and the Canadian Astronomy Data Centre (CADC/NRC/CSA). STScI is operated by the Association of Universities for Research in Astronomy, Inc., under NASA contract NAS5-26555. Support for MAST for non-HST data is provided by the NASA Office of Space Science via grant NAG5-7584 and by other grants and contracts.
This research has made use of data obtained from the Chandra Data Archive, and software provided by the Chandra X-ray Center (CXC) in the application package CIAO.
This research has made use of the NASA/IPAC Extragalactic Database (NED) which is operated by the Jet Propulsion Laboratory, California Institute of Technology, under contract with the National Aeronautics and Space Administration and of the SIMBAD database, operated at CDS, Strasbourg, France. HST
Financial support for this work has been provided by the Spanish Ministerio de Educación y Ciencia (AYA2007-67965-C03-03). Partial support from the Comunidad de Madrid under grant S-0505/ESP/000237 (ASTROCAM) is acknowledged.
References
- Alloin & Nieto (1982) Alloin D., Nieto J.-L., 1982, A&AS, 50, 491
- Anupama & Kantharia (2005) Anupama G. C., Kantharia N. G., 2005, A&A, 435, 167
- Baars et al. (1977) Baars J. W. M., Genzel R., Pauliny-Toth I. I. K., Witzel A., 1977, A&A, 61, 99
- Bradley et al. (2006) Bradley T. R., Knapen J. H., Beckman J. E., Folkes S. L., 2006, A&A, 459, L13
- Browne et al. (1998) Browne I. W. A., Wilkinson P. N., Patnaik A. R., Wrobel J. M., 1998, MNRAS, 293, 257
- Cannon & Skillman (2004) Cannon J. M., Skillman E. D., 2004, ApJ, 610, 772
- Chevalier et al. (1978) Chevalier R. A., Oegerle W. R., Scott J. S., 1978, ApJ, 222, 527
- Cid Fernandes et al. (2001) Cid Fernandes R., Heckman T., Schmitt H., Delgado R. M. G., Storchi-Bergmann T., 2001, ApJ, 558, 81
- Clark & Caswell (1976) Clark D. H., Caswell J. L., 1976, MNRAS, 174, 267
- Colina et al. (1997) Colina L., García Vargas M. L., Mas-Hesse J. M., Alberdi A., Krabbe A., 1997, ApJ, 484, L41+
- Colina et al. (2002) Colina L., Gonzalez Delgado R., Mas-Hesse J. M., Leitherer C., 2002, ApJ, 579, 545
- Condon (1992) Condon J. J., 1992, ARA&A, 30, 575
- Dale et al. (2007) Dale D. A., Gil de Paz A., Gordon K. D., et al., 2007, ApJ, 655, 863
- de Vaucouleurs et al. (1991) de Vaucouleurs G., de Vaucouleurs A., Corwin Jr. H. G., Buta R. J., Paturel G., Fouque P., 1991, Third Reference Catalogue of Bright Galaxies. Volume 1-3, XII, 2069 pp. 7 figs.. Springer-Verlag Berlin Heidelberg New York
- Devereux et al. (1992) Devereux N. A., Kenney J. D., Young J. S., 1992, AJ, 103, 784
- Díaz et al. (2000) Díaz A. I., Álvarez M. Á., Terlevich E., Terlevich R., Portal M. S., Aretxaga I., 2000, MNRAS, 311, 120
- Díaz et al. (2007) Díaz Á. I., Terlevich E., Castellanos M., Hägele G. F., 2007, MNRAS, 382, 251
- Dicaire et al. (2008) Dicaire I., Carignan C., Amram P., Hernandez O., Chemin L., Daigle O., de Denus-Baillargeon M., Balkowski C., Boselli A., Fathi K., Kennicutt R. C., 2008, MNRAS, 385, 553
- Dors et al. (2008) Dors Jr. O. L., Storchi-Bergmann T., Riffel R. A., Schimdt A. A., 2008, A&A, 482, 59
- Draine et al. (2007) Draine B. T., Dale D. A., Bendo G., et al., 2007, ApJ, 663, 866
- Elmegreen et al. (1997) Elmegreen D. M., Chromey F. R., Santos M., Marshall D., 1997, AJ, 114, 1850
- Erickson & Perley (1975) Erickson W. C., Perley R. A., 1975, ApJ, 200, L83
- Fruscione et al. (2006) Fruscione A., McDowell J. C., Allen G. E., et al., 2006, in Wimmer-Schweingruber R. F., ed., Society of Photo-Optical Instrumentation Engineers (SPIE) Conference Series Vol. 6270 of Presented at the Society of Photo-Optical Instrumentation Engineers (SPIE) Conference, CIAO: Chandra’s data analysis system. pp 23–+
- González Delgado et al. (1998) González Delgado R., Heckman T., Leitherer C., Meurer G., Krolik J., Wilson A. S., Kinney A., Koratkar A., 1998, ApJ, 505, 174
- Graham et al. (1997) Graham J. A., Phelps R. L., Freedman W. L., et al., 1997, ApJ, 477, 535
- Hägele (2008) Hägele G. F., 2008, PhD thesis, Universidad Autónoma de Madrid
- Hägele et al. (2007) Hägele G. F., Díaz A. I., Cardaci M. V., Terlevich E., Terlevich R., 2007, MNRAS, 378, 163
- Hägele et al. (2009) Hägele G. F., Díaz A. I., Cardaci M. V., Terlevich E., Terlevich R., 2009, MNRAS, 396, 2295
- Hägele et al. (2010) Hägele G. F., Díaz Á. I., Cardaci M. V., Terlevich E., Terlevich R., 2010, MNRAS, 402, 1005
- Helfer et al. (2003) Helfer T. T., Thornley M. D., Regan M. W., Wong T., Sheth K., Vogel S. N., Blitz L., Bock D., 2003, ApJS, 145, 259
- Hodge & Kennicutt (1983) Hodge P. W., Kennicutt Jr. R. C., 1983, AJ, 88, 296
- Hoyos & Díaz (2006) Hoyos C., Díaz A. I., 2006, MNRAS, 365, 454
- Jogee et al. (2005) Jogee S., Scoville N., Kenney J. D. P., 2005, ApJ, 630, 837
- Johnson et al. (2009) Johnson K. E., Hunt L. K., Reines A. E., 2009, AJ, 137, 3788
- Johnson et al. (2003) Johnson K. E., Indebetouw R., Pisano D. J., 2003, AJ, 126, 101
- Johnson et al. (2001) Johnson K. E., Kobulnicky H. A., Massey P., Conti P. S., 2001, ApJ, 559, 864
- Kennicutt et al. (2003) Kennicutt Jr. R. C., Armus L., Bendo G., et al., 2003, PASP, 115, 928
- Kennicutt et al. (1989) Kennicutt Jr. R. C., Keel W. C., Blaha C. A., 1989, AJ, 97, 1022
- Kobulnicky & Johnson (1999) Kobulnicky H. A., Johnson K. E., 1999, ApJ, 527, 154
- Leroy et al. (2009) Leroy A. K., Walter F., Bigiel F., Usero A., Weiss A., Brinks E., de Blok W. J. G., Kennicutt R. C., Schuster K., Kramer C., Wiesemeyer H. W., Roussel H., 2009, AJ, 137, 4670
- Leroy et al. (2008) Leroy A. K., Walter F., Brinks E., Bigiel F., de Blok W. J. G., Madore B., Thornley M. D., 2008, AJ, 136, 2782
- Martin (1995) Martin P., 1995, AJ, 109, 2428
- Melnick et al. (1988) Melnick J., Terlevich R., Moles M., 1988, MNRAS, 235, 297
- Mezger & Henderson (1967) Mezger P. G., Henderson A. P., 1967, ApJ, 147, 471
- Miller & Mathews (1972) Miller J. S., Mathews W. G., 1972, ApJ, 172, 593
- Muñoz-Mateos et al. (2009) Muñoz-Mateos J. C., Gil de Paz A., Zamorano J., Boissier S., Dale D. A., Pérez-González P. G., Gallego J., Madore B. F., Bendo G., Boselli A., Buat V., Calzetti D., Moustakas J., Kennicutt R. C., 2009, ApJ, 703, 1569
- Muxlow et al. (1994) Muxlow T. W. B., Pedlar A., Wilkinson P. N., Axon D. J., Sanders E. M., de Bruyn A. G., 1994, MNRAS, 266, 455
- Paladino et al. (2006) Paladino R., Murgia M., Helfer T. T., Wong T., Ekers R., Blitz L., Gregorini L., Moscadelli L., 2006, A&A, 456, 847
- Pérez-Olea (1996) Pérez-Olea D., 1996, PhD Thesis. Universidad Autónoma de Madrid
- Planesas et al. (1997) Planesas P., Colina L., Pérez-Olea D., 1997, A&A, 325, 81
- Puxley et al. (1990) Puxley P. J., Hawarden T. G., Mountain C. M., 1990, ApJ, 364, 77
- Read (1977) Read P. L., 1977, MNRAS, 178, 259
- Regan et al. (2001) Regan M. W., Thornley M. D., Helfer T. T., Sheth K., Wong T., Vogel S. N., Blitz L., Bock D., 2001, ApJ, 561, 218
- Rosa-González et al. (2007) Rosa-González D., Schmitt H. R., Terlevich E., Terlevich R., 2007, ApJ, 654, 226
- Rosa-González et al. (2002) Rosa-González D., Terlevich E., Terlevich R., 2002, MNRAS, 332, 283
- Rubin et al. (1975) Rubin V. C., Peterson C. J., Ford Jr. W. K., 1975, ApJ, 199, 39
- Salpeter (1955) Salpeter E. E., 1955, ApJ, 121, 161
- Sandage & Tammann (1987) Sandage A., Tammann G. A., 1987, A revised Shapley-Ames Catalog of bright galaxies. Carnegie Institution of Washington Publication, Washington: Carnegie Institution, 1987, 2nd ed.
- Sérsic & Pastoriza (1965) Sérsic J. L., Pastoriza M., 1965, PASP, 77, 287
- Sérsic & Pastoriza (1967) Sérsic J. L., Pastoriza M., 1967, PASP, 79, 152
- Shklovskii (1960) Shklovskii I. S., 1960, AZh, 37, 256
- Swartz et al. (2006) Swartz D. A., Yukita M., Tennant A. F., Soria R., Ghosh K. K., 2006, ApJ, 647, 1030
- Tsai et al. (2006) Tsai C.-W., Turner J. L., Beck S. C., Crosthwaite L. P., Ho P. T. P., Meier D. S., 2006, AJ, 132, 2383
- Tsai et al. (2009) Tsai C.-W., Turner J. L., Beck S. C., Meier D. S., Ho P. T. P., 2009, AJ, 137, 4655
- Turner et al. (2000) Turner J. L., Beck S. C., Ho P. T. P., 2000, ApJ, 532, L109
- Urošević et al. (2005) Urošević D., Pannuti T. G., Duric N., Theodorou A., 2005, A&A, 435, 437
- van de Ven & Chang (2009) van de Ven G., Chang P., 2009, ApJ, 697, 619
- Vollmer et al. (2010) Vollmer B., Gassmann B., Derrière S., Boch T., Louys M., Bonnarel F., Dubois P., Genova F., Ochsenbein F., 2010, A&A, 511, A53+
- White et al. (1997) White R. L., Becker R. H., Helfand D. J., Gregg M. D., 1997, ApJ, 475, 479
- Woltjer (1972) Woltjer L., 1972, ARA&A, 10, 129
- Yun et al. (2001) Yun M. S., Reddy N. A., Condon J. J., 2001, ApJ, 554, 803
Appendix A Thermal bremsstrahlung from Hii regions
Thermal bremsstrahlung from Hii regions can be a potential signature of star formation in the radio band. The optical depth through an ionised hydrogen cloud can be approximated by (Mezger & Henderson, 1967)
| (1) |
where the emission measure is defined as the integral along the line of sight
| (2) |
with and denoting electron and ion density, respectively. For a pure hydrogen, fully ionised plasma, . Including helium would introduce a correction of the order of 10 per cent, and the contribution of heavier elements is negligible.
The overall extent of the CNSFRs in NGC 3351 is pc, but most of the emission comes from a few compact knots of pc radius. The characteristic electron density of the emitting gas is accurately measured by the ratio between the optical sulphur lines [Sii]6717/6731 Å, with typical values of cm-3 (Díaz et al., 2007). The volume filling factor of the (unresolved) knots can be derived from luminosity of the entire region
| (3) |
where erg is the energy of the transition,
| (4) |
is the rate coefficient, and a cylindrical geometry with both diameter and depth has been assumed for simplicity. The uncertainty associated with this assumption is high (e.g. the difference with respect to a perfect sphere of diameter is a factor of ), and it constitutes an important source of error in the following estimates. With this caveat in mind, the filling factor of the emitting gas is approximately given by the expression
| (5) |
If there is a small number of identical knots within the region, so that they do not overlap along the line of sight, the total emission measure would be
| (6) |
and the total area that they subtend on the sky is
| (7) |
whereas for large , assuming that the knots are randomly distributed,
| (8) |
and
| (9) |
The two cases and can be considered as reasonable upper and lower limits to the emission measure, respectively. The radio optical depth is thus bracketed by
| (10) | |||||
with . Taking the geometric average, , the relative error incurred in the optical depth is smaller than a factor .
The radio-continuum surface brightness is given by the expression
| (11) |
where is the Planck function for a black body at temperature in the Rayleigh-Jeans approximation, and the flux density at the Earth is
| (12) | |||||
In the optically thin case, implies
| (13) |
and one recovers the well-known relation
| (14) |
between the radio continuum and fluxes. In the general case, the radio-continuum flux density may be estimated by combining expressions (5), (10), and (12).
Appendix B Synchrotron emission from supernova remnants
Assuming that all stars more massive than explode as core collapse (Type II) supernovae, the number of such events per unit time is determined by the SFR and the initial mass function (IMF) of the stellar population,
| (15) |
where is the lifetime of a star of mass . For a Salpeter (1955) IMF, , with minimum and maximum stellar masses and , respectively. If the SFR is constant over the period Myr that the least massive supernovae take to explode,
| (16) |
SNRs can be detected as compact synchrotron sources during the characteristic time
| (17) |
of the adiabatic expansion phase, where denotes the energy input by the original supernova explosion, and is the density of the ambient gas (Woltjer, 1972). The total number of SNR observable at a given time in the radio band would be
| (18) | |||||
assuming erg. The approximation of constant SFR for the last 40 Myr and a density cm-3 are probably valid for most regions of the galaxy disk, where a moderate star formation surface density of the order of is observed without prominent signatures of intense starbursts (see e.g. Leroy et al., 2008). The expected supernova surface density throughout the disk is thus
| (19) |
and the total number of SNR in a corona between 0.6 and 10 kpc (12 and 200 arcsec) from the galactic centre would be about 125, corresponding to an integrated SFR of .
The inner 600 pc of NGC 3351 are also forming stars at a rate of . A large fraction (about , see Hägele et al., 2007) can be accounted for by the young starbursts of the CNSFRs, yielding a diffuse contribution of . Although equation (18) predicts a similar number of supernovae in the central region than in the whole disk, the density of the ISM is arguably higher. Using cm-3, the expected number of SNR becomes . Concerning the individual CNSFRs, the observed values of suggest that most bursts should contain SNRs. However, one has to bear in mind that the star formation activity may have varied considerably over the last Myr. In the most extreme case, there is the possibility that all bursts are younger than 3 Myr, and therefore no supernova could have exploded yet. On the other hand, it is likely that the gas inside and around the CNSFRs is considerably denser than 10 cm-3, leading to a shorter radio lifetime and a smaller number of radio-emitting SNR.
Regardless of the number of sources actually present in the galaxy, they must be bright enough in order to be included in our sample. A relation between the radio surface brightness and the diameter of SNRs has long been established both theoretically (Shklovskii, 1960) and observationally (Clark & Caswell, 1976). At 1 GHz, Urošević et al. (2005) obtain
| (20) |
combining data from different nearby galaxies. To estimate the flux density of an extended source, one has to multiply its surface brightness by the solid angle subtended by the MERLIN beam,
| (21) |
where we have used arcsec and a spectral index to convert 1 GHz fluxes to GHz. At the adopted distance of NGC 3351, an angle of 0.2 arcsec corresponds to a physical size of pc and a flux density of Jy beam-1, below the noise level of the present data. Therefore, any SNR above our detection threshold must appear as an unresolved point source with flux
| (22) |
For a source as bright as R1 (4 mJy), the expected diameter is only pc, for which the SNR would still be in the free expansion phase. Assuming an average expansion velocity of km s-1, the age of this system should be about 35 years. Substituting this number instead of in equation (18), one obtains
| (23) |
Lowering the threshold to Jy, the diameter increases to 1.72 pc, and the expected number of sources becomes
| (24) |