Investigation of the New Local Group Galaxy VV 124
Abstract
We present the results of our stellar photometry and spectroscopy for the new Local Group galaxy VV 124 (UGC 4879) obtained with the 6-m BTA telescope. The presence of a few bright supergiants in the galaxy indicates that the current star formation process is weak. The apparent distribution of stars with different ages in VV 124 does not differ from the analogous distributions of stars in irregular galaxies, but the ratio of the numbers of young and old stars indicates that VV 124 belongs to the rare Irr/Sph type of galaxies. The old stars (red giants) form the most extended structure, a thick disk with an exponential decrease in the star number density to the edge. Definitely, the young population unresolvable in images makes a great contribution to the background emission from the central galactic regions. The presence of young stars is also confirmed by the [O III] emission line visible in the spectra that belongs to extensive diffuse galactic regions. The mean radial velocity of several components (two bright supergiants, the unresolvable stellar population, and the diffuse gas) is km s-1 and the velocity with which VV 124 falls into the Local Group is km s-1. We confirm the distance to the galaxy ( Mpc) and the metallicity of red giants ([Fe/H] = 1.37) found by Kopylov et al. (2008). VV 124 is located on the periphery of the Local Group approximately at the same distance from M 31 and our Galaxy and is isolated from other galaxies. The galaxy LeoA nearest to it is 0.5 Mpc away.
INTRODUCTION
Our Local Group holds a special place in studying the parameters of nearby groups of galaxies, because all of its galaxies are located at the shortest distances from our Galaxy. Such a close neighborhood gives a unique opportunity to study in detail the stellar population of individual galaxies and the kinematics of their subsystems as well as to accurately measure the distances to individual galaxies and their velocities. The values obtained are used to determine the dynamical characteristics of the Local Group and to search for possible correlations between the parameters of an individual galaxy and its location among the Local Group galaxies. When the groups of galaxies are studied, the Local Group parameters are commonly used as a reference in comparing them with the parameters of morphologically similar groups of galaxies.
It is not always obvious whether a galaxy belongs to the Local Group. This is particularly true of pe- ripheral galaxies. For example, the list of Local Group galaxies from Mateo (1998) numbers 40 members, while the more recent paper by Van den Bergh (2000) contains only 36 members, because some of the dis- tant galaxies were excluded from the list: UGCA 92, UGCA 438, GR 8, and others. Refined data show that these galaxies are actually outside the Local Group. In the long run, the size and mass of the Local Group and, hence, the membership of peripheral galaxies in the Local Group are determined from accurate data on the velocities and distances of all the galaxies that constitute the Local Group (Whiting , 2005).
In searching for new nearby galaxies, great hopes have been pinned on the Sloan Digital Sky Survey (SDSS). Indeed, when approximately a quarter of the celestial sphere was investigated, more than ten new Local Group galaxies were found (Zucker et al., 2004, 2006, 2007; Willman et al., 2005; Walsh et al., 2007; Belokurov et al. , 2006; Irwin et al., 2007). Three new Local Group galaxies have recently been discovered in images when the southwestern quadrant of M31 was surveyed (McConnachie et al. , 2008).
All of the galaxies discovered in the last decade have low masses and low luminosities (). Therefore, the discovery that the well-known bright irregular galaxy VV 124 is a member of the Local Group (Kopylov et al., 2008) with luminosity was quite unexpected. The interest in the new Local Group member VV 124 is that this galaxy is fairly isolated from the neighboring galaxies and it has evolved without any interaction with the giant M31 or our Galaxy. Since VV 124 is located on the periphery of the Local Group, an accurate measurement of its main characteristics and, most importantly, its radial velocity allows the location of the zero-velocity sphere, i.e., the dynamical boundary of the Local Group, to be refined. The first publication (Kopylov et al., 2008) described the history of the discovery of VV 124 and briefly presented our preliminary results. In this paper, we present more complete results of our analysis of the observations for VV 124. Since the radial velocity estimate for the new galaxy is a fundamentally important characteristic because of its location at the boundary of the Local Group, we present reprocessed (to increase the accuracy) and more detailed radial velocity measurements for various components of VV 124.
OBSERVATIONS
The observations of VV 124 and their reduction were described in detail previously (Kopylov et al., 2008); these were carried out with the 6-m BTA telescope on January 11, 2008, (direct and images) and on February 6, 2008 (long-slit spectroscopy). Since the galaxy is well resolved into stars in all images (Fig. 1), we could perform stellar photometry and, based on the results obtained, determine the distance to the galaxy and study the distribution of stars with different ages over the galactic body.
The wavelength range from 4000 to 5600 Å was observed at a spectral resolution of 5 Å. The initial accuracy of constructing the wavelength scale is 5–10 km s-1. We checked the radial velocities in the entire spectral range using atmospheric lines ([O I] and Hg I ); this check showed the wavelength scale to be accurate to within 5 km s-1. However, the accuracy of radial velocity measurements is also determined by the spectrum quality. The radial velocities of narrow emission lines from nebulae are measured more reliably than those of broad hydrogen lines from the background of unresolved stars. Below, we describe in detail the results of our velocity measurements for various components of the galaxy. In this paper, we present reprocessed spectroscopic measurements. In addition to the data published in Kopylov et al. (2008), we measured the velocities of a large number of galactic components distributed more widely over the galactic body and, hence, these new measurements well represent the velocity of VV 124.
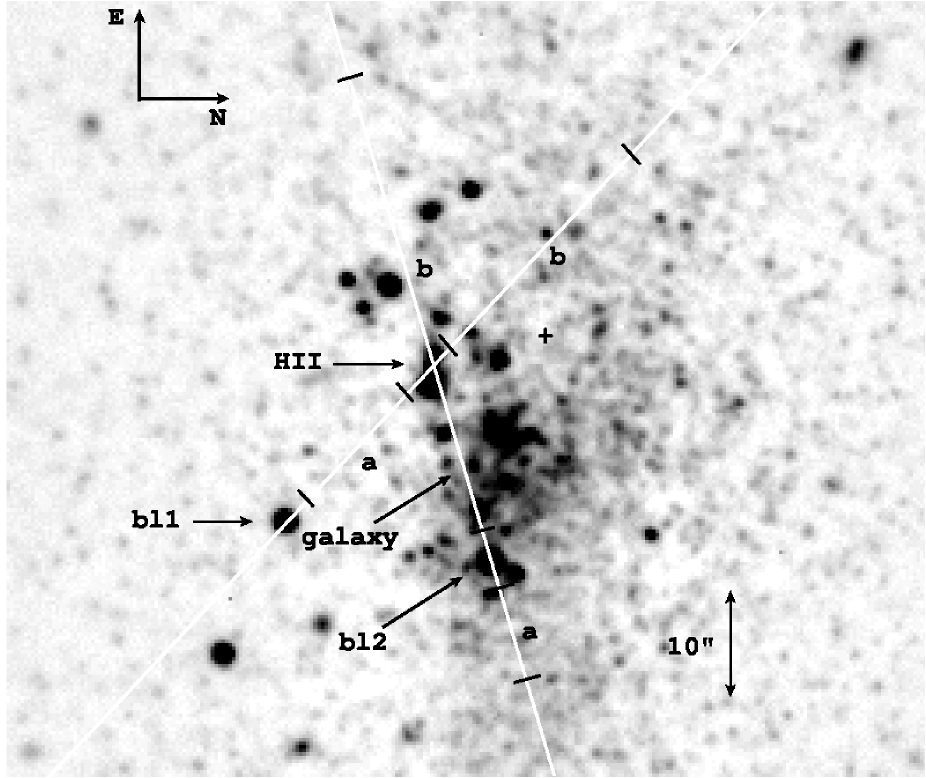
We used two spectrograph slit positions (see Fig. 5 below): the slit passed through the stars bl1 (slit 1) and bl2 (slit 2) at the first and second positions, respectively. The slit width in both cases was . A weak extended emission in the [OIII] 4959 and 5007 Å, lines and in the H line was recorded at the two slit positions. A very compact H II region emitting the H line was detected on slit 1 and a distant emission-line galaxy was projected by chance onto slit 2.
STELLAR PHOTOMETRY
The stellar photometry was performed in a standard way using DAOPHOT II in MIDAS (Stetson , 1994). As a result, we obtained tables with stellar coordinates, magnitudes, and associated parameters that allowed us to estimate the photometric accuracy and the deviation of the profile of each photometered object from the standard profile of a PSF star (CHI and SHARPNESS). The table was selected by these parameters (CHI and SHARPNESS ) (Stetson , 1994) to remove all of the diffuse objects and false stars that appeared in the list due to a few cosmic-ray particle hits remained in the images after the primary data reduction from the final list of stars. The transformation equations from the instrumental magnitudes obtained by the photometry program to the and magnitudes of the Kron–Cousins system were derived from the photometry of standard stars in field SA98 (Landolt, 1992), whose images were obtained on the same night as the images of the galaxy VV 124 under study:
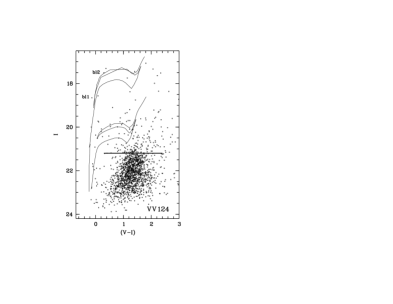
The results of our photometry are presented in Fig. 2 in the form of a Hertzsprung–Russell (or CM) diagram. The constructed diagram does not differ from the analogous diagrams for galaxies with low star formation rates (Irr/Sph), as is observed, for example, in the Phoenix galaxy (Holtzman et al., 2000). We see from the diagram in Fig. 2 that most of the stars in the galaxy are old red giant branch (RGB) stars, while the blue supergiants form a sparsely populated branch due to the weakness of the star formation process. The two fitted isochrones with metallicity Z = 0.008 and ages of 16 and 63 Myr ((Bertelli et al. , 1994) indicate that the two blue stars bl1 and bl2 whose spectra are described below are no older than 20 Myr. Our spectroscopy (see below) shows that bl1 is a blue supergiant and bl2 is a yellow supergiant. Thus, weak star formation took place in VV 124 several tens of Myr ago.
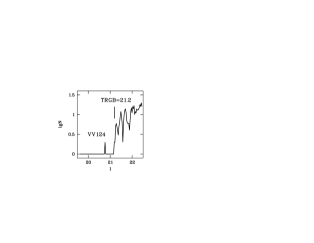
Since the RGB is clearly seen on the diagram (Fig. 2), we used the TRGB method (Lee , 1993) based on determining the tip of the RGB to estimate the distance. The accuracy of the method increases if only the galaxy’s peripheral stars are used for the measurements, with the central regions ex- cluded. This is because the spatial distributions of stars with different ages in irregular galaxies differ (Tikhonov, 2005, 2006). By their presence, the brighter (than red giants) AGB stars on the CM diagram smear the sharp tip of the RGB in the luminosity function. Since the AGB stars are strongly concentrated to the galactic center, their influence can be reduced by excluding the central galactic region from the measurements. Thus, in constructing the luminosity function of red giants and determining the tip of the RGB (TRGB jump), we used a spatial selection of stars along the radius of the galaxy and along its minor axis, leaving the stars at and .
The restrictions along the minor axis stem from the fact that the galaxy has well-defined boundaries and we reduce the number of background stars in the luminosity function, establishing this selection. The luminosity function for red giants exhibits a sharp increase in the number of stars at (Fig. 3), which corresponds to the beginning of the RGB (TRGB jump). Using the inferred tip of the RGB, we determined the mean color indices of the giant branch: and (Lee , 1993). The extinction toward VV 124 was taken from the measurements by Schlegel et al. 1998): , = 0.029, and . At the adopted extinction coeffcients, we obtain: , , nd . Using equations from Lee et al. (1993), we determined the metallicity of red giants for VV 124, [Fe/H] = 1.37, and the distance to the galaxy, Mpc. Since there is virtually no stellar metallicity gradient in dwarf galaxies, [Fe/H] = 1.37 may be considered to be the metallicity of red giants in the entire galaxy. Thus, we confirm the distance to VV 124 and the metallicity of red giants obtained by Kopylov et al. (2008).
THE APPARENT DISTRIBUTION OF STARS WITH DIFFERENT AGES
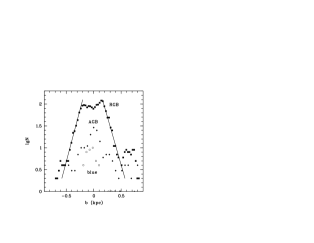
Having identified the stars with different ages on the CM diagram (Fig. 2): young stars (blue supergiants), intermediate-age stars (AGB), and old stars (red giants), we constructed their apparent distribution in the galaxy. Figure 4 shows the number density distribution of stars with different ages along the minor axis. Along the major axis, the galaxy goes beyond our images. However, an extrapolation is possible to determine its size, because the change in the number density of stars is usually expressed by a linear dependence in logarithmic coordinates.
Our measurements showed that the young blue stars in VV 124 form a kpc subsystem that is usually called a thin disk, the intermediate-age (AGB) stars form a kpc disk, and the red giants form a kpc () stellar subsystem called a thick disk. We see from Fig. 4 that the number density decreases exponentially toward the edge for all types of stars. This is obvious for the red giants, while for the AGB and blue stars their distributions are consistent with exponential ones. The only region of weak star formation is located in the galaxy asymmetrically relative to the apparent optical galactic center coincident with the center of the distribution of red giants (Kopylov et al., 2008). The ratio of the sizes of the thick (the region of red giants) and thin (the region of young stars) disks is 2.8 and corresponds to the mean value for irregular galaxies (Tikhonov, 2005, 2006). However, since the number of young supergiants is small, VV 124 can be attributed to intermediate-type galaxies, between irregular and spheroidal ones (Irr/Sph).
SPECTROSCOPY
We measured the radial velocities of the two bright supergiants bl1 and bl2, the diffuse [O III] 5007 Å line emission, the total emission from unresolvable stars in VV 124, and the compact weak H II region. The positions of all the objects studied are shown in Fig. 5. The nebular diffuse [O III] emission was measured in regions and b on slit 2 and in region on slit 1. For a distance to the galaxy of 1.1 Mpc and a scale of 5.3 pc/, the sizes of the galactic regions where the radial velocities were measured are about 330 pc in projection onto the galaxy. The projected separation between bl1 and bl2 is 110 pc.
The spectra of bl1 and bl2 are presented in Fig. 6. The narrow lines in the spectra indicate that these stars are actually supergiants in VV 124. We estimated the temperatures of these stars by comparing their spectra with stellar atmosphere models from Munari et al. (2005)(http://archives.pd.astro.it/2500-10500/). The temperature and metallicity of bl2 were found to be K and [M/H], respectively. The temperature of bl1 is K. Only the hydrogen and He I lines are clearly seen in its spectrum, but weak metal lines are also noticeable. It can be concluded from the metal line intensities that the metallicity of this star is [M/H], i.e., it is nearly solar.
We found the magnitudes and colors for bl1 and bl2: and for bl1, and for bl2. Using the previously determined distance modulus for VV 124, we calculated the absolute magnitudes of bl1 and bl2: and , respectively. The luminosities of these stars indicate that they are actually bright supergiants.
The hydrogen (H, H and H) lines were measured in the spectra of bl1 and bl2, since these are the deepest lines that give the highest measurement accuracy. The radial velocities were measured by fitting a Gaussian into the hydrogen line cores. The radial velocities of bl1 and bl2 are km s-1 and km s-1, respectively. A fainter red stars is located near bl2 (Kopylov et al., 2008). The possibility that bl1 and bl2 have close neighbors cannot be ruled out, given the scale of 5.3 pc/. However, the close velocities of both stars indicate that the results of our measurements are correct. Note that (Kopylov et al., 2008), we provided slightly different velocities of bl1 and bl2, differing by 11 and 7 km s-1, respectively. These differences are within the limits of the measurement errors. We obtained the new velocities of the stars after reprocessing the spectra and refining the measurements by comparing the observed line profiles with those of model atmospheres for given temperatures.
The spectra of the galactic background produced by unresolvable stars were measured in regions a + b on slit 1 and in region b on slit 2 (Fig. 5). The spectrum of the compact H II region was masked when the spectra of these regions were measured, because the emission from this region distorted the hydrogen absorption lines. Since the most intense emission of the unresolvable stellar population in VV 124 comes from these regions (Fig. 5), we obtained fairly accurate radial velocity measurements for them. The spectra of unresolvable stars contain three deep hydrogen lines, yet the accuracy of measuring the radial velocity from these spectra is lower than that from the spectra of bl1 and bl2 due to the lower signal-to- noise ratio. We determined the mean radial velocity of the stars in these regions from three hydrogen lines, km s-1. The stellar H absorption line was distorted by the weak emission line from the diffuse emission of H II regions, which introduced an error into the radial velocity measurements. The diffuse H emission line observed in the spectra is redshifted (see below) relative to the absorption line of background stars. Note that not only in the central galactic region but also along the entire slit (the slit length is 5 or 1.5 kpc), the main lines in the spectrum are hydrogen ones. This means that the young stellar population, at least in the form of faint and unresolvable (in BTA images) stars, occupies larger volumes of the galaxy than the star-forming region or even the thin disk, whose sizes were estimated from the distribution of brighter stars.
There is a very weak diffuse emission in the [OIII]4959 and 5007 Å and H emission lines in regions a and b on slit 2 and in region a on slit 1 (Fig. 5). Only the intense [O III] 5007 Å line is measurable, while H is located in the broad absorption line of the stellar background. Figure 6 presents the spectrum taken in a 13-long segment of region b on slit 2 located from the western edge of region b (in such a way that the segment did not include bright stars) to the group of stars containing the compact H II region. Since this spectrum clearly shows a narrow [O III] line, accurate radial velocity measurements can be performed. The measured radial velocity of the [O III] line on slit 2 is km s-1 in region a and km s-1 in the segment of region b. The fluxes in the [O III] 5007 Å line from one square arcsec in these regions are and erg cm2 s-1. The radial velocity of the 5007 Å line on slit 1 in region a is km s-1 and the flux in this line from one km s-1 and the flux in this line from one square arcsec is erg cm-2s-1.
The estimated radial velocities strongly suggest that the diffuse H II region emitting an intense [O III] line belongs to VV 124. This region may be even more extended than the region of our measurements based on two slit positions. On slit 2, the [O III] emission begins slightly westward of bl2 and ends at several arcseconds from the compact H II region (Fig. 5). The total size of the diffuse [O III] region along slit 2 is 32 (170 pc). On slit 1, the [O III] emission is observed between bl1 and the compact H II region. The size of the [O III] region along slit 1 is 14 (75 pc). In the images of our long-slit spectra and on the diagrams of the [O III] line flux distribution along the slits, we clearly see that the [O III] emission is nonuniform both spatially and in radial velocities.
Our spectroscopic measurements of the faint and compact H II region (Fig. 5) emitting in the H line showed its size to be about 2–2.5 (11–13 pc) along slit 1 and no more than 1.7 (9 pc) along slit 2. A certain structure of this H II region is noticeable in the image of the long-slit spectrum on slit 1. It is highly likely that this compact H II region has a complex structure, both spatially and in radial velocities, but the quality of the spectra obtained is too low for it to be studied in more detail. Since this region is located amidst the bright background of stars and the H emission line lies in the deep absorption line of the stellar background, the measurements of its radial velocity are not very reliable. The radial velocity of this compact H II region is 36 km s-1 on slit 1 and 55 km s-1 on slit 2. There may be a systematic error in these measurements, because the profile of the H absorption line from the stellar background is asymmetric. Recall that the radial velocity of unresolvable stars in this galactic region is 70 km s-1.
Recently, VV 124 has been observed by Oosterloo (2010) in the 21-cm line (Westerbork Synthesis Radio Telescope). The galaxy turned out to be richin neutral hydrogen, with the region of its maximum emission being located near bl2. This region of maximum emission of the hydrogen cloud is elongated along the galaxy’s major axis. The entire H I cloud is fairly extended, its sizes (at the photometric limit of radio observations) are at least , and it goes far outside the galaxy’s optical body in the southeastern direction. The direction of the cloud elongation roughly coincides with the direction of the apparent distribution of bright young stars (almost along slit 2). The H I radial velocity in the region of maximum emission (near bl2) is 25 km s-1 with a dispersion of several km s-1, but in the southeastern part of the cloud the H I radial velocity reaches 50 km s-1. The total velocity range of the entire H I cloud is fairly wide, from 50 to 0 km s-1. It is highly likely that we observe the interaction of the H I cloud with VV 124 (Oosterloo , 2010) or, to be more precise, the neutral hydrogen cloud falls into the galaxy.
The fact that the extended and distant (from the galactic center) regions of the hydrogen cloud have a radial velocity of 50 km s-1 and the high total H I velocity dispersion confirm the results of our velocity measurements for the galactic body. The estimated parameters of the spatial stellar and gaseous structure of VV 124 make this galaxy an interesting object for more detailed studies.
Obviously, the H I cloud is located in the galaxy’s field of attraction. Either it was captured by VV 124 and, in this case, has a ,,primordial” origin or it is composed of the gas that was ejected from the galaxy in the past during a powerful starburst. The radial velocity of the galaxy determined from unresolved stars is 70 km s-1, while the brightest part of the H I cloud located near bl2 has a radial velocity of 25 km s-1. The H I cloud most likely interacts with the galaxy and the place of contact between the cloud and the galaxy is near bl2. Slow but extensive star formation that we observe in the form of young stars and vast H II regions illuminated by them arises at the place of contact. Note that the [O III] gas velocity dispersion is also high, from 47 to 71 km s-1, which appreciably exceeds the measurement errors.
The characteristic accretion time of the H I cloud onto the galaxy estimated as the mean size ( in projection) divided by the difference in the velocities of the distant parts of the cloud (50 km s-1 ) and the galactic body (70 km s-1 ) is yr. The mass of the central part of the galaxy 150 pc in radius (the distance from the center to the H I emission maximum) was roughly estimated from the difference of the H I velocities at the place of contact (25 km s-1 ) and the galactic body (70 km s-1) to be .
A distant emission-line galaxy fell by chance on slit 2 (Fig. 5). Its coordinates (2000.0) are: ′″. The galaxy’s spectrum exhibits an intense and narrow (FWHM Å) emission line at a wavelength (Fig. 6). This is most likely the [O II] 3727 line at redshift z = 0.375. At such z, the observed broad absorption line at a wavelength of Å can be interpreted as H, but this absorption line lies at the edge of our spectral range ( Å). In addition to the intense and narrow emission line, narrow but several times weaker emission lines, for example, at Å, are also observed, but their intensities are comparable to noise.
VV 124(UGC 4879) AND THE LOCAL GROUP
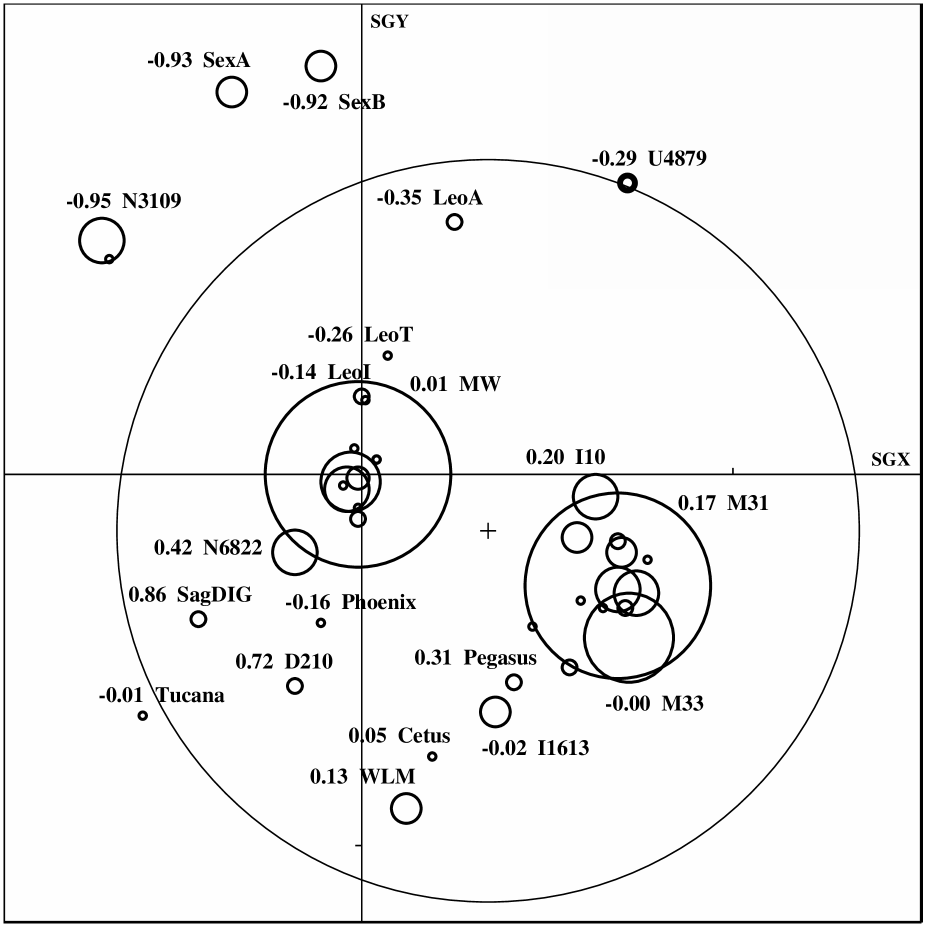
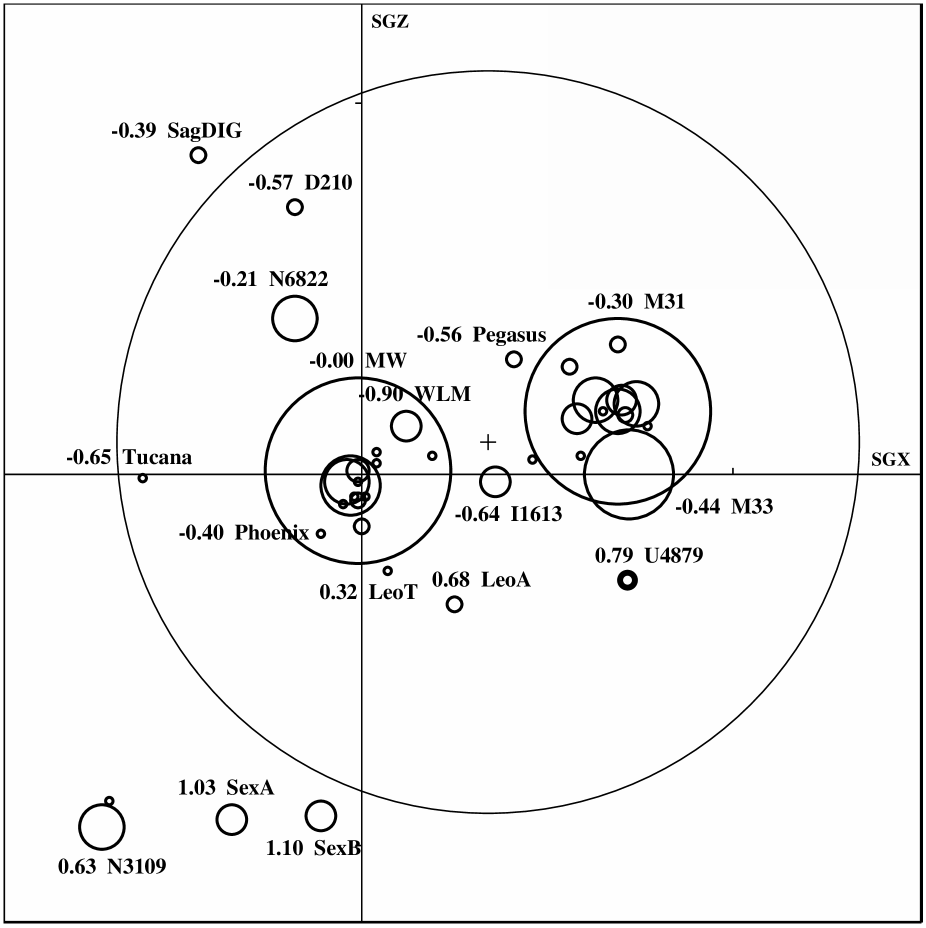
Figures 7 and 8 present the distributions of galaxies from the Local Group and its immediate neighborhoods in projection onto the Supergalactic plane and perpendicular to this plane. Whereas the galaxies VV 124 and LeoA in Fig. 7 seem to be located near the small NGC 3109 group, we see from Fig. 8 that VV 124 and Leo A lie in the flattened disk of Local Group galaxies, while the NGC 3109 group lies at a considerable distance from the disk. The velocity of VV 124 relative to the center of mass of the Local Group, which we take to be at an equal distance between 31 and our Galaxy, is km s-1. Clearly, at such a velocity, VV 124 has never approached massive Local Group galaxies and it may have entirely evolved without any strong gravitational interaction with massive galaxies. Such isolation of VV 124 makes the study of its star formation history particularly interesting, but this requires observations with space telescopes.
DISCUSSION AND CONCLUSIONS
In the history of the discovery of new Local Group galaxies, the times when bright Irr and Irr/Sph galaxies comparable in brightness to VV 24 were discovered have long been passed. Two such galaxies (DDO210 and PegDIG) were discovered 50 years ago (Van den Bergh , 2000) and one galaxy (SagDIG) was discovered 30 years ago (Cesarsky et al., 1977) before the appearance of the largest telescopes and digital sky surveys. To all appearances, VV 124 may be the last bright Irr/Sph galaxy discovered in the Local Group. This conclusion is based on the largescale studies of candidates for nearby galaxies con- ducted by (Whiting et al. , 2002, 2007). The results obtained indicate with 77% completeness that no more than one or two galaxies with sizes and surface brightnesses in the band can still be discovered in the Local Group.
Given the large sizes of VV 124 () and its high surface brightness, the conclusions of Whiting et al. (2007) may be considered to be unrelated to the probability of discovering such galaxies as VV 124. This galaxy was not discovered previously as a member of the Local Group due to chance coincidences of measurement errors (Kopylov et al., 2008) and it is unlikely that such a coincidence of errors will be repeated. The discovery of such a nearby galaxy is possible only in the Milky Way zone, because strong extinction makes the small galaxies located there almost invisible.
The area of the Milky Way at extinction 5 (corresponding to 2.4) accounts for about 10% of the entire celestial sphere. In lower-extinction regions, a nearby galaxy would have already been found. The Local Group galaxies form a fairly flat spatial structure (Pasetto & Chiosi, 2007) and the probability of discovering a new galaxy within this flat structure is considerably higher than that in other regions of the celestial sphere. Since the planes of the Milky Way and the Local Group do not coincide, this reduces the probability of a possible new nearby galaxy being located in the Milky Way plane. Thus, the presented data suggest that VV 124 can actually be the last bright Irr/Sph galaxy discovered in the Local Group.
Based on long-slit spectra, we measured the radial velocities of two supergiants in VV 124. The mean velocity estimated from these stars is km -1 and the separation between them in projection onto the galaxy is 110 pc. The velocities of individual supergiants can have a dispersion of about 10 km s-1 due to the random stellar motion; in addition, some of the stars may turn out to be binary, which can introduce an error in measuring the radial velocity. For these reasons, the galaxy’s velocity can be determined more reliably from the velocity of unresolvable stars and diffuse gas. The velocity of unresolvable stars in the galactic body measured from the combined spectrum of regions a + b on slit 1 (230 pc) and b on slit 2 (250 pc) is km s-1.
The intensity centroid of unresolvable stars in these regions (given the slit positions) lies virtually in the nuclear region, about 50 pc south of the galactic nucleus. The radial velocity of the gas with diffuse [O III] emission on slit 2 is km s-1; the region is localized in the western part at a distance of about 150 pc from the nucleus. The velocity of the [O III] emission closer to the nucleus on the same slit is km s-1. The radial velocity of the diffuse [O III] emission on slit 1 is km s-1 . The region of this emission is located at a distance of 100 pc southwest of the galactic center. Since the velocity dispersion of the H I cloud that interacts with the galaxy is significant (Oosterloo , 2010), we can understand the noticeable velocity dispersion of the [O III] gas, i.e., possibly the same H I gas but photoionized by young stars.
Analysis of our velocity measurements reveals no pattern related to the galactic rotation. Averaging the velocities of all the components we measured (individual stars, the unresolvable stellar background, and the [O III] gas emission) yields a mean velocity of 69 km s-1, in good agreement with the measured radial velocity of unresolvable stars. Based on these results, we conclude that the radial velocity of VV 124 is km s-1.
The location of the region of the brightest young stars in VV 124 does not coincide with the center of the galactic body (Kopylov et al., 2008). However, the region of young stars coincides with the brightest part of the H I cloud discovered by Oosterloo (2010). The symmetry axis of the brightest stars coincides in direction with that of the H I cloud. This asymmetry of young stars with respect to the galactic body, their symmetry with respect to the H I cloud, which probably falls into the galaxy, and the young stellar population in the central part of the galaxy (the dominance of hydrogen lines in the spectrum of unresolved stars) are indicative of recent star formation processes. The star formation may be caused by the interaction of the galaxy with H I clouds and, for this reason, we observe marked differences in the velocities of the photoionized [O III] gas exceeding appreciably the measurement errors in different parts of the galactic center (47, 54, and 71 km s-1). A detailed analysis of 21-cm radio H I observations (Oosterloo , 2010) will clarify the internal dynamics of VV 124.
ACKNOWLEDGMENTS
We wish to thank T. Oosterloo, who kindly provided the results of his 21-cm radio H I observations for VV 124 before their publication. We are also grateful to O.V. Mar’eva for help in reducing the spectroscopic data. This work was supported by the Russian Foundation for Basic Research (project nos. 09-02-00163 and 07-02-00909).
References
- Belokurov et al. (2006) Belokurov V., Zucker D.B., Evans N.W., Wilkinson M.I. et al., ApJ 647, L111 (2006)
- Bertelli et al. (1994) Bertelli G., Bressan A., Fagotto F. et al., A&AS 106, 137 (1994)
- Cesarsky et al. (1977) Cesarsky D.A., Lequeux J., Laustsen S., Schuster H.E., West R.M., A&A 61, L31 (1977)
- Holtzman et al. (2000) Holtzman J.A., Smith G.H. & Grillmair C., AJ 120, 3060 (2000)
- Irwin et al. (2007) Irwin M.J. Belokurov V., Evans N.W., Ryan-Weber E.V.et al., ApJ 656, L13 (2007)
- Kopylov et al. (2008) Kopylov A.I., Tikhonov N.A., Fabrika S., Drozdovsky I.O., Valeev A.F., MNRAS 387, L45 (2008)
- Landolt (1992) Landolt A.U., AJ 104, 340 (1992)
- Lee (1993) Lee M., Fridman W. & Madore B., ApJ 417, 553 (1993)
- McConnachie et al. (2008) McConnachie A.W., Huxor A., Martin N.F., Irwin M.J. et al., ApJ 668, 1009 (2008)
- Mateo (1998) Mateo M., Annu. Rev. Astron. Astrophys. 36, 435 (1998)
- Munari et al. (2005) Munari U., Sordo R., Castelli F. & Zwitter T., A&A 442, 1127 (2005)
- Oosterloo (2010) Oosterloo T., in press (2010)
- Pasetto & Chiosi (2007) Pasetto S., Chiosi C., A&A 463, 427 (2007)
- Stetson (1994) Stetson P., PASP 110, 1448 (1994)
- Tikhonov (2005) Tikhonov N. A., Astron. Rep. 49, 501 (2005)
- Tikhonov (2006) Tikhonov N. A., Astron. Rep. 50, 517 (2006)
- Van den Bergh (2000) Van den Bergh S. Publ. David Dunlap Observ. 2, 147 (1959).
- Van den Bergh (2000) Van den Bergh S., PASP 112, 529 (2000)
- Walsh et al. (2007) Walsh S.M., Jerjen H. & Willman B., ApJ 662, L83 (2007)
- Whiting (2005) Whiting A.B., ApJ 622, 217 (2005)
- Whiting et al. (2002) Whiting A.B., Hau G.K.T. & Irwin M.J., ApJS 141, 123 (2002)
- Whiting et al. (2007) Whiting A.B., Hau G.K.T., Irwin M.J. & Verdugo M., AJ 133, 715 (2007)
- Willman et al. (2005) Willman B., Dalcanton J.J., Martinez-Delgado D., West A.A. et al., ApJ 626, L85 (2005)
- Zucker et al. (2006) Zucker D.B., Belokurov V., Evans N.W., Wilkinson M.I. et al., ApJ 643, L103 (2006)
- Zucker et al. (2004) Zucker D.B., Kniazev A.Y., Bell E.F., Martinez-Delgado D. et al., ApJ, 612, L121 (2004)
- Zucker et al. (2007) Zucker D.B., Kniazev A.Y., Martinez-Delgado D., Bell E.F. et al., ApJ 659, L21 (2007)