Results of INTEGRAL TOO observation of the transient X-ray burster XTE J1810-189
Abstract:
We report results of the INTEGRAL Target of Opportunity observations of the transient X-ray burster XTE J1810-189. The observations were performed on April 3–6, 2008, soon after the discovery of the source and near the peak of its outburst. That time the source had a flux of about 50 mCrab and exhibited a hard Comptonized X-ray spectrum extending well above 100 keV. Being approximated by a power law with an exponetial cut-off in the broad 3–100 keV energy band it gave the average photon index and keV. We found only slight indications for changes in the index during the observation ( first steady decreased from to and then increased back to ). However the value measured by absorption in the low energy part of the spectrum changed drastically and very irregularly (from till cm-2). There were 10 type I X-ray bursts detected from the source during these TOO observations. Assuming that the Eddington luminosity was reached during the burst with the highest peak flux we get an upper estimate for a distance to the source kpc. From the X-ray burst parameters we conclude that this LMXB harboures an evolved star.
1 Introduction
The X-ray transient XTE J1810-189 was discovered in the spring of 2008 during RXTE/PCA monitoring scans of the Galactic ridge region [7]. A pointed observation started on March 10, at 21:05 UTC revealed a variable source (30% r.m.s. fluctuations). The emission spectrum was consistent with an absorbed power law (, photon index ). The PCA flux history suggested its gradual rise since March 5. The source was observed on March 12-15 with INTEGRAL that measured a slightly steeper spectrum in the hard keV IBIS/ISGRI energy band [9]. The observation of XTE J1810-189 on March 17, 2008 with the Swift/XRT telescope revealed the similar spectrum but the higher absorption indicating that there might be an internal source of absorption in the system [4]. In a pointed observation of the source on March 26, at 12:47 UTC the RXTE/PCA detected a type I X-ray burst identifying a compact object in the system as a neutron star. Assuming the Eddington peak luminosity, the upper limit for a distance to the source was obtained kpc [8].
In this paper we report the results of TOO (Target of Opportunity) observations of XTE J1810-189 performed with INTEGRAL on April 3-6, 2008.
2 Observations and data analysis
Based on the detection of the outburst from XTE J1810-189 in 2008 March and its rising X-ray brightness it was decided to perform a TOO observation of the source with INTEGRAL. All together there were 57 individual pointing observations (43 in revolution 668 and 14 in revolution 669), each lasting 1–1.5 hours. The total exposure during this TOO observation was over 203 ks.
The data set used in this research was obtained by the ISGRI (an upper detector of the IBIS telescope) and by the Module 1 of the JEM-X telescope aboard INTEGRAL. For detailed description of the IBIS/ISGRI and JEM-X telescopes see [10, 5] and [6] respectively.
Data reduction was performed using the OSA 7.0 software, distributed by the Integral Science Data Center (ISDC). In order to search for X-ray bursts we analyzed the JEM-X (3–20 keV) and IBIS/ISGRI (15–25 keV) detector light curves (count rate histories), using all the detector events, irrespective to their incidence directions. See [2] for more detailed description of the technique.
The spectral fitting was performed with Xspec package, version 11.3.1.
3 Results
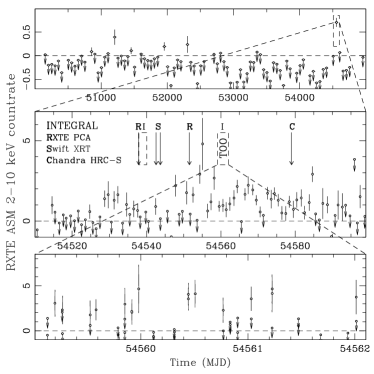
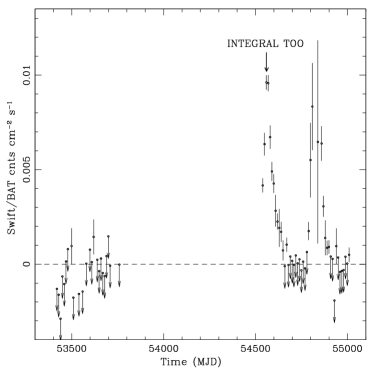
Fig. 1 (left) shows an extended ASM light curve of XTE J1810-189 observations (2–10 keV, top panel) note that 70 counts/s = 1 Crab . Each point of the top curve represents a 50 days averaged ASM count rate measured from XTE J1810-189. Here we omitted all the bins, containing less then 15 observing days (30% fill up). The middle panel shows the same light curve with better resolution (each point corresponds to a 1 day averaged ASM count rate) and includes some history of the XTE J1810-189 discovery and observations. Note that the light curve may be contaminated by X-ray bursts represented by single point excesses (e.g. 54585), while count rate excesses consisting of several points (e.g. 54560-54570 MJD) are most likely due to the XTE J1810-189 flaring activity. The bottom panel is a yet more detailed ASM light curve, corresponding exactly to the interval of the INTEGRAL TOO observations. Each point on this panel represents already the one-dwell ( s) averaged ASM count rate.
Fig. 1 (right) shows the Swift/BAT count rate history of XTE J1810-189 in the 15–50 keV energy band. Note, that in this energy band 1 = 4.6 Crab . An arrow marks the epoch of the INTEGRAL TOO observation. We can see that this INTEGRAL TOO observation took place during the peak of the source’s hard X-ray outburst (note, that the ASM light curve shows that it was carried out 10 days before the peak in the standard X-ray band). The SWIFT/BAT energy band is not affected by interstellar or system inner absorption, so the outburst is clearly seen. From this curve we can see, that the source recently underwent another outburst which started in December 2008 and continued on till January 2009 (–54880 MJD). The gap in the curve in the middle of this outburst and a comparatively poor statistics are due to the lack of the Swift/BAT data. The lack of observational data does not allow one to empirically determine whether such outbursts are regular or the observed one is a standalone. This outburst may as well be an evidence for the beginning of an activity period, like the one observed from KS1731-294 in 1989-2001 (see [2]).
3.1 Spectral analysis
In addition to the TOO observations, there were 229 science windows (SCWs) with XTE J1810-189 inside the IBIS FOV, but none with the source inside the JEM-X one. This let us examine the behavior of the source in the hard 20–100 keV energy band. Fig. 2 (left) shows the results of fitting IBIS/ISGRI spectra of the source by a power law model. Each point in the figure corresponds to 10 individual INTEGRAL observations (SCWs). The upper panel shows 20–100 keV flux from the source. The lower panel shows a power law index. Dashed boxes on each of the panels designate the INTEGRAL TOO observations. Although there are some variations in the spectral hardness during raising of the outburst, it shows no trend correlation with the hard X-ray flux. The spectrum remains Crab-like with an index most of the time.
During the 5 INTEGRAL revolutions ( 15 days) after the TOO observation the source was also often within the IBIS FOV (and again never in the JEM-X one) but it was mostly over off axis and less significant than 6–7 standard deviations, so we were not able to trace further evolution and decay of the outburst.

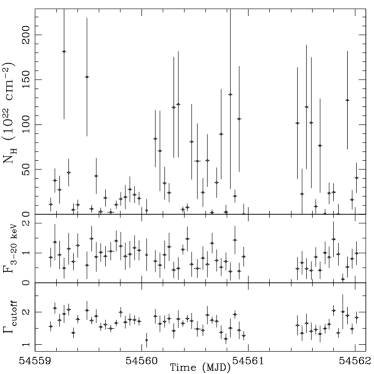
Fig. 2 (right) shows the results of fitting the broad band (3–100 keV) JEM-X+IBIS/ISGRI spectra to a cutoff power law model with interstellar absorption. Each point corresponds to one science window during the TOO observation. The upper panel shows a level of absorption in units of . The middle panel shows the 3-20 keV model flux from the source in units of . The lower panel shows power law index. The cutoff energy was fixed at its average value keV, obtained during fitting individual SCW spectra. The gap in the data is due to the INTEGRAL passing through Earth’s radiation belts. Note, that the power law index first gradually decreased from 2 to 1.3 and then came back to 2.0. The flux from the source in 20-100 keV did not vary with the 3-20 keV flux. This indicates that mass accretion rate or structure of inner accretion disk and area around boundary layer, where harder photons not affected by absorption are originated from, did not change. The cause of quasi-periodic variations of soft X-ray radiation (see Fig. 2 right) could be absorption in irregular structures at the outer edge of the accretion disk.
| Model | ||||
|---|---|---|---|---|
| keV | ||||
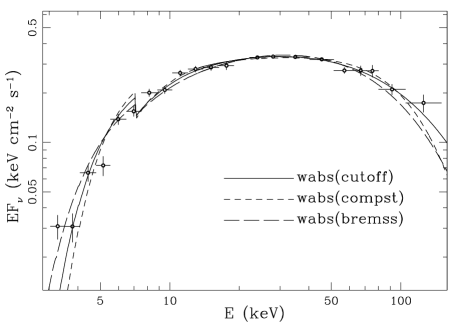
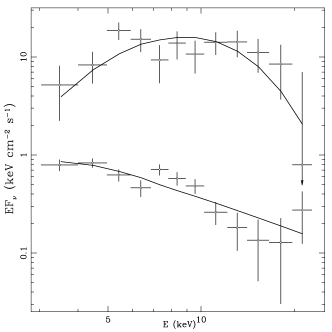
Fig. 3 (left) shows the average INTEGRAL TOO broad band (3–100 keV) combined JEM-X and IBIS/ISGRI spectrum of the source. JEM-X spectrum was renormalized during fitting by factor 1.25 (this factor was obtained from similar fitting of the Crab spectra). Tab. 1 shows the results of fitting this spectrum by several well known spectral models. Note that values of the reduced are quite high mostly due to JEM-X spectrum which is an average of many non uniform individual SCW spectra. Fig. 3 (right) shows the spectrum of the X-ray burst detected from XTE J1810-189 at 10:38:30 on Apr 4 (UTC) and its Black Body fit ( keV) (top) and spectrum of the XTE J1810-189 persistent emission during the whole 1 hour INTEGRAL pointing observation, containing the burst and its approximation by a power law with (bottom).
The analysis of combined JEM-X+IBIS/ISGRI spectra shows that the source had a rather hard spectrum during the whole TOO observation (at the peak of the outburst) which is expected at estimated 3-100 keV luminosity at the level 5-10% of Eddington. The only variation of the spectrum is due to varying absorption, presumably due to the presence of complex structure at the outer edge of the disk. Irregular as these variations seem to be, yet at least during the day 54560 (MJD) (see Fig.2 right) the 3-20 keV flux varies with a distinct 5-6 hours period. Note, that generally flux rises when drops. At the same time harder X-ray radiation remains constant, so we can not attribute the periodicity to dips caused by orbital eclipse.
3.2 X-ray bursts
When the accretion rate in the transient binary star rises during the outburst, one would naturally expect the type I X-ray burst rate to also rise, because generally it should take a shorter time to accumulate enough matter on the surface of the neutron star for a thermonuclear explosion to ignite. Considering the fact, that the TOO observation was performed during the peak of the flare, when the accretion rate is at maximum, we made an effort to search for type I X-ray bursts in JEM-X, as well as in IBIS data (many type I X-ray bursts are also well seen in harder X-rays, see [3]). We first analyzed detector light curves of 57 TOO individual observations. JEM-X data revealed 10 significant type I X-ray bursts from XTE J1810-189. All the bursts had 3-5 s rise and 10-15 s decay times. None of the observed bursts were strong enough to present an evidence of photospheric expansion witnessing of their Eddington luminosity. So we were only able to estimate an upper limit for the distance to the source using the (we assume the neutron star mass to be ) and the highest peak flux achieved (second burst on Apr 4): D= kpc. This improves a previous estimation: D kpc (see [8]).
We note that the stability of recurrence time from burst to burst is remarkable. The recurrence time is always within the limits of 5.3-6.1 hours. This shows that accreting conditions in the system were quite stable during TOO observations, which is expected at the top plateau of the outburst. Both comparatively high obtained values of (ratio of the gravitational energy released between the consequent bursts and the thermonuclear energy released during the burst - it is well over 40 which is expected for solar composition) and (accretion rate per surface area) are typical for pure He bursts (see [1]). But pure helium bursts should have recurrence times s which is about one day for solar composition - time needed for stable burning of hydrogen. Here is the mass fraction of CNO in accreted matter. The observed burst recurrence time in the system is 5-6 hours. That implies a hydrogen poor matter with and the donor to be an old evolved star.
Fig.2 (left) shows the rise of the outburst from XTE J1810-189. If we assume that the first several points represent the level of its persistent flux it is possible to predict the expected burst recurrence interval during the quiescent period, assuming the burst trigger conditions do not change: hours.
References
- [1] Bildsten L., 2000, COSMIC EXPLOSIONS: Tenth Astrophysics Conference. AIP Conference Proceedings, 522, 359-369
- [2] Chelovekov I.V., Grebenev S.A., Sunyaev R.A., 2006, Astron. Lett., 32, 456, arXiv:astro-ph/0605638
- [3] Chelovekov I.V., Grebenev S.A., Sunyaev R.A., 2007, ESASP, 622, 445, arXiv:0709.2328
- [4] Krimm H.A., Kennea J., Tueller J., 2008, ATel, 1432
- [5] Lebrun F., Leray J.P., Lavocat P. et al., 2003, A&A, 411, L141
- [6] Lund N., Budtz-Jorgensen, C., Westergaard N.J. et al., 2003, A&A, 411, L231
- [7] Markwardt C.B., Swank J.H., 2008, ATel, 1424
- [8] Markwardt C.B., Strohmayer T.E., Swank J.H., 2008, ATel, 1443
- [9] Neronov A., Beckmann V., Krimm H. et al., 2008, ATel, 1430
- [10] Ubertini P., Lebrun F., Di Cocco G. et al., 2003, A&A, 411, L131