Scaling Function and Nucleon Momentum Distribution
Abstract
Scaling studies of inclusive quasielastic electron scattering reactions have been used in the past as a basic tool to obtain information on the nucleon momentum distribution in nuclei. However, the connection between the scaling function, extracted from the analysis of cross section data, and the spectral function only exists assuming very restricted approximations. We revisit the basic expressions involved in scaling studies and how they can be linked to the nucleon momentum distribution. In particular, the analysis applied in the past to the so-called scaling region, i.e., negative values of the scaling variable , is extended here to positive , since a “universal” superscaling function has been extracted from the analysis of the separated longitudinal data. This leads to results that clearly differ from the ones based solely on the negative- scaling region, providing new information on how the energy and momentum are distributed in the spectral function.
I Introduction: basic aspects of scaling
Scaling studies of inclusive quasielastic (QE) electron-nucleus scattering have largely been considered to provide a powerful tool for extracting the momentum distribution of nucleons inside nuclei Day:1990mf ; Ciofi87 ; Ciofi89 ; Ciofi91 ; Ciofi92 ; Ciofi96 ; Ciofi99 . Such analyses have been applied to few-body systems, complex nuclei and nuclear matter with an important effort devoted to estimating binding corrections, and in particular, the high-momentum components of the nucleon momentum distribution which are governed by Short Range Correlations (SRC) Ji89 ; Ciofi09 . However, caution should be borne in mind for the conclusions reached, since a close relationship between the momentum distribution and the scaling function only emerges after some approximations are made. These are linked not only to the general description of the electron scattering reaction mechanism, but also to the integration limits involved and the behavior of the spectral function Day:1990mf .
The phenomenon of -scaling emerges from the analysis of QE reactions. The scaling function, defined as the QE differential cross section divided by an appropriate factor involving the single-nucleon cross section scaling88 ; Day:1990mf ; DS199 ; DS299 , is shown to depend only on a single variable, , given as a particular combination of the two independent variables in the process, namely the energy and momentum transfers, and . In the QE domain and for values of and large enough, the basic mechanism in reactions on nuclei corresponds to elastic scattering from individual nucleons in the nuclear medium with “quasi-free” ejection of a nucleon from the nuclear system. This implies that the inclusive cross section is mainly constructed from the exclusive process, including the contribution of all nucleons in the target and integrating over all (unobserved) ejected nucleon variables. In other words, QE scattering off a nucleus is simply described as an incoherent sum of single-nucleon scattering processes. This approach, which constitutes the basis of the Impulse Approximation (IA), although being an over-simplified description of reactions, has demonstrated its validity under appropriate kinematic conditions. Mechanisms beyond the IA (correlations, Meson Exchange Currents (MEC), re-scattering processes, etc.) may play a significant role in electron scattering, and hence may lead to non-negligible scaling violations.
The IA provides an intuitive explanation on how the scaling behavior emerges from the analysis of data. In this case the QE cross section is given by
| (1) |
where the sum extends to all nucleons in the target and refer to the scattered electron variables. The integration over the ejected (unobserved) nucleon variables has been expressed in terms of the residual nucleus’ excitation energy and the missing momentum . The significance of these variables as well as the kinematically allowed integration region denoted by will be discussed in detail in next section.
Within the IA the evaluation of cross sections for both proton and neutron knock-out determines the inclusive QE cross section. The study of exclusive reactions has been presented in previous work Udias ; highp ; Udias3 ; Fru84 ; Bof96 ; Kel96 focusing on different aspects of the problem: Final-State Interactions (FSI), relativity, correlations, etc. Although such ingredients have been proven to be essential in order to fit experimental cross sections, in what follows we restrict our attention to the Plane-Wave Impulse Approximation (PWIA), where the knocked-out nucleon has no interaction with the residual nucleus. Being the simplest approach to processes, PWIA retains important relativistic effects that are essential in describing reactions at high and . Moreover, the differential cross section in PWIA factorizes in two basic terms: the electron-nucleon cross section for a moving, off-shell nucleon and the spectral function that gives the combined probability to find a nucleon of certain momentum and energy in the nucleus Fru84 ; Bof96 ; Kel96 . In general we can write
| (2) |
with a kinematical factor Ras89 and where is the missing momentum and the excitation energy, essentially the missing energy minus the separation energy. It is important to point out that the factorization property shown in Eq. (2) no longer persists if dynamical relativistic effects in the bound nucleons are incorporated, i.e., effects from the lower components in the relativistic wave functions, even in the plane-wave limit Caballero-NPA ; Cris . Note that both the cross section and the spectral function depend on the two integration variables in Eq. (1), and . In order to show how the scaling function emerges from PWIA, further assumptions are needed. First the spectral function is assumed to be isospin independent, and second is assumed to have a very mild dependence on the missing momentum and excitation energy, which is supported by the most commonly used off-shell cross sections Day:1990mf . Hence the cross section can be evaluated at fixed values of and : typically the differential cross section for inclusive QE processes is written in the form
| (3) |
where the single-nucleon cross section is evaluated at the special kinematics (with the scaling variable; see the next section) and (the residual nucleus in its ground state). This corresponds to the lowest value of the missing momentum occurring when . The term refers to the azimuthal-angle-averaged single-nucleon cross section and it also incorporates the kinematical factor in Eq. (2) and the contribution of all nucleons in the target, i.e., .
The function in Eq. (3) is known as the scaling function and it is given in PWIA in terms of the spectral function:
| (4) |
A detailed study of the scaling function and its connection with the momentum distribution will be presented in next section. However, let us start by pointing out some general interesting features of this basic result. First, only in the case in which it would be possible to extend the kinematically allowed region to infinity in the excitation energy plane, i.e., , would the scaling function be directly linked to the true momentum distribution of the -nuclear system:
| (5) |
Second, guided by the PWIA result in Eq. (3), an experimental scaling function can be also defined by dividing the experimental QE cross section by the single-nucleon function, . At high enough values of the momentum transfer , the function has been shown to satisfy scaling in the region below the QE peak, that is, becomes only a function of the scaling variable (see Day:1990mf ; DS199 ; DS299 ; MDS02 for details). Note that Eq. (4) does not apply to which incorporates ingredients not included in the simple PWIA approach: FSI, MEC, re-scattering processes, etc. The contribution of these effects and their impact on the scaling phenomenon depend on the kinematical region explored, leading in particular to a significant scaling breaking in the region above the QE peak.
Furthermore, based on the analysis performed with the Relativistic Fermi Gas (RFG) model, and making use of the separate longitudinal () and transverse () data, experimental superscaling functions have been introduced:
| (6) | |||||
| (7) |
where is the Fermi momentum. In particular, the response is thought to have very little contribution from meson production and from meson-exchange currents and thus should be the place where the underlying nuclear dynamics can cleanly be resolved. It has been shown to superscale, i.e., the function shows only a very mild dependence upon the momentum transfer (first-kind scaling) and the nuclear system considered (second-kind scaling). This has led to introduce a universal experimental superscaling function that constitutes a strong constraint for any theoretical model describing QE electron scattering. Not only should the superscaling behavior be fulfilled, but also the specific shape of must be reproduced. This subject has been studied in detail in previous work showing the importance of FSI and relativity neutrino2 ; PRL05 ; jac06 ; Amaro07 ; jac_plb , and those studies clearly show that any conclusion about the momentum distribution based on Eq. (4) should be taken with caution. Being aware of this, it is illustrative, however, to analyze in detail the basic approaches on which the “link” between the momentum distribution and the scaling (superscaling) function is based. Moreover, the usual analysis restricted in the past to the region below the QE peak, is now extended to the region above the peak, since the superscaling function is defined for both negative and positive values of the scaling variable (see discussion in next section).
II The scaling function
As already shown, in PWIA the scaling function can be expressed as an integral of the spectral function in the plane (Eq. (4)), with the struck nucleon’s momentum and
| (8) |
the excitation energy of the recoiling system , with the ground-state mass of the residual nucleus and the general invariant mass of the daughter final state. The integration in Eq. (4) is extended to the kinematically allowed region in the plane at fixed values of the momentum and energy transfer, . This is represented by . The general kinematics corresponding to QE processes leads to the following -integration range Day:1990mf ; scaling88
| (9) |
where
| (10) |
and where is the target nuclear mass and the nucleon mass.
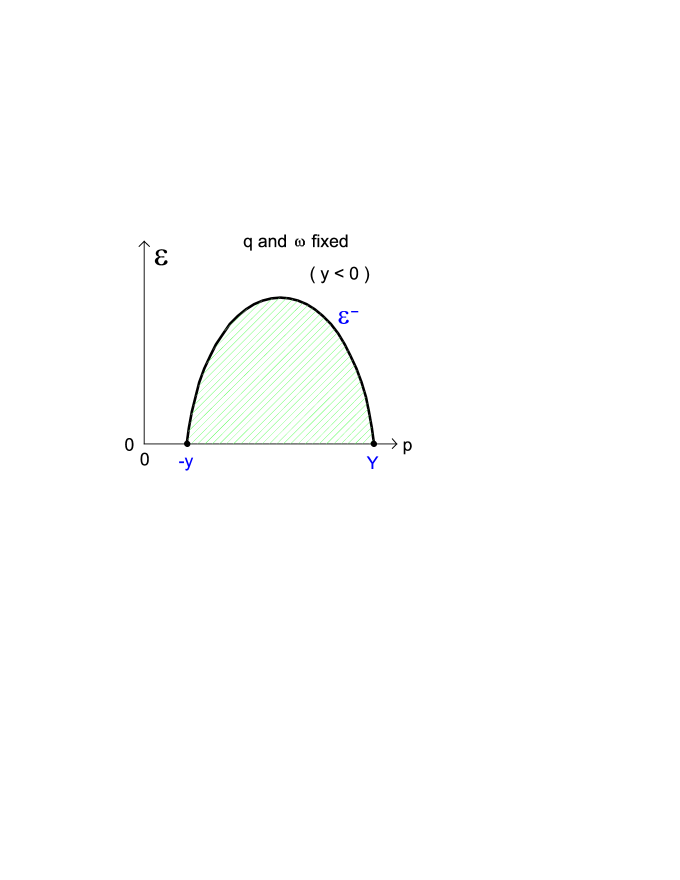
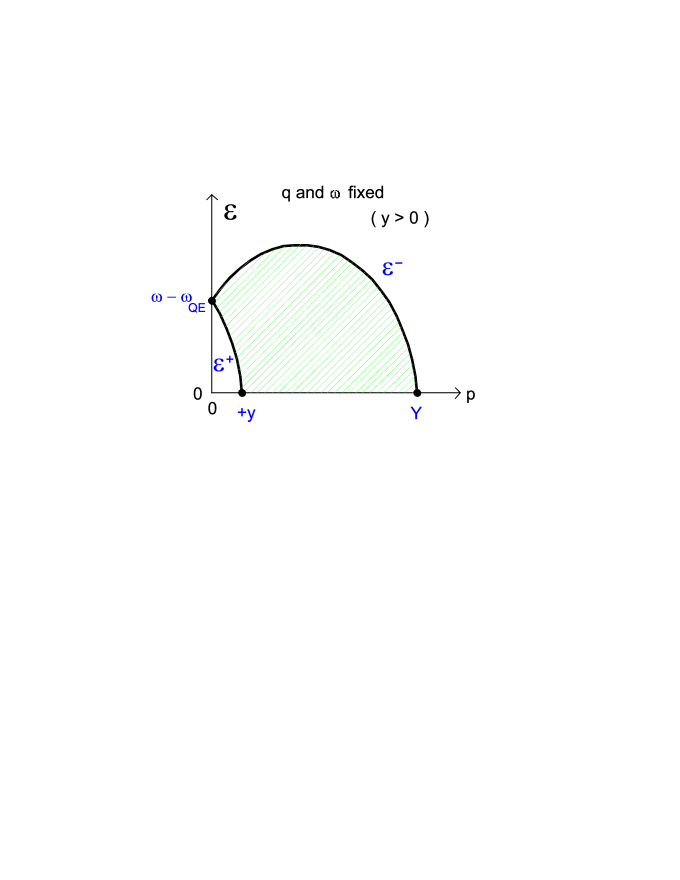
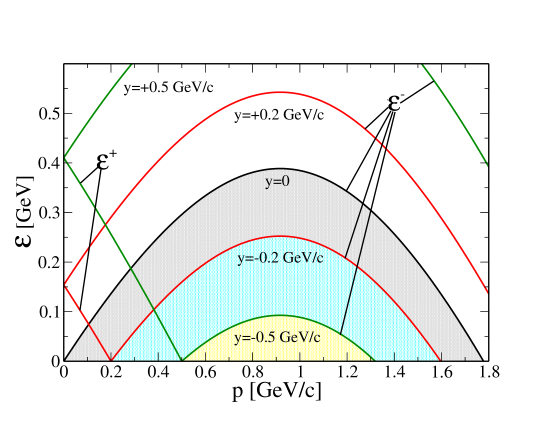
The intercepts between the curve and the -axis will be denoted by and , i.e., . The integration region is shown in Fig. 1 for fixed values of the transferred energy and momentum for (left-hand panel) and (right-hand panel), with the energy where the quasielastic peak (QEP) occurs. In the region below the QEP, is negative and represents the minimum value for the struck nucleon’s momentum. Above the QEP is positive and the curve cuts the integration region when .
In terms of the independent variables and the intercepts and are given by
| (11) | |||||
| (12) |
with the center of mass energy and . Then the scaling function in Eq. (4) can be recast as follows
| (13) | |||||
| (14) |
for negative and positive values of , respectively. The analysis presented in previous work has been restricted to the negative- region, i.e., below the QEP, since this is the region where cross section data fulfill -scaling properties. The function does not scale for positive values of because of the significant scaling violations introduced by effects beyond the IA, namely, inelastic processes and contributions from meson-exchange current. However, these contributions mostly reside in the purely transverse response and are negligible in the channel. The “universal” superscaling function extracted from the analysis of the separated data, and defined for both negative and positive values of the scaling variable, explains our interest in extending the study to the region above the QEP. This strategy, which forces us to employ the superscaling function to determine instead of the usual -scaling function , can lead to significant effects concerning the momentum and energy distribution in the spectral function, as discussed below.
In the above expressions we have chosen as independent variables. In terms of these we can also express the energy transfer
| (15) |
the limits of the excitation energy
| (16) |
and the upper limit of :
| (17) |
In the thermodynamic limit we get
| (18) | |||||
| (19) |
where we have introduced the nucleon energies . Moreover, notice that in the limit of very large momentum transfer, i.e., and , the above limiting values reduce to and .
Following previous arguments presented in Day:1990mf ; Ciofi91 , it is instructive to split the spectral function into two terms, corresponding to zero and finite excitation energy, respectively:
| (20) |
with , which, inserted in Eqs. (13,14) yields
| (21) | |||||
In order to analyze how the scaling function and the nucleon momentum distribution are connected, we proceed by evaluating the derivatives of the scaling function with respect to and . Making use of the Leibniz’s formula and choosing as the three remaining independent variables, after some algebra we finally get the following results:
II.1 Negative- region
| (23) | |||||
| (24) |
Making use of the limits in Eq. (16) and assuming the residual mass to be much larger than the momenta, , we simply have
| (25) |
Likewise, the derivatives of reduce to and .
Introducing these results in the general expressions in Eqs. (23,24), we get
| (26) | |||||
| (27) |
with and given in the thermodynamic limit by Eqs. (18) and (19). Note that the excited-state contribution in the spectral function, that is , is evaluated at energies along the curve .
For sufficiently large, , the upper limit can be safely taken to and, since , the expressions for the derivatives simplify to
| (28) | |||||
| (29) |
If we further assume that is small for large values of , so that the main contribution to the integral Eq. (29) comes from , then we get
| (30) |
namely scaling of the first kind (the scaling function loses its dependence upon ).
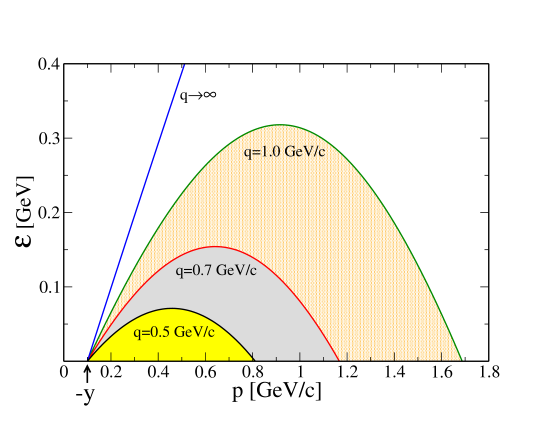
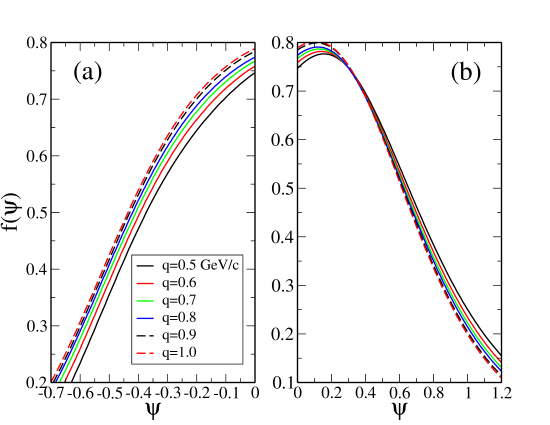
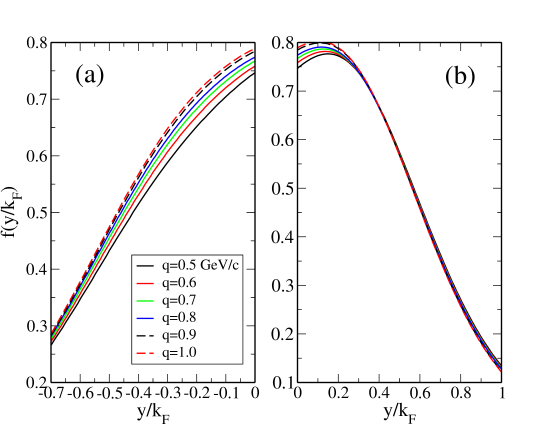
We also observe that, since at a fixed value of the integration region in Eq. (27) increases with and the integrand is a positive function, the asymptotic value is reached from below (i.e., monotonically increasing as a function of ) in any PWIA approach, in contrast with what experimental data seem to indicate DS199 ; DS299 ; MDS02 . This is clearly illustrated in Fig. 2 where the integration region is shown for different values of the momentum transfer at fixed , and it is also consistent with results shown in the left-hand panels (a) of Figs. 3 and 4. In Fig. 3 we present the superscaling function evaluated within the framework of the Relativistic Plane-Wave Impulse Approximation (RPWIA) (see PRL05 ; jac06 for details) for different -values and plotted against the superscaling variable in the negative- region (below the QEP). This variable is given by scaling88 ; DS299
| (31) |
where , and . The scaling variables and are closely connected DS299 :
| (32) |
where and, as noted above, the superscaling function is connected with via with the Fermi momentum. The curves in Fig. 3 may be compared with the RPWIA results for the superscaling function, now for negative and positive values of the dimensionless scaling variable obtained using the quadratic form of Eq. (32); see Fig. 4. As shown, at fixed (or ) the function increases with in accordance with the previous discussion. The basic results shown in Figs. 3 and 4 demonstrate that and can be used interchangeably as long as one does not focus on the few percent differences seen in the figures, namely, for large magnitudes of the scaling variables.
In showing the results we choose 12C as an illustrative example. Indeed this nucleus is relevant for many neutrino oscillation experiments, where superscaling ideas can be used to make reliable predictions of neutrino-nucleus cross sections Amaro:2004bs . Moreover, the analysis of the world data performed in DS199 points to an excellent superscaling in the so-called scaling region () for nuclei with . Note, however, that even the 4He data display a very good superscaling behavior for large negative values of the scaling variable (), while at the quasielastic peak there is a 10% violation due to the very different spectral function of the lightest nuclei.
II.2 Positive- region
In this case, as shown in Fig. 1 (right-hand panel), the integration region in the -plane is limited by the two curves, and , in the missing momentum region . This makes the derivative analysis somewhat more complicated. Moreover, the experimental data show that scaling arguments of the first kind do not apply to the function in this region, that is, does not become a function only dependent on the scaling variable . On the contrary, it shows a strong dependence upon the momentum transfer . As already mentioned, this is due to important contributions beyond the IA contained in the transverse channel. Therefore, although the analysis that follows is applied to , it should be clearly stated that only the use of the “universal” (namely longitudinal) superscaling function , and in particular, the study of its derivative with respect to the scaling variable in the positive- region, can reveal important effects not accounted for by the results obtained in the negative- scaling region.
After some algebra, the derivatives of the scaling function are given by
| (33) | |||||
| (34) | |||||
As in the previous case, from the general expressions for given in Eq. (16) and assuming the thermodynamic limit, we get
| (35) |
and the derivatives reduce to
| (36) | |||||
| (37) | |||||
Moreover, in the limit of the momentum transfer large enough, , so that the condition holds, the expressions of the derivatives result
| (38) | |||||
Notice that in the limit in which can be neglected compared with , that is, , the same comment applies to the ratio involved in the second integral in Eq. (LABEL:eq:dFdqposlim), since is limited within the range . Thus, in such a limiting case
| (40) |
and only the first integral in Eq. (LABEL:eq:dFdqposlim) survives. Furthermore, if the spectral function is such that we can neglect as compared with inside the integral, we again get scaling of the first kind: . This is strictly valid only for very large values of and it is entirely based on the approximations leading to the expression in Eq. (4) that connects the scaling function with the spectral function. As can be seen from Fig. 4 (panel (b), positive- region), the RPWIA scaling function shows a negligible dependence on the momentum transfer for (), whereas for larger scaling of the first kind begins to be slightly violated. The experimental scaling function extracted from the analysis of data at intermediate -values (less than or of the order of the nucleon mass) shows very important scaling violations in the region above the QEP (positive values of ).
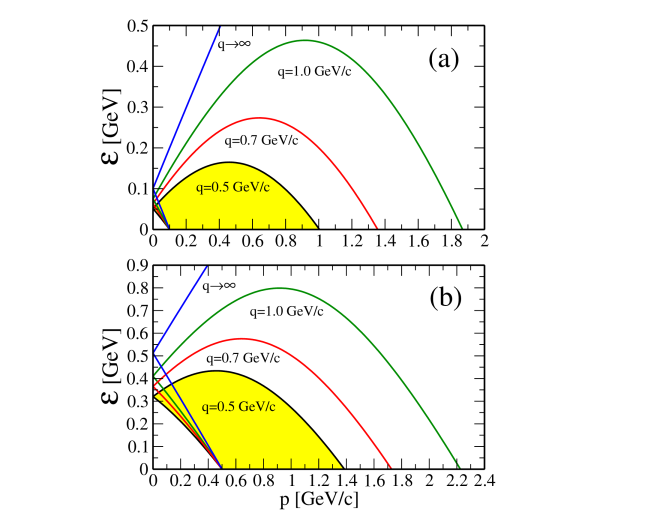
With regard to the dependence of the scaling function with at fixed , we get different behaviors for small and large values of . Indeed from Eq. (LABEL:eq:dFdqposlim) we observe that in the case of being very small (in the vicinity of zero), the second integral in Eq. (LABEL:eq:dFdqposlim) can be neglected. As the integrand in the remaining integral is positive, we get , i.e., the scaling function grows with . This behavior is in accordance with the one already shown in the negative- region. On the contrary, for increasing values of the first integral in Eq. (LABEL:eq:dFdqposlim) is expected to diminish significantly, since the excitation energy curve along which is evaluated lies much higher than (see Fig. 5), and it is reasonable to expect that gets its main contribution for values of the momentum and energy which are not too large. For large enough, only the second integral in Eq. (LABEL:eq:dFdqposlim) survives, and as its integrand is also positive, the minus sign in front of it leads to , that is, the scaling function decreases with , changing its behavior with respect to the previous cases. It is interesting to point out that this result is consistent with the integration regions shown in Fig. 5 where for increasing momentum transfer the curve moves to higher excitation energies in the plane. This means that as goes up regions at low values, where the spectral function mostly resides, are not kinematically accessible anymore. A similar argument can be applied to the case of very small values of (see panel (a) in Fig. 5). However, here the integration region lost as goes up with increasing is less important than the effects introduced by the growing integration region attached to . This general behavior is also in accordance with the RPWIA results for the superscaling function shown in the right-hand panel of Fig. 4 (positive values of ), or, alternatively, the right-hand panel of Fig. 3. One sees that increases with up to , i.e., ( GeV/c), ( GeV/c), ( GeV/c) with fm-1 the Fermi momentum. This corresponds to GeV/c, which is the situation represented in panel (a) of Fig. 5. Also note that the -dependence of in the region where seen in Fig. 4 is very weak. As observed by examining the two panels in Fig. 5, for large -values the energy curves lie very high, and hence, as increases, the integrals involved incorporate only additional contributions which are very small, leading to a very weak variation with momentum transfer.
III Nucleon Momentum Distribution and the Scaling Function
In the previous section we have derived general integro-differential equations connecting the derivatives of the scaling function, and , with the spectral function. Based on these results applied to both negative and positive values of , in what follows we revisit the “usual” procedure to obtain the nucleon momentum distribution function from the analysis of QE data. Since the kinematics of electron scattering lead to finite integration limits, we may not a priori draw any strong conclusions about the “true” momentum distribution given as , namely the integral of the spectral function up to infinite excitation energy. However, assuming the spectral function to reside mostly in the plane at values of and which are not too large, the previous analyses applied to negative- and positive- regions lead to different results, thus providing important and complementary information on how the energy and momentum are distributed within the spectral function.
The usual procedure considered in previous work Ciofi89 ; Ciofi91 in order to generate the nuclear momentum distribution from the scaling function has been based on the expression:
| (41) |
which has been widely applied in the negative- region. In what follows we extend this study to the positive- region based on the universal superscaling function introduced from the analysis of the separated longitudinal data.
Making use of the general expressions given by Eqs. (26,36) and assuming the limiting case , which is valid if the momentum transfer is sufficiently large, the momentum distribution functions can be written as follows:
| (42) | |||||
| (43) | |||||
As observed, both expressions receive contributions from the system ground state, , as well as from the excited states described through . Although using the same notation for the excitation energy , note that the -curves that enter in the spectral function in Eqs. (42) and (43) are very different (see Figs. 2,5).
Conclusions on the particular behavior of the previous expressions can only be drawn based on a specific model for the spectral function; however, it is illustrative to discuss some general, “model-independent”, properties. For negative the function in Eq. (42) exceeds the purely ground-state contribution, i.e., for all -values. This means that the contribution from the excited states adds to the ground-state momentum distribution. Concerning the specific role played by each one of the two terms in Eq. (42), it is difficult to draw stringent conclusions without having control over . As the momentum grows, the contribution of the integral in Eq. (42) is expected to diminish significantly ( mostly residing at momenta and excitation energies which are not too large). A similar comment applies also to the ground-state contribution that decreases as gets larger. The analysis of Eq. (43) in the positive- region differs because of the relative contributions provided by the two integrals linked to the excited states. In this case the global response can be smaller and/or larger than the purely ground-state contribution, , depending on the specific missing momentum value.
In what follows we discuss in detail some particular situations, thereby drawing some preliminary conclusions on the general behavior shown by . Let us start by considering the value of the nucleon momentum to be in the vicinity of zero. Thus, neglecting as compared with the momentum transfer and assuming , we can write:
| (44) | |||||
| (45) |
From these results the following relation (valid for small enough) occurs,
| (46) |
Moreover, from Eqs. (44,45) the ground-state contribution is roughly given as .
As the nucleon momentum grows, the two functions and in Eqs. (42, 43) get closer, crossing each other at some specific , such that for larger . From the integration region in the plane shown in Fig. 5, and assuming most of the strength in the spectral function to be located at not too high and , we can conclude that for intermediate-to-high missing momentum values the main contribution in comes from the second integral in Eq. (43), that is, .
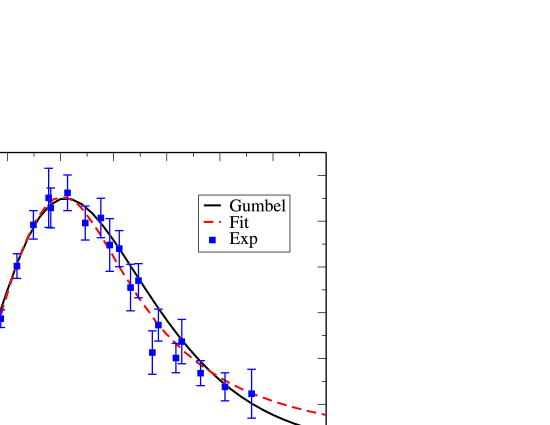
To prove these general properties, in what follows we present results based on the derivative analysis making use of the superscaling function . In order to simplify the calculations we represent by means of the Gumbel probability density function (i.e., the derivative of the Gumbel distribution):
| (47) |
In our case the values of the parameters are and (). In Fig. 6 we compare the Gumbel distribution [Eq. (47)] with and a fit of the experimental data MDS02 . As shown, the Gumbel distribution nicely fits the data. Moreover, it fulfills the unitarity condition . The nucleon momentum distribution is evaluated through the derivative of the scaling function by using Eq. (41) and recalling that , thus getting
| (48) |
that, using the approximate relation , can be presented in the form
| (49) |
Note that if the superscaling function is not symmetric with respect to , as is the case for the experimental data, the above expression yields different momentum distributions for negative and positive values of , which will be denoted by and , respectively. On the contrary symmetric scaling functions, like the RFG one, lead to .
In the case of the Gumbel distribution we get (setting ):
| (50) |
which leads to
| (51) | |||||
| (52) |
In Fig. 7 we present the results for (solid line) and (dashed line) with and given in Eqs. (51,52) (at fm-1). As expected, and (and and , respectively) coincide in the limiting case :
| (53) |
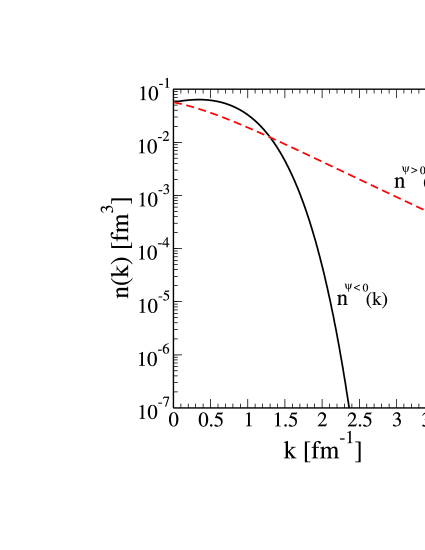
For missing momenta up to fm-1 the main contribution resides in that is in accordance with Eq. (46) and the general discussion presented above. At fm-1, i.e., close to the Fermi momentum, and cross each other, with being much higher for larger -values. In fact, whereas shows a steep slope when increases, which is in accordance with results based on independent-particle model descriptions, presents a high momentum tail very far from and hence from shell-model results (see next section). As already explained above, this tail at intermediate-to-high is linked to the much larger contribution given by the spectral function when evaluated along the curve instead of . This general behavior is illustrated in Fig. 8 where the contour curves corresponding to positive- and negative- values are presented. The presence of the tail at high momentum values in the nucleon momentum distribution is a clear signature of the importance of nucleon-nucleon correlations. Since the spectral function maps very different regions in the plane for negative and positive (Fig. 8), the joint analysis of the two kinematical regions can provide important clues in the knowledge of NN correlations. It should be pointed out that the functions and evaluated through Eq. (49) and presented in Fig. 7 are normalized to different values connected with the different areas subtended by the Gumbel distribution function at negative and positive , i.e., 0.37 (for ) and 0.63 ().
In particular, it has been shown in PRL05 ; Amaro07 in the framework of relativistic nuclear models that the large positive- tail of the scaling function is closely related to final-state interactions, while the negative- region is more affected by initial-state correlations, as will be also shown in the next Section in the CDFM model. The possibility of connecting different aspects of the momentum distribution to initial- and final-state physics will be further explored in future work.
IV Nucleon momentum distribution within the Coherent Density Fluctuation Model
In this section we give, as an example, the results for the nucleon momentum distribution extracted from the scaling function, obtained within the framework of a particular nuclear model, namely the Coherent Density Fluctuation Model (CDFM) ant01 ; ant02 . The latter is a natural extension to finite nuclei of the relativistic Fermi gas (RFG) model within which the scaling variables was introduced111The scaling variable differs from by a phenomenological energy shift MeV (for 12C) introduced in order to reproduce the experimental position of the quasielastic peak: .. The CDFM is based on the generator coordinate method ant03 and includes long-range NN correlations (LRC) of collective type. In ant04 ; ant05 the scaling function was defined within the CDFM using the RFG scaling function scaling88 ; ant11 ; ant12 ; ant13 and applied it to various processes ant04 ; ant05 ; ant06 ; ant07 ; ant08 ; ant09 .
In the CDFM model ant01 ; ant02 , the one-body density matrix is an infinite superposition of one-body density matrices corresponding to single Slater determinant wave functions of systems of free nucleons homogeneously distributed in a sphere with radius , density , and Fermi momentum (with ):
| (54) |
The weight function can be expressed in an equivalent way either by means of the density distribution ant01 ; ant02 ; ant05 ,
| (55) |
or by the nucleon momentum distribution ant05 ,
| (56) |
| (57) |
In the version of the CDFM approach suggested in ant04 ; ant05 , the scaling function has the form
| (58) |
where the RFG scaling function is
| (59) |
In the CDFM the Fermi momentum is calculated for each nucleus by
| (60) |
and is not a fitting parameter, as it is in the RFG model.
By using Eqs. (55) and (56) in Eqs. (58) and (60), the CDFM scaling function and can be expressed equivalently by the density and momentum distributions ant05 :
| (61) |
where is given by Eq. (59), and
| (62) |
where
| (63) |
Eq. (62) is valid under the condition
| (64) |
¿From Eq. (62) one can estimate the possibility to obtain information about the nucleon momentum distribution from the empirical data for the scaling function. If we keep only the main term of the RFG scaling function from Eq. (63):
| (65) |
and its derivative
| (66) |
then
| (67) |
In Eq. (67)
| (68) |
Using Eq. (67), can be found by solving the integral-differential equation:
| (69) |
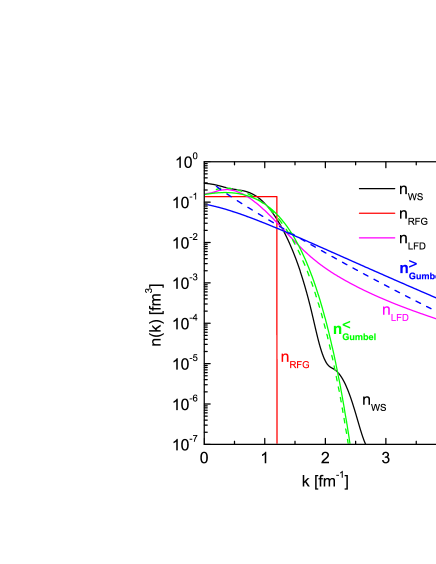
In this work we solve the above equation from CDFM using the experimentally obtained scaling function. The latter can be represented the Gumbel probability density function in Eq. (47). The results for the nucleon momentum distribution obtained in this way are given in Fig. 9 by dashed lines in both cases: for (green dashed line) and for (blue dashed line). They are compared with the results obtained using the expression for through the derivative of the scaling function, Eq. (49).
The momentum distributions and obtained by using Eq. (49) and the experimental scaling function presented by Eq. (47) are given in Fig. 9 by solid lines. For a comparison we present in the same figure the momentum distributions from the RFG model (), the shell-model results (using Woods-Saxon single-particle wave functions) for 56Fe (), as well as the momentum distribution () obtained within the Light-Front Dynamics (LFD) approach ant14 (see also ant05 and the late modification of the approach in ant07 ). The latter is based on the nucleon momentum distribution in the deuteron (including its high-momentum component) from the LFD method (e.g., ant15 ; ant16 and references therein). In the calculations fm-1. In Fig. 9 all nucleon momentum distributions are normalized to unity [Eq. (68)].
V Conclusions
In the present work a study of the scaling function and its connection with the momentum distribution is presented. As is well known, a close relationship between the two quantities exists using the PWIA and under some conditions for the kinematically allowed region (), once one has accounted for the roles of FSI, MEC, rescattering processes, etc. Here these restricted approximations are considered in detail. The “usual” analyses performed in the past to the region below the QE peak is extended to the region above the peak, since the superscaling function is defined for both negative and positive values of the scaling variable. This is justified, since a “universal” superscaling function has been extracted from the analysis of the separated longitudinal data. The explicit expressions for the derivatives and for both negative- and positive- regions are derived and their dependences on and are analyzed.
The general integro-differential equations connecting the derivatives and with the spectral function are derived. The results obtained allow us to revisit the “usual” procedure to obtain the nucleon momentum distribution from the analyses of the QE scattering data. The considerations in the present work lead to results that are quite different from those obtained solely in the negative- scaling region and give information about the energy and momentum distribution in the spectral function. It is shown that the expressions for the nucleon momentum distributions and have contributions from the momentum distribution of the ground state of the system with nucleons, as well as from the part of the spectral function that contains information about the excited states. It is shown that for small momenta : , while as grows the two functions and get closer, crossing each other at some value of and yielding for higher .
The general properties of the momentum distribution established in the present work are validated by the results obtained from the derivative analysis using the superscaling function represented by the parameterized Gumbel probability density function that provides a good fit to the experimental longitudinal scaling function . It is concluded that the high-momentum tail of the momentum distribution is a clear signature for the important effects stemming from nucleon-nucleon correlations.
The general properties of the nucleon momentum distribution obtained are also illustrated using the scaling function obtained in the framework of a particular nuclear model, namely the Coherent Density Fluctuation Model (CDFM) that includes collective long-range NN correlations. It is shown that the momentum distribution in the CDFM has the properties already pointed out in the general consideration.
Acknowledgements
This work was partially supported by DGI (MICINN-Spain) contract FIS2008-04189, PCI2006-A7-0548, the Spanish Consolider-Ingenio programme CPAN (CSD2007-00042), by the Junta de Andalucía, and by the INFN-CICYT collaboration agreements INFN08-20 & FPA2008-03770-E/INFN, as well as by the Bulgarian National Science Fund under contracts nos DO–02–285 and DID–02/16–17.12.2009. M.V.I. acknowledges support from the European Operational programm HRD through contract BGO051PO001/07/3.3-02/53 with the Bulgarian Ministry of Education. This work is also supported in part (T.W.D.) by the U.S. Department of Energy under cooperative agreement DE-FC02-94ER40818.
References
- (1) D. B. Day, J. S. McCarthy, T. W. Donnelly and I. Sick, Ann. Rev. Nucl. Part. Sci. 40, 357 (1990).
- (2) C. Ciofi degli Atti, E. Pace, and G. Salmè, Phys. Rev. C 36, 1208 (1987).
- (3) C. Ciofi degli Atti, E. Pace, G. Salmé, Phys. Rev. C39, 259 (1989)
- (4) C. Ciofi degli Atti, E. Pace, G. Salmé, Phys. Rev. C43, 1155 (1991)
- (5) C. Ciofi degli Atti, D.B. Day, S. Liuti, Phys. Rev. C46, 1045 (1992)
- (6) C. Ciofi degli Atti and S. Simula, Phys. Rev. C 53, 1689 (1996)
- (7) C. Ciofi degli Atti and G. B. West, Phys. Lett. B 458, 447 (1999).
- (8) X. Ji, J. Engel, Phys. Rev. C40, R497 (1989).
- (9) Ciofi degli Atti, C.B. Mezzetti, Phys. Rev. C79, 051302 (2009).
- (10) W.M. Alberico, A. Molinari, T.W. Donnelly, E.L. Kronenberg and J.W. Van Orden, Phys. Rev. C 38, 1801 (1988).
- (11) T.W. Donnelly and I. Sick, Phys. Rev. Lett. 82, 3212 (1999).
- (12) T.W. Donnelly and I. Sick, Phys. Rev. C 60, 065502 (1999).
- (13) J.M. Udías, P. Sarriguren, E. Moya de Guerra, E. Garrido and J.A. Caballero, Phys. Rev. C 48, 2731 (1993); C 51, 3246 (1995).
- (14) J.M. Udías, P. Sarriguren, E. Moya de Guerra and J.A. Caballero, Phys. Rev. C 53, R1488 (1996).
- (15) J.M. Udías, J.A. Caballero, E. Moya de Guerra, J.R. Vignote and A. Escuderos, Phys. Rev. C 64, 024614 (2001).
- (16) S. Frullani and J. Mougey, Adv. Nucl. Phys. 14, 1 (1984).
- (17) S. Boffi, C. Giusti, F.D. Pacati, M. Radici, Phys. Rep. 226, 1 (1993); Electromagnetic Response of Atomic Nuclei (Oxford University Press, Oxford, 1996).
- (18) J.J. Kelly, Adv. Nucl. Phys. 23, 75 (1996).
- (19) A.S. Raskin, T.W. Donnelly, Ann. of Phys. 191, 78 (1989).
- (20) J.A. Caballero, T. W. Donnelly, E. Moya de Guerra and J.M. Udías, Nucl. Phys. A 643, 189 (1998); A 632, 323 (1998).
- (21) M.C. Martínez, J.A. Caballero, T.W. Donnelly, Nucl. Phys. A 707, 83 (2002) and refs. therein.
- (22) C. Maieron, T.W. Donnelly and I. Sick, Phys. Rev. C 65, 025502 (2002).
- (23) J.E. Amaro, M.B. Barbaro, J.A. Caballero, T.W. Donnelly and C. Maieron, Phys. Rev. C 71, 065501 (2005).
- (24) J.A. Caballero, J.E. Amaro, M.B. Barbaro, T.W. Donnelly, C. Maieron and J.M. Udías, Phys. Rev. Lett. 95, 252502 (2005).
- (25) J.A. Caballero, Phys. Rev. C 74, 054603 (2006).
- (26) J.E. Amaro, M.B. Barbaro, J.A. Caballero, T.W. Donnelly, J.M. Udías, Phys. Rev. C 75, 034613 (2007).
- (27) J.A. Caballero, J.E. Amaro, M.B. Barbaro, T.W. Donnelly, J.M. Udías, Phys. Lett. B 653, 366 (2007).
- (28) J.E. Amaro, M.B. Barbaro, J.A. Caballero, T.W. Donnelly, A. Molinari and I. Sick, Phys. Rev. C71 (2005) 015501.
- (29) A. N. Antonov, V. A. Nikolaev, and I. Zh. Petkov, Bulg. J. Phys. 6, 151 (1979); Z. Phys. A 297, 257 (1980); ibid. 304, 239 (1982); Nuovo Cimento A 86, 23 (1985); Nuovo Cimento A 102, 1701 (1989); A. N. Antonov, D. N. Kadrev, and P. E. Hodgson, Phys. Rev. C 50, 164 (1994).
- (30) A. N. Antonov, P. E. Hodgson, and I. Zh. Petkov, Nucleon Momentum and Density Distributions in Nuclei (Clarendon Press, Oxford, 1988); Nucleon Correlations in Nuclei (Springer-Verlag, Berlin-Heidelberg-New York, 1993).
- (31) J. J. Griffin and J. A. Wheeler, Phys. Rev. 108, 311 (1957).
- (32) A. N. Antonov, M. K. Gaidarov, D. N. Kadrev, M. V. Ivanov, E. Moya de Guerra, and J. M. Udias, Phys. Rev. C 69, 044321 (2004).
- (33) A. N. Antonov, M. K. Gaidarov, M. V. Ivanov, D. N. Kadrev, E. Moya de Guerra, P. Sarriguren, and J. M. Udias, Phys. Rev. C 71, 014317 (2005).
- (34) M. B. Barbaro, R. Cenni, A. De Pace, T. W. Donnelly, and A. Molinari, Nucl. Phys. A 643, 137 (1998).
- (35) T. W. Donnelly and I. Sick, Phys. Rev. Lett. 82, 3212 (1999).
- (36) T. W. Donnelly and I. Sick, Phys. Rev. C 60, 065502 (1999).
- (37) A. N. Antonov, M. V. Ivanov, M. K. Gaidarov, E. Moya de Guerra, P. Sarriguren, and J. M. Udias, Phys. Rev. C 73, 047302 (2006).
- (38) A. N. Antonov, M. V. Ivanov, M. K. Gaidarov, E. Moya de Guerra, J. A. Caballero, M. B. Barbaro, J. M. Udias, and P. Sarriguren, Phys. Rev. C 74, 054603 (2006).
- (39) M. V. Ivanov, M. B. Barbaro, J. A. Caballero, A. N. Antonov, E. Moya de Guerra, and M. K. Gaidarov, Phys. Rev. C 77, 034612 (2008).
- (40) A. N. Antonov, M. V. Ivanov, M. B. Barbaro, J. A. Caballero, and E. Moya de Guerra, Phys. Rev. C 79, 044602 (2009).
- (41) A.N. Antonov, M.K. Gaidarov, M.V. Ivanov, D.N. Kadrev, G.Z. Krumova, P.E. Hodgson, H.V. von Geramb, Phys. Rev. C 65, 024306 (2002).
- (42) J. Carbonell and V. A. Karmanov, Nucl. Phys. A581, 625 (1995).
- (43) J. Carbonell, B. Desplanques, V. A. Karmanov, and J.-F. Mathiot, Phys. Rep. 300, 215 (1998).