Precise determination of muon and electromagnetic shower contents from shower universality property
Abstract
We consider two new aspects of Extensive Air Shower (EAS) development universality allowing to make accurate estimation of muon and electromagnetic (EM) shower contents in two independent ways. In the first case, to get muon (or EM) signal in water Cherenkov tanks or in scintillator detectors, it is enough to know the vertical depth of shower maximum and the total signal in the ground detector. In the second case, the EM signal can be calculated from the primary particle energy and the zenith angle. In both cases the parametrizations of muon and EM signals are almost independent on primary particle nature, energy and zenith angle. Implications of the considered properties for mass composition and hadronic interaction studies are briefly discussed.
The present study is performed on 28000 of proton, oxygen and iron showers, generated with CORSIKA 6.735 for spectrum in the energy range and uniformly distributed in in zenith angle interval for QGSJET II/Fluka interaction models.
pacs:
95.55.Vj, 95.85.Ry, 96.50.sd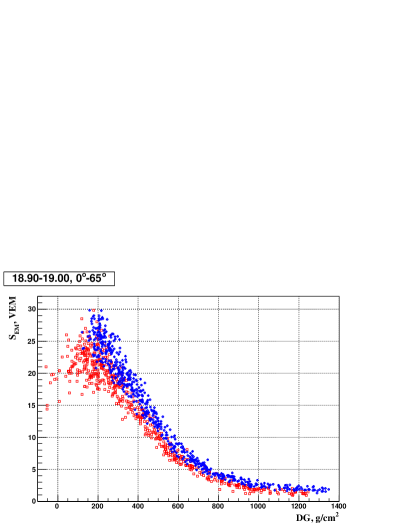

Introduction
Mass composition of ultra-high-energy cosmic rays (UHECR) can be studied only indirectly with large EAS arrays. The contemporary measurement of longitudinal and lateral shower characteristics in hybrid experiments Abu-Zayyad et al. (2001); Abraham et al. (2004); Kawai et al. (2008) provides the possibility to combine several primary mass sensitive EAS parameters (such as depth of shower maximum and muon shower content) to achieve the best primary particle mass discrimination. Unfortunately, the lack of reliable information on hadronic interaction properties at these energies causes large uncertainties in the simulations of EAS characteristics and in turn brings large uncertainties in mass composition analysis results (see e.g. recent review Bluemer et al. (2009)). For most of the interaction models the same experimental data show a lighter composition from and a heavier (generally with mass above iron) composition from muon shower content Abu-Zayyad et al. (2000); Engel (2007); Schmidt et al. (2008); Abraham et al. (2009). Recently proposed interaction model EPOS Werner et al. (2006); Pierog and Werner (2009) seems to be the first model providing quite consistent description of longitudinal and lateral EAS profiles due to increased muon production Pierog and Werner (2008). EPOS application to Hires-MIA data favors lightening of primary composition for energies above eV well in agreement with Hires recent results soc ; Abbasi et al. (2009) (but compare with Yakutsk conclusions on mixed composition obtained with EPOS 1.60 for energies above eV Glushkov et al. (2008)) and can partly help to reduce the 25% discrepancy between Auger fluorescence and surface detectors energy scales Pierog and Werner (2008). Nevertheless, this model has still to be thoroughly tested against various EAS data in the wide energy range and, what’s more, for energies , which are well beyond the accelerators reach, there is no way to judge if current EPOS (or any other model) properties correspond to actual nature of hadronic interactions. The difference between the various predictions of modern interaction models does not necessary cover all possible range of accelerator data extrapolations (see e.g. Bleve et al. (2009)) which is so wide that allows even to treat strong indications on primary mass increase for eV, which can be derived from Auger data on and RMS of distribution soc , within pure primary proton flux hypothesis by modification of the total cross section or by introduction of strong Feynman scaling violation Alvarez-Muniz et al. (2008); Wibig (2009a, b); Ulrich et al. (2009). Constraining of such interaction parameters freedom is crucial for resolving of UHECR mass composition problem, but it seems to be hardly achievable on the basis of EAS studies alone and the data from the started LHC are considered of fundamental importance.
In this paper, using universality property of EAS development Giller et al. (2005); Nerling et al. (2006); Gora et al. (2006); Schmidt et al. (2007); Lipari (2009); Lafebre et al. (2009), we propose two simple, independent and accurate methods to determine muon and EM shower contents and briefly discuss a possible way to test and adjust interaction models in a primary mass independent way. We also hope that the proposed EAS-universality-based correction of the interaction models will allow to perform mass composition analysis with the use muon EAS content in less interaction model dependent manner.
The present study is performed making use of 28000 showers, generated with CORSIKA 6.735 Heck et al. (1998) for spectrum (and then weighted to spectrum) in the energy range (with statistics of around 3000 showers for each primary in every of 3 energy bins , and ) and uniformly distributed in in zenith angle interval for QGSJET II Ostapchenko (2006a, b, c)/Fluka Battistoni et al. (2007); Ferrari et al. interaction models. The smaller set of around 10000 showers generated with EPOS 1.99/Fluka was also used for verification of the presented universality properties. EM component thinning was set to , the observation level was at 870 g/cm2, geomagnetic field was set to Malarge Auger site value. All longitudinal shower characteristics and charged particles density , which is effectively measured by detectors using scintillators Nagano et al. (2000), were taken directly from CORSIKA particle output files. The expected signal in Cherenkov Auger-like tanks was calculated according to the sampling procedure described in Billoir (2008); Schmidt et al. (2008) with the use of the same GEANT 4 lookup tables as in Schmidt et al. (2008). Differently from Schmidt et al. (2008) in this work the muon signal includes only signal from muons crossing the Cherenkov tank, while signal from EM particles, originating from muon decays, is included in the EM signal.
I Showers at the same vertical depth of maximum
Of all aspects of universality of shower development we will be interested only in EM and muon signals dependence on the distance of shower maximum to the ground and on the zenith angle. Let’s start from Auger-like experimental setup and consider signal in water Cherenkov tanks at 1000 meters from the shower core. In this case the common way to express the universality of EM signal is to plot it against slant distance to the ground (Fig. 1 and also Fig. 1 in Schmidt et al. (2007)), showing its quasi-independence from the nature of the primary particle. The muon signal functional dependence on slant distance to the ground is also very similar for both proton and iron, but there is a shift in the normalization (Fig. 1). Let us note, that since iron showers reach earlier than showers from protons, comparison of set of showers from p and Fe at equal means comparison between showers with different zenith angles, but at the same development stage. Below, in this and in the next sections, we will consider other two possible geometrical situations: showers having the maximum at the same vertical depth and showers arriving at the same zenith angles.
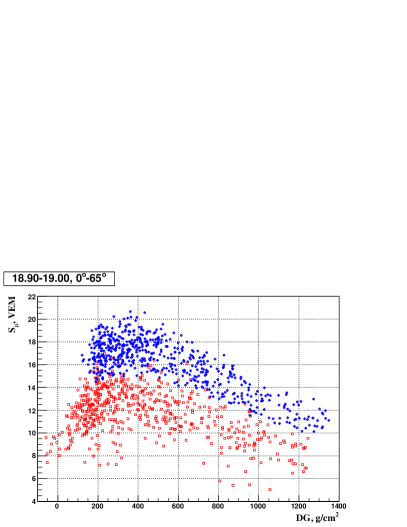
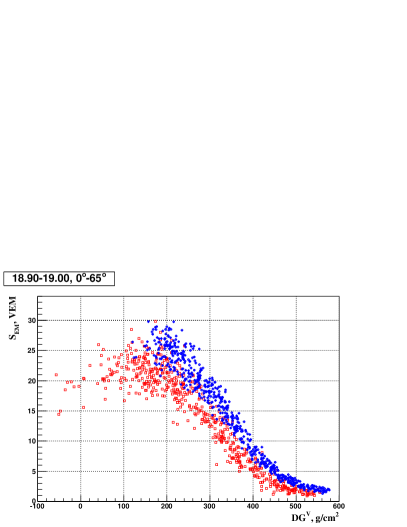
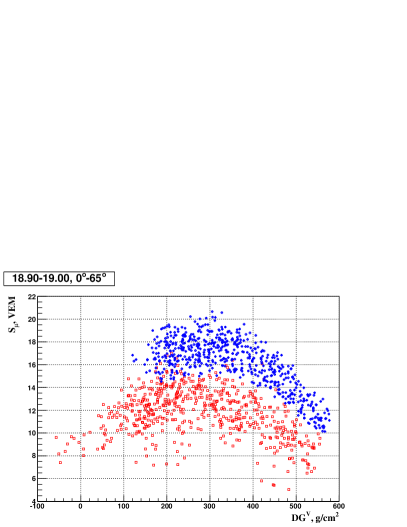
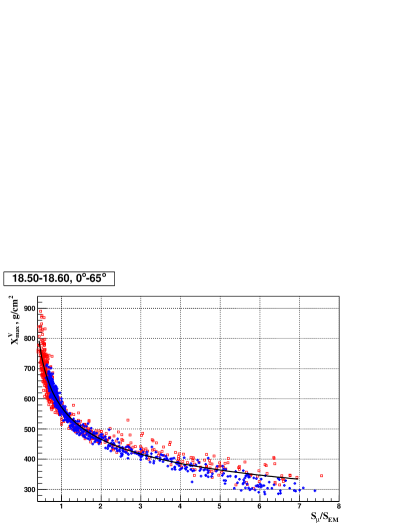
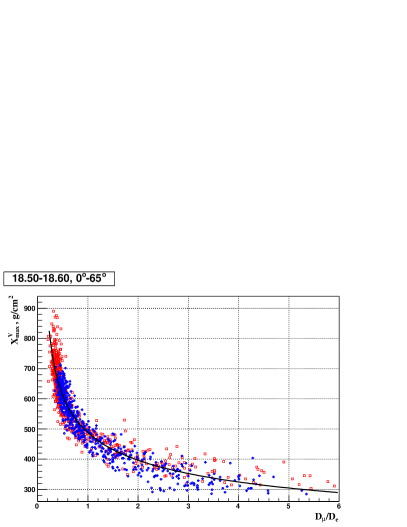
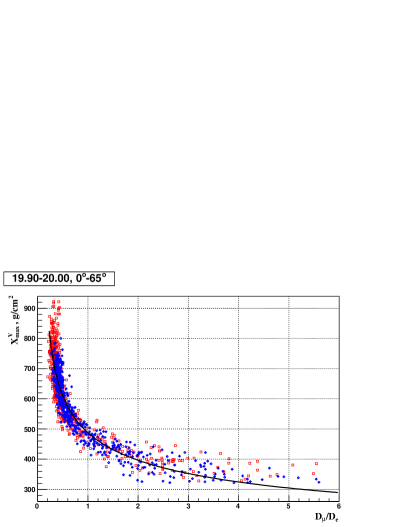
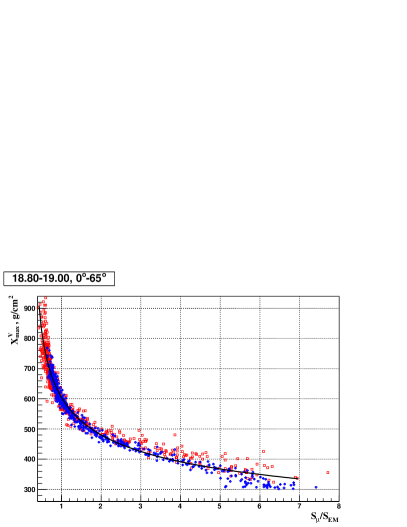
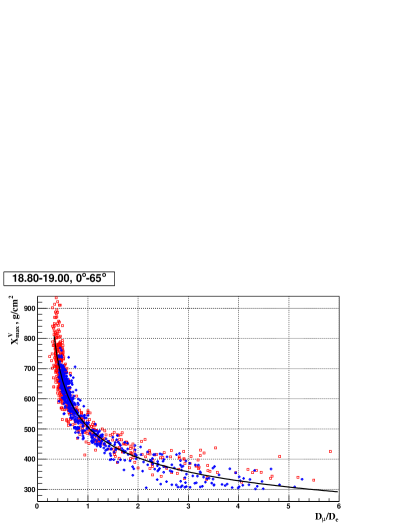
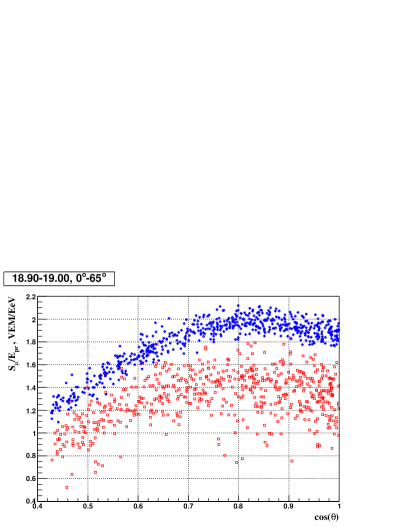
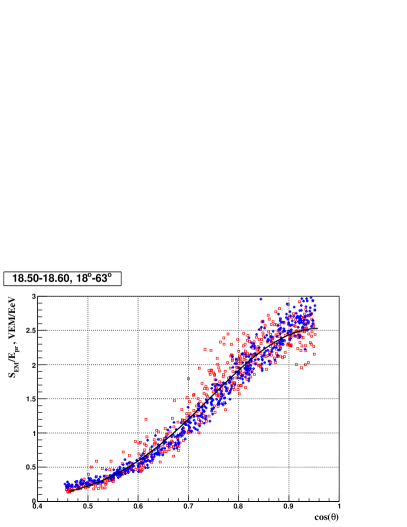
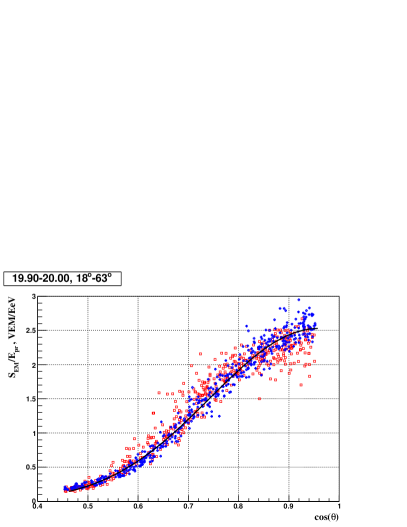
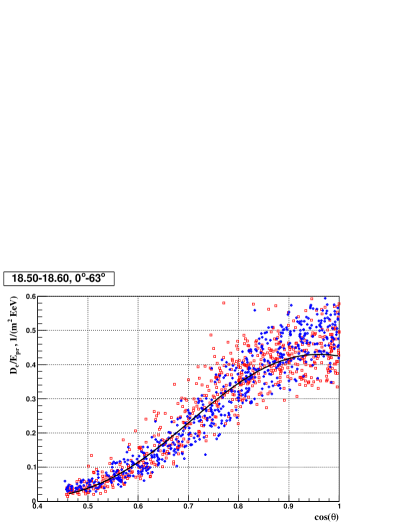
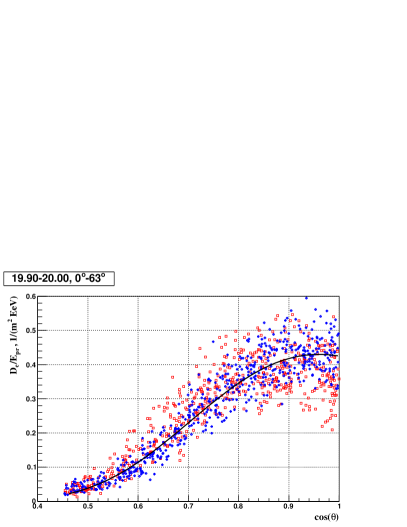
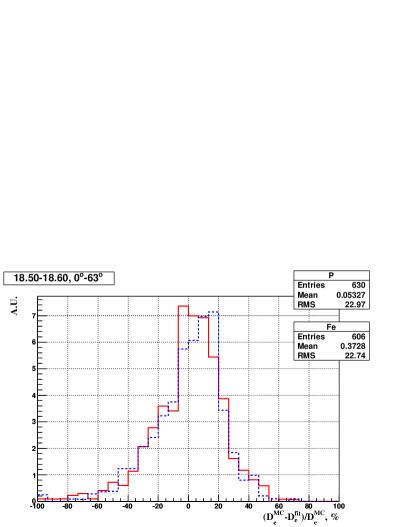
First, simply comparing shower characteristics dependence on vertical distance to ground , one finds a very interesting property (see Fig. 2). In this case the similarity of the functional dependence of muon and EM signals on between p and Fe primaries is preserved, but now also EM signal normalizations are different. This happens because one compares showers, which have the same vertical distance from to the ground, but proton showers on average are more inclined than iron ones and therefore their EM component attenuates more on the way from to the ground. The ratio turns out to be almost equal to the one and this allows to state a new shower universality property: the ratio of the muon signal to the EM one is the same for all showers, reaching the maximum at the same vertical depth , independently on the primary particle nature, primary energy and incident zenith angle (at least for the energy and angular ranges considered here). This property is illustrated in Fig. 3, where the dependence of on for p and Fe primaries is shown in two different energy bins and . The functional dependence between and turns out to be very simple and quasi-universal for all energies and primaries. The function in the form
| (1) |
has been used to fit the data in 15 energy bins [eV]=0.1 and the fit parameters have been found to be stable across the entire energy range. Using the functional dependence of on () and one easily gets the equation, which allows to obtain the muon signal from shower vertical depth and total signal in water Cherenkov tanks:
| (2) |
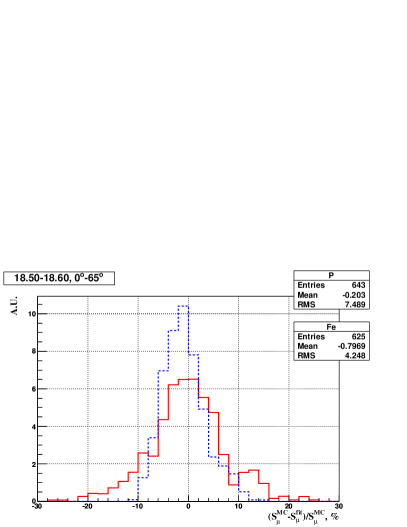
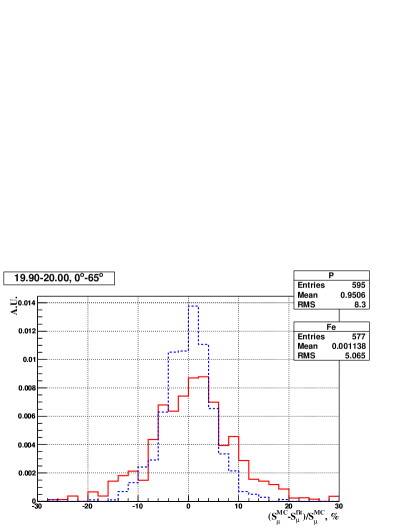
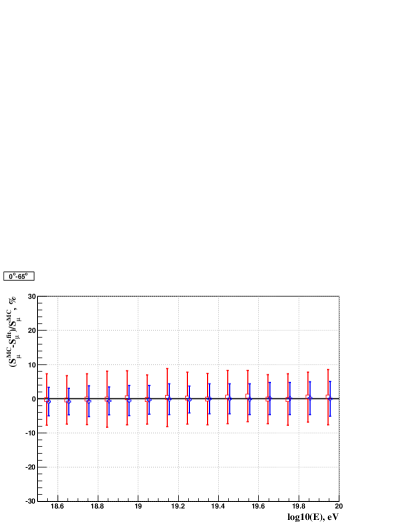
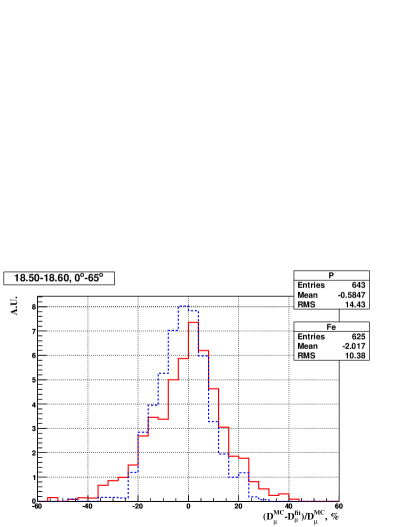
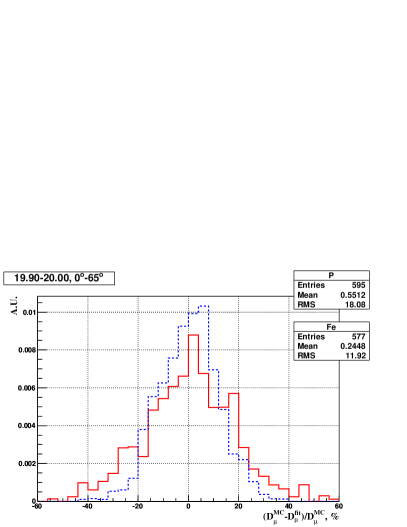
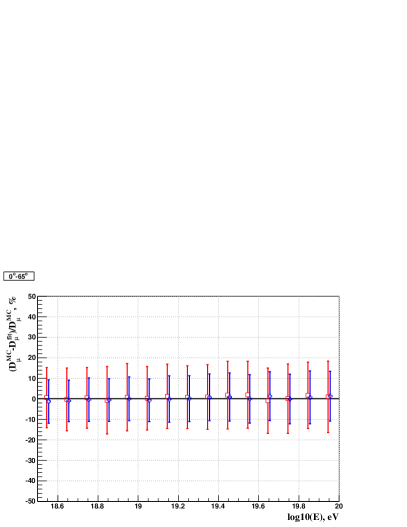
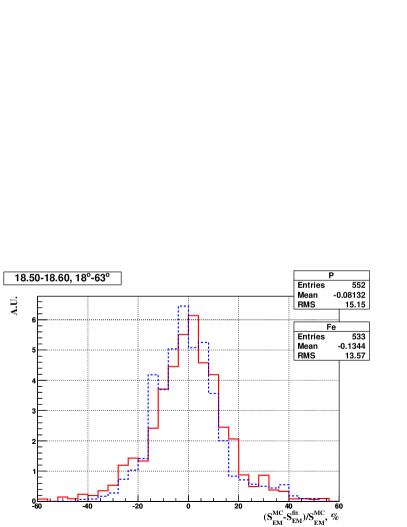
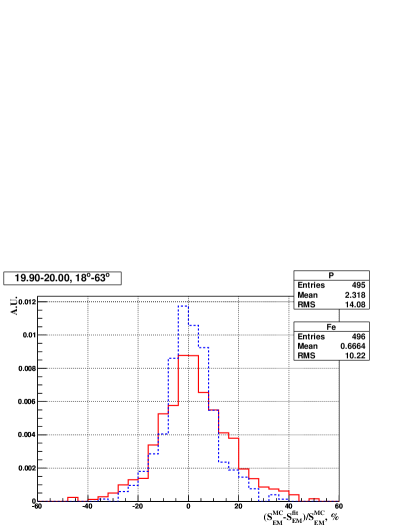
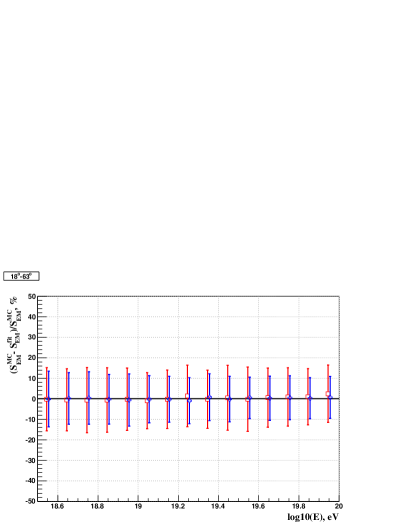
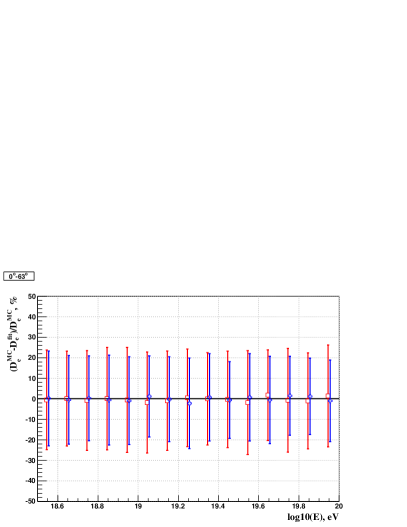
We calculated the difference between the Monte-Carlo (MC) simulated muon signal and the muon signal obtained from the fit , examples of its distribution are shown in Fig. 3. In Fig 4 we plot behaviour of mean and RMS values of these distributions for various energy bins, obtained with the unique set of fit parameters , and which represent their averages over 15 [eV]=0.1 energy bins. It is seen that the estimates of muon signals are unbiased with less than 1% deviation of the mean reconstructed muon signal from the MC one for all primaries and the RMS values are small: 8% for protons and around 5% for oxygen and iron (though we don’t show results for oxygen which are always between p and Fe, we used oxygen showers together with proton and iron ones to perform fits). Certainly, the application of specific coefficients for each energy bin, or narrowing of zenith angle interval, or using of more sophisticated fit functions can possibly slightly improve the performance of the method, but its simple and universal form already works very well. The described universal dependence of on holds true in the wide interval of distances (at the least from 200 to 1500 meters Yushkov et al. (2009)) from the core, though for distances closer to the core the function in the form (1) does not describe accurately the data in the entire angular range and splitting the angular range in two regions or applying more complex parametrization may be needed.
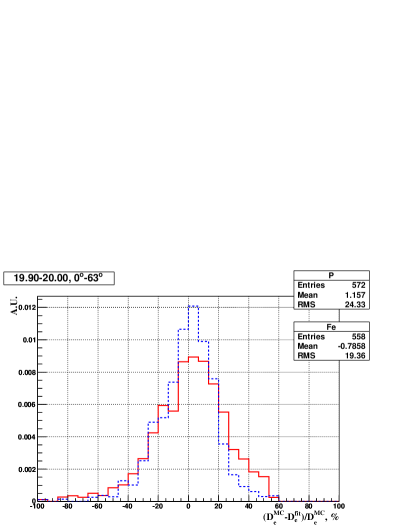
The same universality principle holds for the density of charged particles. We have performed the reconstruction of muon densities using the dependence of the ratio (muon density )/(electron density ) on as in equation (1) with a unique set of parameters for all energy bins , , (see Figs. 5, 6). It is seen that when muons and electrons equally contribute to the detector signal, the shower fluctuations play a more important role and the accuracy of parametrization is only within 15%, though the estimate is still unbiased.
In this context we would like to emphasize that since our study does not take into account any experimental error, we use the parametrizations only to demonstrate that the considered universality properties allow to perform simple accurate estimates of the EAS characteristics and that the functional forms are really universal in terms of energy, primary particle nature and zenith angle. Certainly, their application to the real experimental conditions may require some corrections of the coefficients or even of the functional form of the parametrizations (especially if core distances different from 1000 meters are considered).
Hence, the () vs universality allows to obtain accurate estimates of the muon signal (muon density) using simple parametrizations, which are almost independent on the primary particle nature, primary energy and zenith angle for various types of ground detectors. Taking into account that the shower universality property was established for different interaction models Giller et al. (2005); Nerling et al. (2006); Gora et al. (2006); Schmidt et al. (2007); Lipari (2009); Lafebre et al. (2009), the proposed approach to muon content derivation should not be specific only to QGSJET II and our test calculations with EPOS 1.99 confirm it (see Fig. 7). In case of EPOS 1.99 the fit in the form (1) still provides good description of the simulated data, but, as expected, fit coefficient are different from those for QGSJET II.
II Showers at the same zenith angles
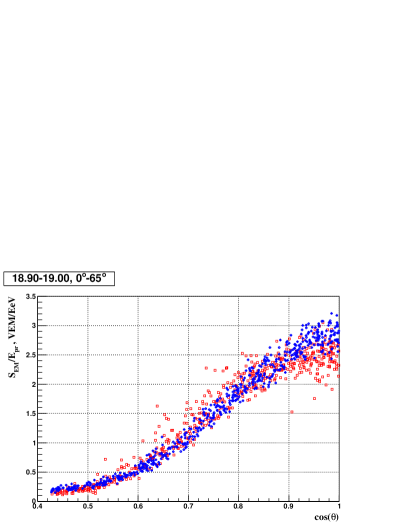
Another universality property follows from the study on showers arriving at the same zenith angles. In this case the average iron shower has to cross larger slant distance from to the ground with respect to the average proton shower and this almost equalizes EM signals (densities) for both primaries at the observation level in the wide range of zenith angles (Fig. 8). For the signal at 1000 meters in the Cherenkov water tanks, notable discrepancies between p and Fe showers EM components are observed for nearly vertical showers () and very inclined ones (). In the first case the situation is similar to the one considered in Fig. 1: the path from to the ground for p and Fe showers is almost the same. For inclined showers the difference is caused by the EM halo from muon decays and larger number of muons in iron showers brings to a larger EM halo signal. We normalize by primary energy to cancel the almost linear growth of the signal with the energy in order to obtain a universal description of for all energies.
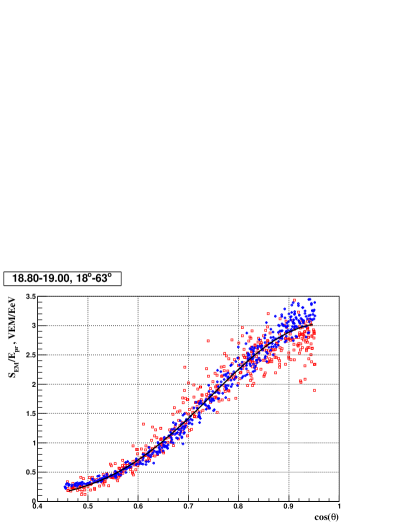
Looking at the showers at different zenith angles one samples longitudinal showers profiles, for this reason it is natural to try to describe the dependence of the EM signal on with Gaisser-Hillas type function, using as variable instead of :
| (3) |
where ; (signal at maximum), and (cosine of angle at which =) are fit parameters. The fit parameters and change by less than 10% and 3% correspondingly across entire range of energies (when one makes fits in 15 energy bins [eV]=0.1 from to ), while changes quite chaotically from to (this causes to change also ). We have found that, fixing (similarly to Schmidt et al. (2008)) to any negative value within this range, we obtain a good universal fit and changes in this case by less than 15%. Finally, we used the following average values (except that was fixed to ) of the coefficients , , , . The results of the fit and the difference between the MC simulated EM signal and the EM signal obtained from the fit are shown in Fig. 9. The accuracy of the reconstruction for all energy bins is shown in Fig. 10 and it is seen that one gets an unbiased estimate of with RMS below 15% for proton and 13% for iron showers. Let us note that RMS of the distributions of relative difference between fit and MC EM signals reflects shower-to-shower fluctuations and that the application of fits with coefficients calculated accurately for each energy bin does not produce any reduction of the RMS.
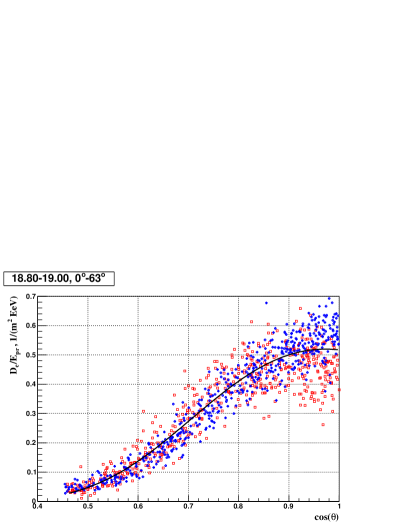
The same fit procedure was also applied to the density of electrons . In this case good agreement between p and Fe EAS electron densities was found in the wider angular range and was fixed to zero, that gave the following set of fit parameters: (instead of ), , , . The results of the fit and electron density reconstruction accuracy are presented in Figs. 11, 12. It is seen, that shower-to-shower fluctuations here are larger compared to the EM signal in water Cherenkov tanks and while the density estimates are still unbiased, their spread reaches 25% and 22% on average for proton and iron showers correspondingly.
Finally, our test calculations presented in Fig. 13 demonstrate that the universality of EM signal (density) dependence on zenith angle holds true also in case of EPOS 1.99.
Conclusions
We have proposed two new EAS universality properties providing two independent ways to access EM and muon shower contents. We have shown that these properties can be described with simple parametrizations which are valid in the wide energy () and zenith angle ranges, and independent on the primary particle nature. Certainly, application of these parametrizations to the real experimental conditions is not straightforward, but any their modifications can be easily accomplished and we believe that these universality properties can be used in hybrid experiments for mass composition studies, primary and missing energy estimates and for hadronic interaction model tests. In particular, we would like to dwell here on the problem of muon excess in the real data compared to predictions of most of the interaction models Abu-Zayyad et al. (2000); Engel (2007); Schmidt et al. (2008). Since the muon content of EAS is highly model-dependent (see e.g. Glushkov et al. (2008); Pierog and Werner (2008)) and the UHECR mass composition is still unknown, this muon excess can be expressed only in terms of a relative excess with respect to the prediction of a given hadronic interaction model for a given primary. In our point of view primary mass-insensitivity of the presented universality properties can be used to reveal inconsistencies in the hadronic interaction models without bias coming from the unknown mass of the UHECR. One of the possible strategies lies in simultaneous application of both considered universality properties to the data in order to reveal hadronic model inconsistencies and, after taking them into account, to get concording estimates of muon and EM contents. Once it will be possible to get vs dependence for the real data (and if the universality (1) will be observed also there) it will be clear how one should rescale number of muons predicted by QGSJET II or by another model and this correction will be independent on unknown primary mass. Another possible application of the property (1) for muon content derivation in almost interaction model independent way with its consequent use for primary mass composition analysis will be presented elsewhere Ambrosio et al. . And finally, for hybrid detectors equipped with muon counters probably it will be possible to use vs universality for determination of depth of shower maximum taking advantage of 100% ground array duty cycle in respect to 10% one of the fluorescence telescopes, but certainly this problem requires dedicated study.
Acknowledgements
We are very grateful to Maximo Ave and Fabian Schmidt for kind permission to use their GEANT 4 lookup tables in our calculations of signal from different particles in Auger water tanks.
References
- Abu-Zayyad et al. (2001) T. Abu-Zayyad et al. (HiRes-MIA), Astrophys. J. 557, 686 (2001), eprint astro-ph/0010652.
- Abraham et al. (2004) J. Abraham, M. Aglietta, I. C. Aguirre, et al. (Pierre Auger), Nucl. Instrum. Meth. A523, 50 (2004).
- Kawai et al. (2008) H. Kawai, S. Yoshida, H. Yoshii, et al., Nucl. Phys. B (Proc. Suppl.) 175-176, 221 (2008).
- Bluemer et al. (2009) J. Bluemer, R. Engel, and J. R. Hoerandel, Prog. Part. Nucl. Phys. 63, 293 (2009), eprint 0904.0725.
- Abu-Zayyad et al. (2000) T. Abu-Zayyad et al., Phys. Rev. Lett. 84, 4276 (2000).
- Engel (2007) R. Engel (Pierre Auger), in Proc. of the 30th ICRC (Merida, 2007), vol. 4, pp. 385–388, eprint 0706.1921.
- Schmidt et al. (2008) F. Schmidt, M. Ave, L. Cazon, and A. S. Chou, Astropart. Phys. 29, 355 (2008), eprint 0712.3750.
- Abraham et al. (2009) J. Abraham et al. (Pierre Auger) (2009), eprint 0906.2319.
- Werner et al. (2006) K. Werner, F.-M. Liu, and T. Pierog, Phys. Rev. C74, 044902 (2006), eprint hep-ph/0506232.
- Pierog and Werner (2009) T. Pierog and K. Werner, Nucl. Phys. Proc. Suppl. 196, 102 (2009), eprint 0905.1198.
- Pierog and Werner (2008) T. Pierog and K. Werner, Phys. Rev. Lett. 101, 171101 (2008), eprint astro-ph/0611311.
- (12) Searching for the Origins of Cosmic Rays, Trondheim, 2009, http://web.phys.ntnu.no/~mika/programme.html.
- Abbasi et al. (2009) R. U. Abbasi et al. (2009), eprint 0910.4184.
- Glushkov et al. (2008) A. V. Glushkov et al., JETP Lett. 87, 190 (2008), eprint 0710.5508.
- Bleve et al. (2009) C. Bleve, R. D. Parsons, J. Knapp, and S. S. Ostapchenko (2009), to be published in the proceeedings of the 31st ICRC, Lodz, Poland.
- Alvarez-Muniz et al. (2008) J. Alvarez-Muniz, J. D. de Deus, and C. Pajares (2008), eprint 0804.4751.
- Wibig (2009a) T. Wibig, Phys. Rev. D79, 094008 (2009a).
- Wibig (2009b) T. Wibig, Phys. Lett. B678, 60 (2009b).
- Ulrich et al. (2009) R. Ulrich, R. Engel, S. Muller, et al., Nucl. Phys. B (Proc. Suppl.) 196, 335 (2009), eprint 0906.3075.
- Giller et al. (2005) M. Giller, A. Kacperczyk, J. Malinowski, et al., J. Phys. G31, 947 (2005).
- Nerling et al. (2006) F. Nerling, J. Bluemer, R. Engel, and M. Risse, Astropart. Phys. 24, 421 (2006), eprint astro-ph/0506729.
- Gora et al. (2006) D. Gora, R. Engel, D. Heck, et al., Astropart. Phys. 24, 484 (2006), eprint astro-ph/0505371.
- Schmidt et al. (2007) F. Schmidt, M. Ave, L. Cazon, and A. S. Chou, in Proc. of the 30th ICRC (Merida, 2007), vol. 4, pp. 601–604, eprint 0706.1990.
- Lipari (2009) P. Lipari, Phys. Rev. 79, 063001 (2009), eprint 0809.0190.
- Lafebre et al. (2009) S. Lafebre, R. Engel, H. Falcke, et al., Astropart. Phys. 31, 243 (2009), eprint 0902.0548.
- Heck et al. (1998) D. Heck, J. Knapp, J. N. Capdevielle, et al., CORSIKA: a Monte Carlo code to simulate extensive air showers (Forschungszentrum, Karlsruhe, 1998), FZKA 6019.
- Ostapchenko (2006a) S. Ostapchenko, Nucl. Phys. B (Proc. Suppl.) 151, 143 (2006a), eprint hep-ph/0412332.
- Ostapchenko (2006b) S. Ostapchenko, Phys. Rev. D74, 014026 (2006b), eprint hep-ph/0505259.
- Ostapchenko (2006c) S. Ostapchenko, Phys. Lett. B636, 40 (2006c), eprint hep-ph/0602139.
- Battistoni et al. (2007) G. Battistoni, S. Muraro, P. R. Sala, et al., AIP Conf. Proc. 896, 31 (2007).
- (31) A. Ferrari, P. R. Sala, A. Fasso, and J. Ranft, CERN-2005-010.
- Nagano et al. (2000) M. Nagano, D. Heck, K. Shinozaki, et al., Astropart. Phys. 13, 277 (2000), eprint astro-ph/9912222.
- Billoir (2008) P. Billoir, Astropart. Phys. 30, 270 (2008).
- Yushkov et al. (2009) A. Yushkov et al. (2009), eprint 0910.4542.
- (35) M. Ambrosio et al., in preparation.