Effect of pressure on the magnetic, transport, and thermal-transport properties of the electron-doped manganite CaMn1-xSbxO3
Abstract
We have demonstrated the effect of hydrostatic pressure on magnetic and transport properties, and thermal transport properties in electron-doped manganites CaMn1-xSbxO3. The substitution of Sb5+ ion for Mn 4+site of the parent matrix causes one-electron doping with the chemical formula CaMnMnSbO3 accompanied by a monotonous increase in unit cell volume as a function of . Upon increasing the doping level of Sb, the magnitudes of both electrical resistivity and negative Seebeck coefficient are suppressed at high temperatures, indicating the electron doping. Anomalous diamagnetic behaviors at and 0.08 are clearly observed in field cooled dc magnetization. The effect of hydrostatic pressure on dc magnetization is in contrast to the chemical pressure effect due to Sb doping. The dynamical effect of ac magnetic susceptibility measurement points to the formation of the magnetically frustrated clusters such as FM clusters embedded in canted AFM matrix.
I INTRODUCTION
Manganese oxides with perovskite structure have been extensively investigated since the discovery of colossal magnetoresistance (CMR) effect.TO00 The spontaneous insulator to metal transition and its associated CMR effect are well explained on the basis of the double exchange (DE) model between Mn3+ and Mn4+ ions.ZE51 Furthermore, the phase separation model, where the ferromagnetic (FM) metallic and antiferromagnetic (AFM) insulating clusters of competing electronic phases coexist, strongly supports experimental studies of manganites.DA01 The dynamic Jahn-Teller (JT) effect of Mn3+ ions plays a crucial role in the physics of manganites.MI95
CaMnO3, the end member of Ca1-xLaxMnO3 system, undergoes a G-type antiferromagnetic transition around K accompanied by a weak ferromagnetic component,MAC67 where each spin of Mn ions is antiparallel to its nearest neighbors of Mn. In recent years, the electron doped manganite system ()CH96 has attracted much attentions because of the possibility of magnetoresistance effect. Neutron measurements on Ca1-xLaxMnO3 GRA03 have revealed the formation of the nanometric-scale FM clusters isolated within a G-type AFM matrix for sufficiently low doping (). Furthermore, for intermediate doping (0.030.14), a canting of the G-type AFM structure occurs with the nanometric FM clusters. In addition to a large number of researches on the A-site substituted electron doped manganites, it is shown that substituting of the Mn site of CaMnO3 with higher valence ions than 4+ such as CaMnMnMO3, with M = Nb, Ta, V, Ru,RA00 ; PI03 ; SHA04 ; GU05 ; ANG06 ; ZHO09 and CaMnMnMO3, with M = Mo, W,RA00 ; MAR01 ; PI03 ; MAI02 ; MIC07 ; ROZ08 ; MAR09 creates Mn3+ ions, i.e., electrons leading to the CMR effect. The crystallographic and magnetic properties of CaMn1-xRuxO3 system () allow us to apply the phase separated FM + AFM model to the ground state of this system.SHA04 For CaMn1-xMoxO3 system with low doping of Mo (), the low temperature magnetic ground state is better described by the canted AFM magnetic structure than by the phase separated state.ROZ08 ; MAR09 At higher doping levels of Mo, the charge ordered state is established within the parent matrix CaMnO3.MAR01 It thus is interesting to examine the physical properties of the Mn-site substituted compositions for our understanding of electronic phase diagram of electron-doped manganites.
In this paper, we demonstrate the effect of hydrostatic pressure on magnetic and transport properties, and thermal transport properties in electron-doped manganites CaMn1-xSbxO3, in order to examine a relationship between lattice and spin. The physical pressure effect is a powerful probe to investigate the electronic states of manganese oxides varying the one-electron band width at doping level fixed because the application of external pressure gives rise to a shrinkage of Mn-O bond length and/or straightening of a Mn-O-Mn bond angle.KU97 There has been several studies on the effect of pressure on magnetism of calcium based electron doped manganites so far.MAR04 For CaMn1-xRuxO3 with , the applied pressure dramatically suppresses the ferromagnetic phase accompanied by a rise of the magnetic transition temperature up to 14K.
In previous works of slightly electron doped CaMnO3 with B-site substitution, negative magnetization properties have been demonstrated.ANG06 ; MU10 The negative magnetization phenomena in manganites have been originally reported in compounds with two sublattices of Mn ions and rare-earth ions (Nd, Gd, Dy), such as NdMnO3BAR05 ; TRO06 , (La,Gd)MnO3,HEM04 (Nd,Ca)MnO3,TRO03 (Gd,Ca)MnO3,PEN02 and (Dy,Ca)MnO3.NO96 ; MO02 Some of these studies were discussed on the basis of ferrimagnetic scenario leading to negative magnetization below a compensation temperature, where Mn and some rare-earths sublattices are antiferrmagnetically coupled. Moreover, a phase separation model between the ferromagnetic clusters and the canted AFM matrix is proposed, in order to account for a possible origin of the negative magnetization in manganites.BAR05 ; TRO03 In addition to the B site substituted manganite, the negative magnetization was observed in some manganites without magnetic rare-earth ions, such as LaMnO3 nano particles. MAR08 Accordingly, the nature of the negative magnetization in manganites is one of crucial issues to be unveiled, which may be close to a phase segregated state.
Furthermore, we carry out the ac magnetic susceptibility measurements for CaMn1-xSbxO3, in order to examine the dynamic effect linked to magnetically frustrated properties. For spin glass or cluster glass system, a visible anomaly in the ac susceptibility appears upon lowering across freezing temperature of spins or clusters when the magnetic relaxation time becomes longer than the measuring time.MU81 In particular, we believe that a phase separated state realized in manganites is not consistent with a typical spin glass phase at low field.DE01 It thus is very intriguing to demonstrate a close relationship between static and dynamic responses of magnetization to the applied field, for our further understanding of complicated magnetic behavior of the present samples.
II EXPERIMENT
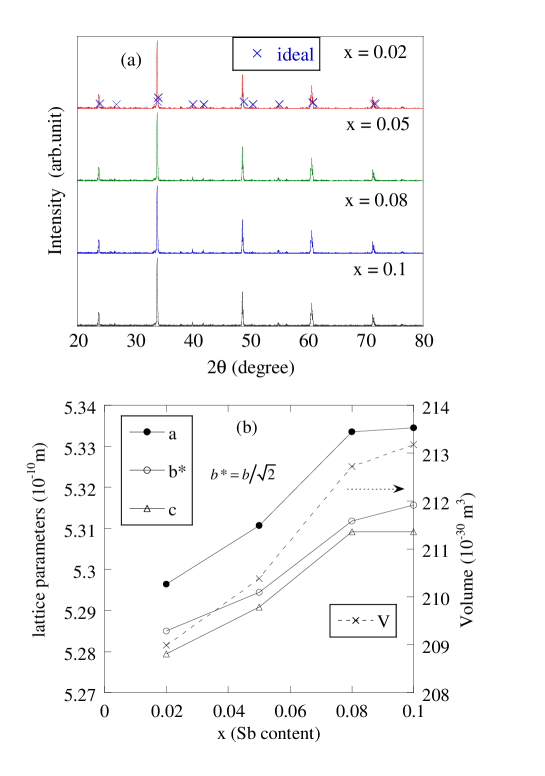
Polycrystalline samples of CaMn1-xSbxO3 (=0.02, 0.05, 0.08 and 0.1) were prepared with a solid-state reaction method. The stoichiometric mixtures of CaCO3, Mn3O4, and Sb2O3 high purity powders were calcined in air at 1000 ∘C for 24 h. The products were then ground and pressed into cylindrical pellets. The pellets were finally sintered at ∘C for 12 h. X-ray diffraction data revealed that all samples are almost single phase with orthorhombic structures ()(Fig.1). The lattice parameters of the =0.08 sample are Å, Å, and Å, which is in fair agreement with a previous work.PO04 The cell parameters and unit cell volume increase with increasing the Sb doping because the ion radius of Sb5+ (0.61Å) is greater than the value of Mn4+ (0.54Å). In addition, the Mn4+ ions are replaced by Mn3+ ions (0.645Å) with one extra electron, which contributes to the increased cell volume. The electrical resistivity was measured with a four-probe method. Seebeck coefficient was determined from both measurements of a thermoelectric voltage and temperature difference along the longitudinal direction of the measured sample. The thermal conductivity was collected with a conventional heat flow method. The dc and ac magnetization measurement was carried out using commercial superconducting quantum interference device (SQUID) magnetometers both at Iwate Univ. and National Institute for Materials Science. The ac magnetic susceptibility measurement for , 0.05, and 0.08 samples was measured as a function of frequency and dc magnetic field at the ac magnetic field of 0.5 mT. In particular, to remove the influence of remanent magnetic field, the SQUID magnetometer with the option of magnet reset mode was used in low field measurementsREM ; MU10 . Hydrostatic pressures in magnetization and electrical resistivity measurements were applied by using a clamp-type CuBe cell up to 1 GPa. Fluorinert was used as a pressure transmitting medium. The magnitude of pressure was calibrated by the pressure dependence of the critical temperature of lead. Magnetoresistance effect was measured by using a superconducting magnet at the High Field Laboratory for Superconducting Materials, Institute for Materials Research, Tohoku University.
III Results and discussion
| Content | ||||||||
|---|---|---|---|---|---|---|---|---|
| (cm) | (meV) | () | () | (K) | ||||
| 0 | 1.5 | 120 | ||||||
| 0.02 | 0.057 | 17.4 | -60 | -17 | 110 | |||
| 0.05 | 0.051 | 24.2 | -85 | -22 | 99 | |||
| 0.08 | 0.049 | 33.9 | -64 | -47 | 88 | |||
| 0.1 | 0.044 | 45.2 | -43 | 38 |
III.1 Effect of magnetic field and external pressure on electrical transport
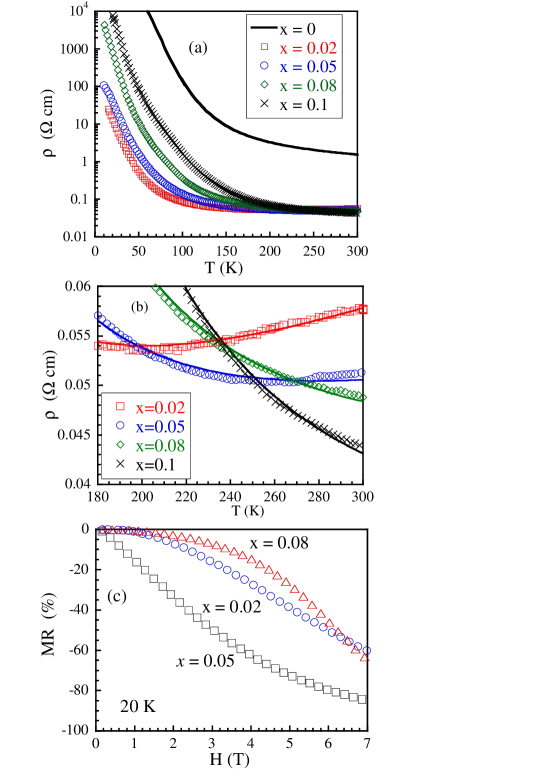
The temperature variation of electrical resistivity for the CaMn1-xSbxO3 system is shown in Fig. 2 as a function of the Sb content. The Sb substitution for Mn site up to gives rise to a substantial decrease in high temperature (300 K) from 1.5 cm at the parent sample through 0.057 cm at the lightly doped sample down to 0.044 cm at the intermediately doped sample, indicating the carrier doping into Mn-site. All samples exhibit semiconducting behaviors upon decreasing temperatures except for a metallic conduction at high temperatures for the Sb light doping. The curve of the and 0.05 samples remains a metallic like character in the paramagnetic region down to 200 K and 250 K, respectively. On the other hand, the magnitude of the resistivity of the =0.08 and 0.1 is enhanced at lower temperatures since the further doping of Sb ion breaks some of conduction paths along the Mn-O-Mn network, resulting in reinforcing carrier localization. In previous works,JA96 ; MAI98 it is reported that the high temperature transport in doped manganites is described by a small polaron hopping model. Now, we try to fit the resistivity data at high temperatures by using such an expression as exp(), where the fitting parameter represents the activation energy. As listed in Table 1, with increasing the Sb concentration, the value of the activation energy shows a gradual increase from 17.4 meV at up to 45.2 meV at in spite of a monotonous suppression in the resistivity vs Sb content at high temperatures. In the preceding section of Thermal transport, we will discuss the transport mechanism in the CaMn1-xSbxO3 system. We notice that the resistivity data of parent CaMnO3 observed here are, both in temperature dependence and magnitude, similar to the curve of the stoichiometric composition without oxygen defects, CaMnO3-δ ().ZE99
Next, let us examine the negative magnetoresistance effect on the electron doped manganite samples with , 0.05, and 0.08 as shown in Fig. 2(c). At the =0.05 sample, the gigantic magnetoresistance attaining at 20 K under the applied field of 7 T is observed. For the other samples, we obtain the MR ratio of . The MR data are comparable to those reported in a previous workRA00 on CaMn1-xMxO3 (M=Nb,Ta) system. Theses findings strongly indicate that the spin polarized ferromagnetic metal clusters are established by the applied field and the field-induced delocalized state is realized within the samples studied.
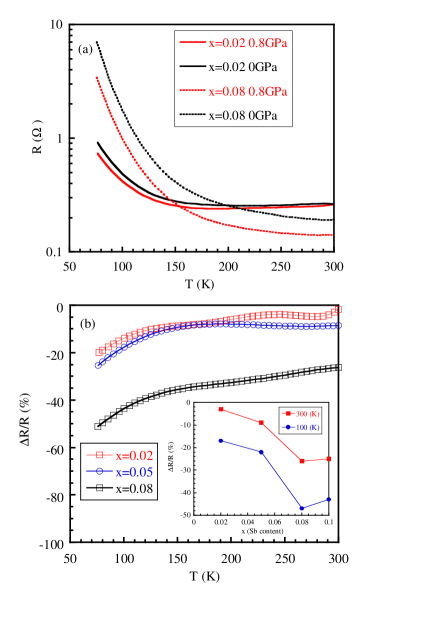
Finally, let us show in Fig. 3 the effect of pressure on the electrical resistance as a function of temperature between 77 K and 300 K for the CaMn1-xSbxO3 (=0.02 and 0.08). For comparison, the data at ambient pressure are presented. The applied pressure of 0.8 GPa on the sample suppresses the magnitude of from 25 at 300 K down to about 50 at lower temperatures around 80 K upon decreasing temperature. The effect of pressure on the electrical transport observed here seems to be more enhanced below near the magnetic transition temperatures =110 K at and 88 K at , where is determined from the inflection point of the magnetization data of Fig. 5. The pressure dependence of the resistance (the inset of Fig. 3) exhibits a maximum at the heavily doped sample of , which is consistent with the effect of strong pressure on the magnitude of magnetization below .(see Figs. 5(e) and 5(f))
III.2 Thermal transport (Seebeck coefficient and thermal conductivity)
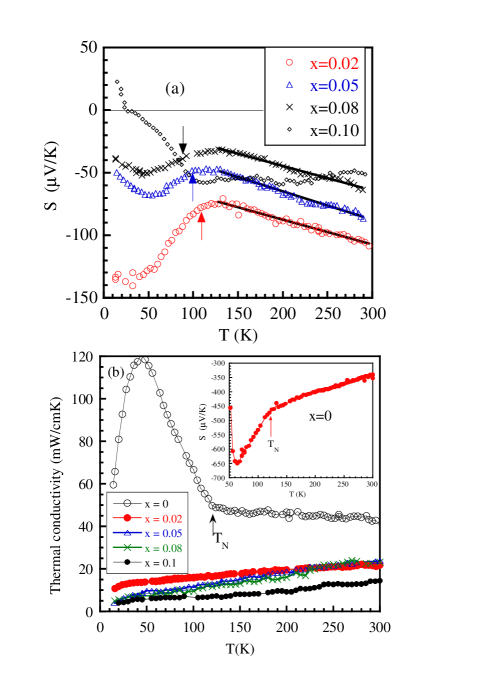
Seebeck coefficient is suppressed upon increasing Sb doping as shown in Fig. 4(a). For all samples studied, shows a negative value over a wide range of temperatures, strongly suggesting electron doping into the parent matrix. In the case of the substitution of Sb5+ ion for Mn4+ site, the Mn4+ ions are replaced by Mn3+ ions with one extra electron. For lower doped samples (=0.02 and 0.05), the local maximum observed in is located near the magnetic transition temperature as mentioned above. With further doping of Sb, the local maximum suppressed in of =0.08 is still located around 130 K, but it has little relationship with the weakly magnetic transition near 90 K. We notice a common feature in the -linear dependence of Seebeck coefficient for three samples (=0.02, 0.05 and 0.08) between 130 K and room temperature, although their dependences of the resistivity are quite different over the same temperature range as shown in Fig. 2(b). In our previous section, we demonstrated that the high- resistivity is well fitted by using a small polaron model. The corresponding expression for Seebeck coefficient is given in the form of
where and represent the thermal activation energy and the spin entropy in the high temperature limit, respectively.JA96 In Fig. 4, we note that the law is violated at high temperatures. The electrical resistivity of the present samples is greatly influenced by grain boundaries in comparison to Seebeck measurement, giving rise to little reliable information about the electronic states.SE In fact, such disagreements between these transports of polycrystalline oxide materials have been pointed out as far.FI00 ; MAE87
In previous worksMAI98 ; FI00 of electron doped manganites, the -linear dependence of has been discussed on the basis of the conventional metal model, or Culter and Mott (CM) model. The former is given in the form of
where is the density of states and is the carrier density.MAI98 The latter formula for the CM model is expressed as
where exp is an activated mobility and is an activation energy.CU69 The CM model for the random hopping system well describes a random distribution of localized states of electrons around Fermi level. The typical fitting parameters and ln, for the conventional and CM models are listed in Table 2. The fitted result shows that ratio is almost independent of the nominal composition. The magnitudes of ln are similar to those of the A-site substituted manganite Ca1-xLaxMnO3 (=0.017 and 0.033).FI00 For the insulating Li1+xTi2-xO4 sintered samples, it has been reported that is proportional to temperature and the behavior is analyzed using the CM model.MAE87 The Sb substitution induced lattice disorder influences the electronic states of the parent matrix, causing the validity of the CM model. Concerning the B-site substituted manganites, there is a common trend in the temperature dependence of between CaMn1-xWxO3( and 0.04) and the present samples with , 0.05, and 0.08.MIC07
| Content | ||||||||
|---|---|---|---|---|---|---|---|---|
| (V/K) | (1/eV) | (eV) | ||||||
| 0 | -340 | |||||||
| 0.02 | -107 | 8.2 | 50 | 0.12 | ||||
| 0.05 | -84 | 9.3 | 20 | 0.11 | ||||
| 0.08 | -63 | 8 | 12.5 | 0.13 | ||||
| 0.1 | -51 |
For =0.1, the data remain a nearly constant from room temperature down to near 100 K, then increase rapidly and finally exhibit a positive value across the horizontal axis at lower temperatures. Such an unusual behavior in has been reported both in A-site substituted system Ca1-xSmxMnO3(=0.2)HE99 and B-site system CaMn1-xWxO3()MIC07 , indicating a holelike character of charge carriers.
Finally, let us show in Fig. 4 the temperature variation of thermal conductivity in CaMn1-xSbxO3 (=0, 0.02, 0.05, 0.08, and 0.1). The thermal conduction for all samples studied here is carried by acoustic phonons because the electron contribution is negligible by an estimation from the electric resistivity data using the Wiedemann-Franz law. Upon decreasing temperature crossing the antiferromagnetic temperature TN, a sharp increase in of parent CaMnO3 is observed as reported in previous works.HE99 ; CO02 We believe that the thermal conductivity in the paramagnetic phase is strongly suppressed by phonon scattering due to nanoscale strains generated by spin correlations.CO02 This finding is thus explained by a rapid reduction of the phonon scattering when the AFM long range order is established below TN. The light doping of Sb5+ strongly suppresses the magnitude of thermal conductivity from 120 mW/cmK (50K) at the pure x=0 sample down to 14 mW/cmK at =0.02 (Fig.4). The Sb5+ doping removes the Mn4+ ion and instead produces the Mn3+ ion for Mn sites which is the Jahn-Teller active ion with one eg-electron. It is believed that the local lattice distortion due to JT effect causes phonon scattering, which is close to the depressed thermal conduction.MA03 In addition, the lattice deformation due to the Sb doping with its larger ion radius affects the neighboring Mn3+O6 octahedron, resulting in some variation of the orbital-state of eg-electron through the local JT effect.
III.3 Effect of pressure and magnetic field on dc magnetization
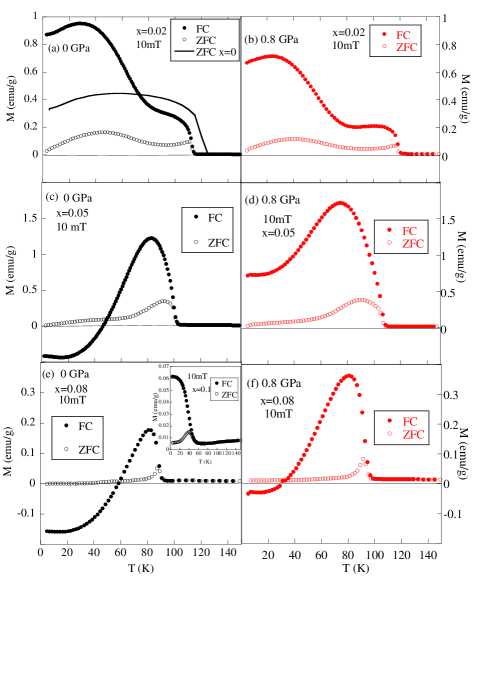
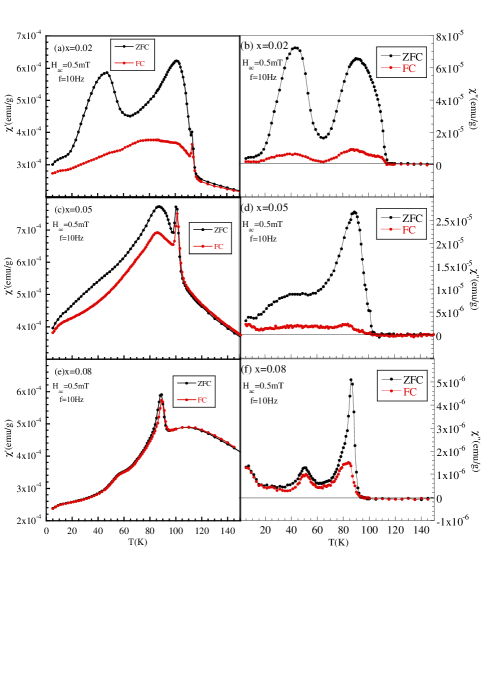
Let us show in Figs. 5(a), 5(c), and 5(e) the zero-field cooled (ZFC) and field cooled (FC) magnetization data of the Sb substituted CaMn1-xSbxO3 measured under an applied magnetic field of 10 mT at 0 GPa. First of all, temperature dependent magnetization reversal appears in the FC curves of both and 0.08, as it has been reported in the V doped CaMn1-xVxO3 manganites.ANG06 However, lowering temperature down to 2 K, the ZFC data of both samples show no negative value. Upon increasing the Sb content up to , a large difference between ZFC and FC curves is observed but such negative magnetization phenomenon vanishes.
The magnetic transition temperature is suppressed from 110 K at , through 99 K at , down to 38 K at due to the Sb doping because the Sb5+ ion is non magnetic one with the closed shell of . The substitution of non magnetic Sb ions for Mn sites introduces electron doping, forming ferromagnetic clusters, but destroys magnetic ordering between Mn ions within the parent matrix.
The FC data of indicates that the antiparallel component of the canted AFM spins to the applied field is stabilized by the Sb substitution. The spontaneously canted magnetic moment contributing to the negative magnetization is close to a variation of the local easy axis which is caused by the local lattice distortion of Sb substitution in comparison to the Sb free sample. If the number of canted spin clusters contributing to the antiparallel component is dominant over that of these clusters contributing to the parallel one along the applied field, we then obtain the negative magnetization. Furthermore, we need to point out the significant roles of the Dzyaloshinsky-Moriya interaction which prefers canted spin arrangements. If the antisymmetric exchange interaction between nearest neighbor Mn ions is dominant, such mechanism then stabilizes non collinear spin configuration, leading to complicated magnetic behaviors. In order to account for the negative magnetization observed in the lightly doped Nd1-xCaxMnO3 series, the low-temperature spin reorientation is explained in the framework of a two-phase model, where the samples consist of exchange coupled ferromagnetic and weak ferromagnetic phases.TRO03 The reorientation of magnetic moment of Nd ions in both phases plays a crucial role on the magnetization reversal through the f-d exchange interaction between the Nd and manganese sublattices. It seems that the proposal model is ruled out because the magnetic rare earth ion is absent in the present system.
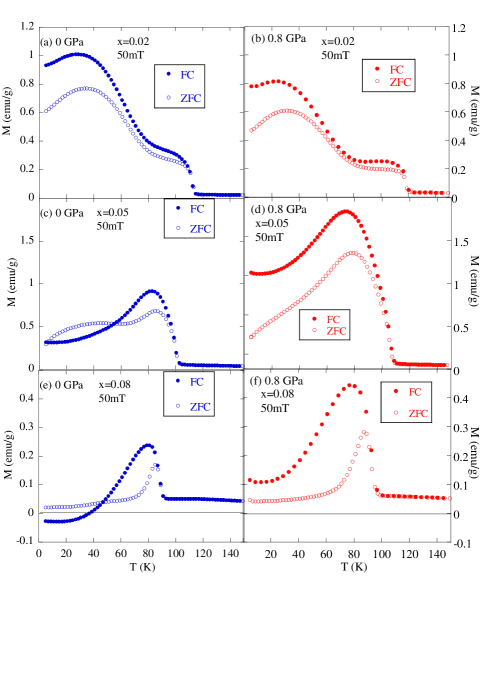
Next, we attempt to measure the effect of pressure on the magnetization for CaMn1-xSbxO3, to examine a relation between lattice distortion and spin arrangement (Figs. 5(b), 5(d), and 5(f)). The application of hydrostatic pressure up to 0.8 GPa enhances by 89 K at and 0.05, and a stable increase in reaches about 5 K at the sample. We expect that a shrinkage of lattice parameters makes stronger a super-exchange interaction between nearest neighbors spins of Mn4+ ions, resulting in stabilization of the G-type AFM magnetic structure. The magnitude of magnetization is not largely changed at and 0.05, but the FC magnetization of the sample exhibits a rapid rise in from 0.18 emu/g at 0 GPa up to 0.36 emu/g at 0.8 GPa, which is responsible for a sharp increase of FM clusters induced by pressure with a stable rise of . Both the ZFC and FC curves at under 0.8 GPa are similar to those under ambient pressure but the magnitude of magnetization is suppressed by the application of pressure. The application of external pressure on the sample changes the temperature induced magnetization reversal observed at 0 GPa and results in positive FC curve, approaching the ambient magnetization curves of the low doped sample (). At further Sb content of , the negative magnetization of the FC curve at 0.8 GPa are limited at lower temperatures below 30 K. However, it seems that the ZFC curves of all samples remain qualitatively unchanged even under the applied pressure. The orthorhombic distortion due to Sb doping is suppressed by application of pressure, resulting in a similar magnetic behavior to the lower doped case under ambient pressure. At the applied field of 50 mT, the negative magnetization disappears except for the low temperature region of at ambient pressure as shown in Fig. 6.
Here, we make remarks about a notable difference between the magnetic properties of the sample and other ones (, 0.05, and 0.08). As mentioned above, the magnetic transition temperature is monotonously decreased from 110 K at through 99 K at to 88 K at upon further Sb doping. At a maximum content of , is strongly depressed down to 40 K. These findings indicate that the magnetic interaction working between manganese ions is considerably suppressed beyond . For the sample, the nominal content of electron is taken as a maximum in the all samples studied. In fact, the room temperature resistivity and corresponding Seebeck coefficient of the sample exhibit the lowest values. However, upon lowering temperatures, the suppression of magnetic coupling working among the Mn ions around each Sb ion probably becomes dominant over the carrier doping effect and causes a strongly reduced magnetization accompanied by a remarkable decrease of . In addition to it, we point out the giant pressure effect on the magnitude of magnetization of the sample in applied fields of 10 mT and 50 mT as depicted in Fig. 5(d) and Fig. 6(d). In particular, the weaken magnetic interaction due to Sb doping under ambient pressure is strengthened under applied pressure of 0.8 GPa, giving the remarkable increase in the magnetization by a factor of about 2. The critical content is located near , separating negative and normal magnetic tendencies.
| (K) | (K) | (emu/g) | (emu/g) | (K) | (/Mn) | (/Mn) | ||
|---|---|---|---|---|---|---|---|---|
| 0 | 120 | 3.87 | ||||||
| 0.02 | 110 | 119 | 0.95 | 0.71 | -119 | 3.51 | 3.85 | |
| 0.05 | 99 | 107 | 1.23 | 1.70 | -1 | 3.41 | 3.83 | |
| 0.08 | 88 | 93 | 0.18 | 0.36 | 28 | 3.70 | 3.81 | |
| 0.1 | 38 | 3.80 |
Let us determine from the data taken at 0.1 T (not shown here), the Curie-Weiss temperature and the effective magnetic moment, for CaMn1-xSbxO3 system (=0.02, 0.05, and 0.08 ) as listed in Table 3. The Curie-Weiss temperature is estimated from a high temperature linear fit of by using the relation . The Curie constant gives the effective magnetic moment per one manganese ion. For comparison, the effective magnetic moment is calculated as a function of nominal Sb content from (Mn4+)+(Mn3+). For free ions in the high spin configuration, we have, (Mn4+) and (Mn3+) , 3.87 and 4.90, respectively. Here, we assume that where the spin quantum number = 3/2 for Mn4+ and = 2 for Mn3+. In the paramagnetic regime, we obtain from the negative value of -119 K at =0.02 to the positive ones of 28 K at =0.08, which is indicative of a qualitative variation in the magnetic interaction from antiferromagnetic to ferromagnetic character. Furthermore, the effective magnetic moment shows a slight increase from 3.51 at =0.02 up to 3.70 at =0.08. This finding seems to point to, the existence of ferromagnetic fluctuation or the formation of FM small clusters, in the paramagnetic phase of the Sb doped sample above the magnetic transition temperature. However, the resultant magnetic parameters are not always consistent with the low temperature magnetization suppressed at =0.08. The suppression of magnetic interaction due to Sb doping as discussed above and its related magnetic frustration probably prevent establishment of a large FM cluster or a long range FM order at low temperatures.
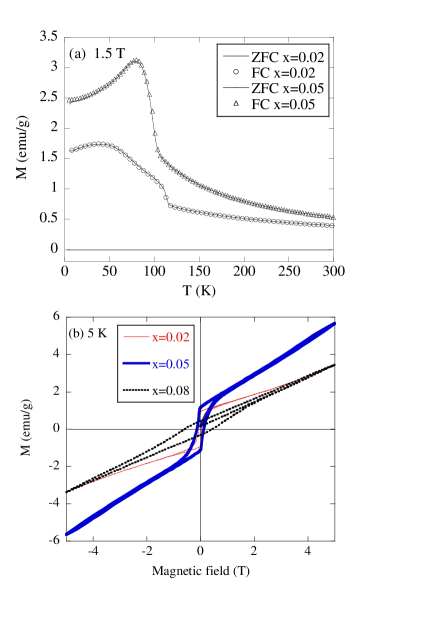
In a relatively high field of 1.5 T, the temperature variation of magnetization for and 0.05 shows no magnetic hysteresis between ZFC and ZC curves as displayed in Fig. 7(a). The () data with a small hysteresis do not saturate even at 5 T and rises linearly with increasing as shown in Fig. 7(b), indicating the AFM matrix with small FM phase. We understand from both Figs. 2(c) and 7(b) that the larger magnetization at high fields corresponds the stronger magnetoresistance effect. A linear extrapolation of () curve at 5 K to gives a spontaneous magnetization from 0.97 emu/g at through 1.2 emu/g at down 0.42 emu/g at , revealing the existence of small residual magnetization for all samples studied.
Finally, we suppose the valence fluctuation of Sb ion, to account for discrepancies in the effective moment between the experimental and calculated values as listed in Table 3. In a recent study of CaMn1-xRuxO3ZHO09 , X-ray absorption measurements reveal the presence of the mixed valence states of Ru ion. In the intermediate samples (0.10.9), it has been reported that the valence states of Ru5+ and Ru4+ coexist with the mixed valence of Mn ion. However, X-ray photoelectron spectroscopy analysis of La0.9Sb0.1MnO3DU04 indicates that the valence state of Sb ion is +5. Thus, we believe that Sb5+ exists predominantly in the low doping region of Sb.
III.4 Frequency and dc magnetic field dependences of ac magnetic susceptibility
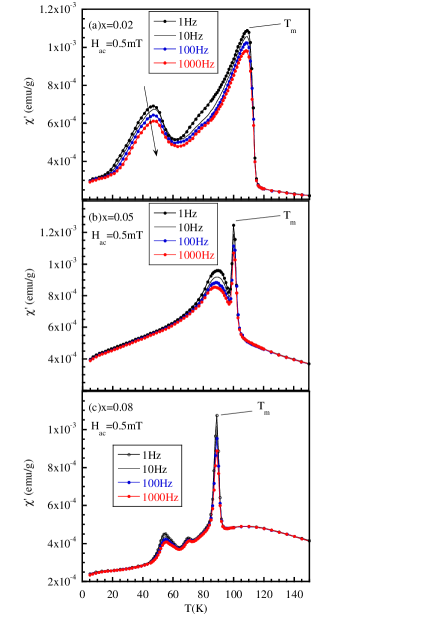
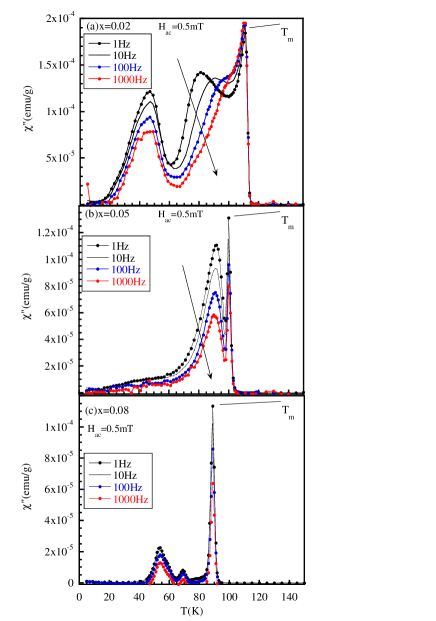
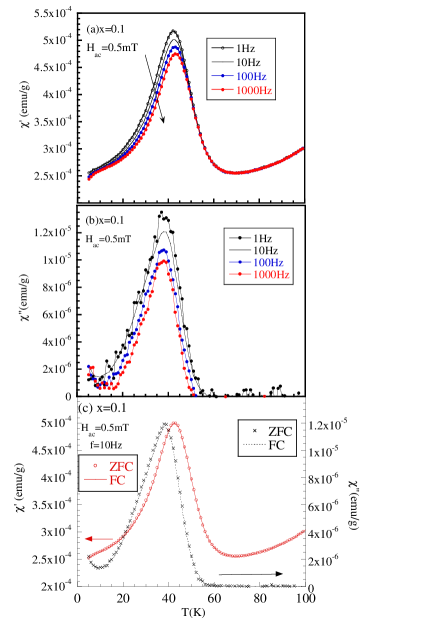
Furthermore, we carry out the ac magnetic susceptibility measurements for , 0.05, and 0.08 samples, in order to examine the dynamic effect linked to magnetically frustrated properties (Figs. 8 and 9). The real and imaginary parts of the ac susceptibility, and , are registered at zero dc magnetic field with frequency ranging 1 Hz up to 1 kHz. For , a sharp transition is noticed around K, which well agrees with the dc magnetic measurements. A maximum peak of curves shows no shift in temperature with increasing but a second peak at lower temperature exhibits a small shift towards high temperatures, indicating the presence of a magnetic frustration. The magnitude of (T) curves is suppressed with frequency over a wide range of temperatures. In addition to the two peaks observed in , a third peak in appears at low frequencies, its peak then shifts towards higher temperatures with increasing , and finally it is merged in a maximum peak at high frequencies. The new peak around 80 K at 1 Hz strongly depends on frequency. The imaginary component representing magnetic energy dissipation is close to the low field dc magnetic hysteresis between ZFC and FC. For , the maximum peak is located at K, while the second one observed at higher temperature of 90 K is accompanied by a slight frequency shift towards low temperatures. It seems that the frequency shift of the second peak in and curves for both and 0.05 is indicative of the signature of a spin-glass like magnetic property. However, a substantial decrease of peak in with increasing frequency is qualitatively in contrast to the behavior of conventional spin glass system,MU81 as previously reported in phase separated Pr0.7Ca0.3MnO3.DE01 The dynamical effect of has some relationship with the formation of the magnetically frustrated clusters such as FM clusters embedded in canted AFM matrix. On the other hand, in the case of , the second peak in and curves is located near 55K and it shows a weak frequency dependence as shown in Figs.8 and 9. We notice that the second peaks of and 0.05 are located around 47 K and 90 K, respectively, corresponding to the maximum of the ZFC dc magnetization. However, the second peak of has no corresponding maximum in the ZFC dc curve (Fig. 5(c)). We note that the ac susceptibility of the parent CaMnO3 exhibits no magnetic peak except for its maximum peak associated with long range magnetic ordering.MAI98 Moreover, for the B site substituted CaMn1-xMoxO3(), the imaginary part shows only a rapid peak at 105 K around the magnetic transition temperature and no signal at low temperatures.MAR09 For the low doped CaMn1-xRuxO3(), both and exhibit neither frequency dependence nor enhanced peak below .SHA04 This finding predicts that the low temperature ground state of the light Ru substituted CaMnO3 is better explained by the complex canted magnetic structure than by the phase separated model. For A site substituted Ca0.9La0.1MnO3, a much larger hysteresis in the dc magnetization between ZFC and FC curves, and the frequency effect on the ac susceptibility demonstrate that its low temperature state is considered as a cluster glass one without long range ferromagnetism.MAI98
Now, under zero field cooled and field cooled conditions, we display in Fig. 10 the ac susceptibility measurements of , 0.05, and 0.08 with a superimposed dc field (=10 mT). First of all, the steep peaks in both and around in the absence of dc field are strongly suppressed under the application of dc field but the second peaks of and 0.05 still remain stable. The collapse of a maximum peak at zero dc field is caused by the application of low dc field since the applied low field strongly suppresses the magnetic fluctuation associated with the magnetic transition.MUK96 Next, a magnetic divergence in the ac magnetization between ZFC and FC curves is visible at , but upon increasing the Sb content, both ZFC and FC ac curves at become reversible and exhibit no clear differences except for the high temperature region near . Finally, for the sample the maximum peak in FC of Fig. 10(f) is observed around 85 K, at the temperature where the FC dc curve reaches a maximum as shown in Fig. 5(e). If we assume that the maximum peak in FC is related to the formation of magnetically frustrated clusters associated with a phase separated state, we can not identify the second peak with corresponding signature in dc magnetization curve. However, the anomalous peak is located near the characteristic temperature pointing to the dc magnetization reversal. Accordingly, we suppose that the existence of the anomalous peak in of has some relationship with the negative magnetization phenomena observed here. For comparison, the ac susceptibility data of the sample are presented in Fig. 11. We notice frequency dependence of a maximum peak in both and around 40 K corresponding to the ZFC dc peak in the inset of Fig.5(e), indicating the strong evidence for magnetically frustrated state.
IV SUMMARY
We have demonstrated the effect of hydrostatic pressure on magnetic and transport properties, in electron-doped manganites CaMn1-xSbxO3. In addition, thermal transport properties (Seebeck coefficient and thermal conductivity) of the CaMn1-xSbxO3 system have been examined as a function of . Furthermore, the ac magnetic susceptibility measurements for , 0.05, and 0.08 samples have been performed, in order to examine a close relation between the dynamic effect linked to magnetically frustrated properties and the static dc magnetization.
The substitution of Sb5+ ion for Mn 4+site of the parent matrix causes one-electron doping with the chemical formula CaMnMnSbO3 accompanied by a monotonous increase in unit cell volume as a function of .
Upon increasing the doping level of Sb, the magnitudes of both electrical resistivity and Seebeck coefficient are suppressed at high temperatures, indicating the electron doping. The CM model applied to the random hopping system gives a better fit to Seebeck coefficient at higher temperatures. The light doping of Sb5+ strongly suppresses the high thermal conductivity of the parent sample through the local lattice distortions.
The anomalously diamagnetic behaviors at and 0.08 are clearly observed in the field cooled spontaneous magnetization. The magnetization curves under the applied pressure of 0.8 GPa at and 0.08 exhibit similar behaviors to those of the and 0.05 samples without pressure, respectively. We expect that these findings are close to some change of the local easy axis of magnetization due to the local lattice distortion induced by the Sb doping, in comparison to the case of the A site substitution. A notable difference in the magnetization curves between the sample and other ones is attributed to the weaken magnetic interaction working among the Mn ions around Sb ion.
The dynamical effect of ac magnetic susceptibility measurement has some relationship with formation of the magnetically frustrated clusters such as FM clusters embedded in canted AFM matrix. In particular, we suppose that the existence of the anomalous peak in FC of is related to the negative magnetization observed here.
Acknowledgements.
This work was partially supported by a Grant-in-Aid for Scientific Research from Japan Society of the Promotion of Science.References
- (1) Colossal Magnetoresistive Oxides, edited by Y. Tokura (Gordon and Breach, New York, 2000).
- (2) C. Zener, Phys. Rev. 82, 403 (1951); P. G. deGennes, . 118, 141 (1960).
- (3) Nanoscale Phase Separation and Colossal Magnetoresistance, by E. Dagotto (Springer, 2003).
- (4) A. J. Millis, P. B. Littlewood, and B. I. Shraiman, Phys. Rev. Lett. 74, 5144 (1995); A. J. Millis, B. I. Shraiman, and R. Mueller, . 77, 175 (1996).
- (5) J. B. MacChesney, H. J. Williams, J. F. Potter, and R. C. Sherwood, Phys. Rev. 164, 779 (1967).
- (6) H. Chiba, M. Kikuchi, K. Kasuba, Y. Muraoka, and Y. Syono, Solid State Commun. 99, 499 (1996).
- (7) E. Granado, C. D. Ling, J. J. Neumeier, J. W. Lynn, and D. N. Argyriou, Phys. Rev. B68, 134440 (2003).
- (8) B. Raveau, Y. M. Zhao, C. Martin, M. Hervieu, and A. Maignan, J. Solid State Chem. 149, 203 (2000).
- (9) L. Pi. S. Hebert, C. Martin, A. Maignan, and B. Raveau, Phys. Rev. B67, 024430 (2003).
- (10) A. I. Shames, E. Rozenberg, C. Martin, A. Maignan, B. Raveau, G. Andre, and G. Gorodetsky, Phys. Rev. B70, 134433 (2004).
- (11) Y. Guo, W. Li, S. Roy, and N. Ali, Chem. Mater. 17, 2735 (2005).
- (12) R. Ang, Y. P. Sun, Y. Q. Ma, B. C. Zhao, X. B. Zhu and W. H. Song, J. Appl. Phys. 100, 063902 (2006).
- (13) Q. Zhou, B. J. Kennedy, Z. Zhang, L. Y. Jang, and J. B. Aitken, Chem. Mater. 21, 4203 (2009).
- (14) C. Martin, A. Maignan, M. Hervieu, and B. Raveau, Phys. Rev. B63, 100406 (2001).
- (15) A. Maignan, C. Martin, C. Autret, M. Hervieu, B. Raveau, and J. Hejtmanek, J. Mater. Chem. 12, 1806 (2002).
- (16) M. Miclau, J. Hejtmanek, R. Retoux, K. Knizek, Z. Zirak, R. Fresard, A. Maignan, S. Hebert, M. Hervieu, and C. Martin, Chem. Mater. 19, 4243 (2007).
- (17) E. Rozenberg, M. Auslender, A. I. Shames, C. Martin, and S. Hebert, J. Appl. Phys. 103, 07F720 (2008).
- (18) C. Martin, M. Miclau, S. Hebert, M. Giot, A. Maignan, G. Andre, and F. Bouree-Vigneron, J. Magn. Magn. Mater. 321, 3938 (2009).
- (19) H. Kuwahara, Y. Moritomo, Y. Tomioka, A. Asamitsu, R. Kumai, and Y. Tokura, Phys. Rev. B56, 9386 (1997).
- (20) V. Markovich, I. Fita, R. Puzniak, E. Rozenberg, C. Martin, A. Wisniewski, A. Maignan, B. Raveau, Y. Yuzhelevskii and G. Gorodetsky, Phys. Rev. B70, 024403 (2004): V. Markovich, I. Fita, R. Puzniak, E. Rozenberg, C. Martin, A. Wisniewski, Y. Yuzhelevskii and G. Gorodetsky, Phys. Rev. B71, 134427 (2005).
- (21) Y. Murano, M. Matsukawa, S. Kobayashi, S. Nimori, R. Suryanarayanan,Journal of Physics. Conf. Series 200, 012114 (2010).
- (22) F. Bartolome, J. Herrero-Albillos, L. M. Garcia, J. Bartolome, N. Jaouen, and A. Rogalev, J. Appl. Phys. 97, 10A503 (2005).
- (23) I. O. Troyanchuk, V. A. Khomchenko, S. N. Pastushonok. O. A. Novitsky, V. I. Pavlov, and H. Szymczak, J. Magn. Magn. Mater. 303, 111 (2006).
- (24) J. Hemberger, S. Lobina, H. A. Krug von Nidda, N. Tristan, V. Yu. Ivanov, A. A. Mukhin, A. M. Balbashov, and A. Loidl, Phys. Rev. B70, 024414 (2004).
- (25) I. O. Troyanchuk, V. A. Khomchenko, G. M. Chobot, A. I. Kurbakov, A. N. Vasilev, V. V. Eremenko, V. A. Sirenko, M. Yu. Shvedun, H. Szymczak, and R. Szymczak, J. Phys. Condens. Mater. 15, 8865 (2003).
- (26) O. Pena, M. Bahout, K. Ghanimi, P. Duran, D. Gutierrez, and C. Moure, J. Mater. Chem. 12, 2480 (2002) : O. Pena, C. Moure, P. Barahona, M. Baibich, and G. Martinez, Physica B 384, 57 (2006).
- (27) C. A. Nordman, V. S. Achutharaman, V. A. Vasko, P. A. Kraus, A. R. Ruosi, A. M. Kadin, and A. M. Goldman, Phys. Rev. B54, 9023 (1996).
- (28) M. Mouallem-Bahout, O. Pena, D. Gutierrez, P. Duran, and C. Moure, Solid State Commun. 122, 561 (2002).
- (29) V. Markovich, I. Fita, A. Wisniewski, R. Puzniak, D. Mogilyansky, L. Titelman, L. Vradman, M. Herskowitz, and G. Gorodetsky, Phys. Rev. B77, 014423 (2008)
- (30) C. A. M. Mulder, A. J. van Duyneveldt, and J. A. Mydosh, Phys. Rev. B23, 1384 (1981).
- (31) I. G. Deac, J. F. Mitchell, and P. Schiffer, Phys. Rev. B63, 172408 (2001).
- (32) V. Poltavets, K. Vidyasagar and M.Jansen, J. Solid State Chem. 177, 1285 (2004).
- (33) In our previous workMU10 , we presented the low field magnetization measurements by using the SQUID magnetometer. Recently, we noticed that the remanent magnetic field in the superconducting magnet affects the temperature variation of the magnetization in the zero field cooled runs. In fact, we checked it by using the SQUID magnetometer with the function of magnet reset mode, to reduce the remanent field below about 2G. Separately, we tried to perform the magnetization measurements with the SQUID by using the fluxgate device for further reduction of the remanent value below 1 mG. The former result was in good agreement with the latter. As a result, we expect that the apparent ′′ZFC′′ scan in the previous measurements is a field cooled one under the negative remanent field in the case of switching off the magnet reset.
- (34) M. Jaime, M. B. Salamon, M. Rubinstein, R. E. Treece, J. S. Horwitz, and D. B. Chrisey, Phys. Rev. B54, 11914 (1996).
- (35) A. Maignan, C. Martin, F. Damay, B. Raveau, and J. Hejtmanek, Phys. Rev. B58, 2758 (1998).
- (36) Z. Zeng, M. Greenblatt, and M. Croft, Phys. Rev. B59, 8784 (1999).
- (37) Seebeck coefficient is a sensitive probe to examine the electronic state of disordered crystals or highly inhomogeneous materials. is less affected by grain boundaries of polycrystalline samples than the electrical conductivity measurement since the thermal current applied to the sample is hard to be disturbed by the grain boundaries in comparison to the electric current.
- (38) B. Fisher, L. Patlagan, G. M. Reisner, and A. Knizhnik, Phys. Rev. B61, 470 (2000).
- (39) I. Maekawa, F. Takagi, Y. Sakai, and N. Tsuda, J. Phys. Soc. Jpn. 56, 2119 (1987).
- (40) M. Culter and N. F. Mott, Phys.Rev.181,1336(1969).
- (41) J. Hejtmanek, Z. Jirak, M. Marysko, C. Martin, A. Maignan, M. Hervieu, and B. Raveau, Phys. Rev. B60, 14057 (1999).
- (42) J. L. Cohn and J. J. Neumeier, Phys. Rev. B66, 100404(R) (2002).
- (43) M. Matsukawa, M. Narita, T. Nishimura, M. Yoshizawa, M. Apostu, R. Suryanarayanan, A. Revcolevschi, K. Itoh, and N. Kobayashi, Phys. Rev. B67, 104433 (2003).
- (44) P. Duan, S. Y. Dai, G. T. Tan, H. B. Lu, Y. L. Zhou, B. L. Cheng, and Z. H. Chen, J. Appl. Phys. 95, 5666 (2004).
- (45) S. Mukherjee, R. Ranganathan, P. S. Anikumar, and P. A. Joy, Phys. Rev. B54, 9267 (1996).