193 \volnumber1
The SECIS instrument on the Lomnický Peak Observatory \hauthorJ. Ambróz, K. Radziszewski, P. Rudawy, J. Rybák, K.J.H. Phillips
51-622 Wrocław, ul. Kopernika 11, Poland 33institutetext: University College London – Mullard Space Science Laboratory, Holmbury St Mary,
Dorking, Surrey RH5 6NT, UK
The SECIS instrument on the Lomnický Peak Observatory
Abstract
Heating mechanisms of the solar corona will be investigated at the high-altitude solar observatory Lomnicky Peak of the Astronomical Institute of SAS (Slovakia) using its mid-size Lyot coronagraph and post-focal instrument SECIS provided by Astronomical Institute of the University of Wrocław (Poland). The data will be studied with respect to the energy transport and release responsible for heating the solar corona to temperatures of mega-Kelvins. In particular investigations will be focused on detection of possible high-frequency MHD waves in the solar corona. The scientific background of the project, technical details of the SECIS system modified specially for the Lomnicky Peak coronagraph, and inspection of the test data are described in the paper.
keywords:
Sun – corona – coronal heating – instrumentation – fast imaging1 Introduction
For more than 60 years it has been well known that the quiet solar corona is heated to a temperature of about 1–2 million Kelvins while the visible surface of the Sun is roughly 250 times cooler (Grotrian 1939; Edlen 1942; Phillips, 1995). It has been also recognized that magnetic fields or waves play a key rôle in the heating of the solar corona so that somehow convective energy in the photosphere is converted to thermal energy in the corona via magnetic fields or wave energy. The primary energy source for this heating must lie in the convection zone below the solar photosphere (e.g. Bray et al., 1991; Golub & Pasachoff 1998; Aschwanden 2004) where there is 100 times as much energy available than that required to heat the corona (300 W/m2: Withbroe & Noyes 1977, Aschwanden 2001).
Currently, the debate centres on whether the energy to heat the corona derives from dissipation of magneto-hydrodynamic (MHD) waves (e.g. Hollweg, 1981) or from numerous small-scale magnetic reconnection events giving rise to nanoflares (Parker, 1988, Aschwanden 2004). It has been found theoretically that the interaction of the magnetic field with convective flows in or below the photosphere can produce two types of magnetic disturbances in coronal structures. Firstly, the buffeting of magnetic flux concentrations in the photosphere by granulation generates MHD waves which can propagate into magnetic flux tubes and dissipate their energy in the chromosphere or corona (e.g. Ofman et al. 1998). Secondly, in coronal loops the random motions of magnetic loop foot-points can produce twisting and braiding of coronal field lines, which generates field-aligned electric currents that can be dissipated resistively (e.g. Parker 1972, 1983; Heyvaerts & Priest 1983; van Ballegooijen 1990). The main difference between these processes is that plasma inertia plays a key rôle in wave propagation, but is unimportant for the dynamics of field-aligned currents along coronal loops. Thus these types of magnetic heating mechanisms can be crudely classified as either wave-heating or current-heating mechanisms.
There are theoretical arguments for both mechanisms, but the observational evidence for nano-flare heating is perhaps looking less convincing than before. Extrapolation of the number spectra of small flares down to microflares has been made to nano-flares but the total energy, while tantalisingly close, is most probably less than the required amount (Parnell et al. 2000).
2 High-frequency loop oscillations
Several theoretical studies showed that only high-frequency MHD waves ( Hz) are capable of significant heating (e.g. Porter et al. 1994, Aschwanden 2004). These waves have been sought using the Fe XIV “green” line at 530.3 nm (emitted at K) and the Fe X “red” line at 637.5 nm ( K). Observations of high-frequency intensity oscillations of the coronal structures have been made by Pasachoff and colleagues (green line: Pasachoff et al., 1995, 2000, 2002), by Rušin and Minarovjech (green and red lines: Rušin & Minarovjech, 1991, 1994), by Rudawy, Phillips and colleagues (green line, total eclipses in 1999 and 2001; Phillips et al., 2000, Williams et al., 2001; Rudawy et al., 2001; Williams et al., 2002; Rudawy et al., 2004), and by Singh et al. (green and red lines: Singh et al., 2009). Phillips and Rudawy and their colleagues with their SECIS (Solar Eclipse Coronal Imaging System) CCD camera instrument have obtained the highest time resolution up to now. The results of these investigations are somewhat contradictory, with both positive and negative observations of oscillations (e.g. Pasachoff & Landman 1984; Koutchmy et al. 1994; Cowsik et al. 1999; Williams et al. 2001, 2002; Rudawy et al. 2004). Space missions capable of comparable time resolution measurements have not been available up to the present time, so using ground-based equipment is still the only way of making such observations (Aschwanden, 2004, Klimchuk, 2006).
In this paper, we describe a set-up that will be used to search for high-frequency coronal oscillations. We shall be making observations using the mid-sized coronagraph (belonging to the Astronomical Institute of Slovak Academy of Sciences in Tatranska Lomnica: Lexa, 1963) at Lomnicky Peak Observatory. Observations will be made in the Fe XIV green line using the SECIS instrument (Phillips et al. 2000), now owned by the Astronomical Institute at the University of Wrocław, Poland.
3 Instrumentation
The observational system on the Lomnicky Peak Observatory consists of 3 main instrumental parts: the 20-cm Lyot-type coronagraph, SECIS instrument (two fast-frame-rate CCD cameras, auxiliary electronics systems and dedicated computer) and a special opto-mechanical interface between the coronagraph and SECIS cameras.
3.1 Coronagraph
The Lomnicky Peak coronagraph (Lexa, 1963), made by Carl Zeiss Jena, is located at the summit of Lomnicky Peak (2634 m altitude), allowing observations in the light of prominent coronal visible-light emission lines out to a significant distance beyond the solar limb.
The front part of its optical system consists of a single objective lens (BK7 glass, =1.71 m, =17.0 m, 200 mm, 3 m) and a primary diaphragm which obscures the lens to a final clear aperture of 195 mm. The focal lengths of the objective for the wavelength of the green line are 2975 and 2980 mm for the axial and outer light beams respectively.
The central part of the optical system has an artificial Moon (the occulting disk) which is a fat mirror inclined with respect to the optical axis and reflects the solar disk light out of the coronagraph tube. The artificial Moon is fixed in front of a field lens in a hole in the center of the lens, and can be changed to similar ones with various diameters. Behind the field lens there is a re-imaging triplet lens in order to correct, at least partially, geometric aberrations of the primary lens and to focus a difraction image of the primary diaphragm on Lyot’s stop. Lyot’s stop lies between the second and the third lenses of the triplet and blocks the scattered light coming from the primary diaphragm. A particular feature of the optical system is a four-lens imaging objective of 9 cm aperture. The combined action of both objectives creates the final image of the corona with diameter mm.
The coronagraph is equipped with a fast optical automatic guider. It detects offsets of the actual pointing using two photodiode pairs in an anti-parallel connection providing closed-loop correction signals to the drives. It precisely stabilizes the relative position of the occulting disk against the solar image, ensuring stable position of the field of view.
3.2 Opto-mechanical interface
The two SECIS cameras are connected to the Lomnicky Peak coronagraph using a new, special opto-mechanical interface.
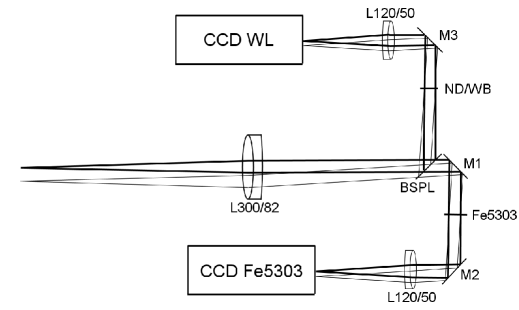
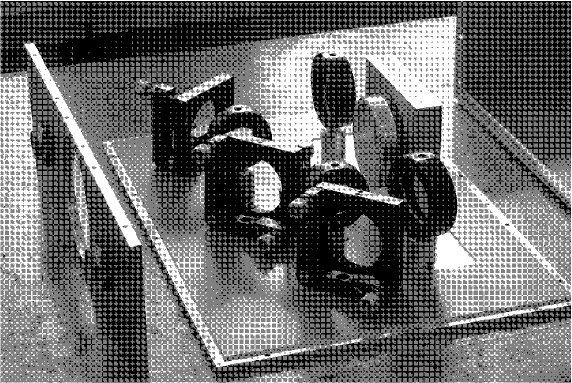
The optical set-up is shown schematically in Fig. 1, with Fig. 2 showing the components in the rigid light-tight box. The coronal image formed by the coronagraph is to the left in Fig. 1, at the focus of the entrance lens (marked L300/82 in Fig. 1: diameter and focal length are D=82 mm, f=300 mm). This lens forms a parallel light-beam which then passes to a beam splitter (BSPL, shorter dimension = 50 mm). The reflected beam from the beam splitter then passes through a broad-band and neutral density filter combination (marked “ND/WB filter” in the figure), is reflected again from a flat mirror (M3), and finally is brought to a focus on to the CCD camera (marked “CCD WL”) by an achromatic lens (L120/50). The parallel beam transmitted by the beam splitter is reflected by a flat mirror (M1), passes a narrow-band FeXIV 530.3 nm interference filter (“Fe5303”), is reflected by a second flat mirror (M2), then brought to a focus on to the CCD camera (marked “CCD Fe5303”) by the acromatic lens (L120/50). Fig. 1 shows the ray diagram for the configuration. In this figure, an on-axis pair of rays is shown by thick lines. The thin lines represent rays from one extreme of the coronagraph image. The angle between them (greatly exaggerated in the figure) is no more than about 0.5 degrees. With such a small angle, a negligible wavelength shift is produced by the interference filter (Fe5303).
The optical system was designed taking into account the actual optical parameters of the Lomnicky Peak coronagraph and the desired spatial scale of the images on the CCD chips. It was optimized to avoid any vignetting (to keep entire fields of view as bright as possible) and to limit geometric or chromatic aberrations of the system. In order to minimize the total cost of the interface, all optical and mechanical elements as well as adjustable optical mounts were general-purpose stock elements, selected from the Melles Griot company catalogue.
The beam splitter (BSPL) reflects only 10% of the light to the broad-band channel, transmitting the remaining light to the narrow-band (green-line) channel. The broad-band filter was selected to be centred on the green line wavelength but having a larger range of transmission (central wavelength 530.0 nm, bandpass FWHM 10 nm). A neutral-density filter (ND) in the white-light optical channel was selected to ensure equal exposure times in the narrow-band and broad-band channels. Final images in both channels are formed by lenses with the same focal lengths, so giving the same spatial scale.
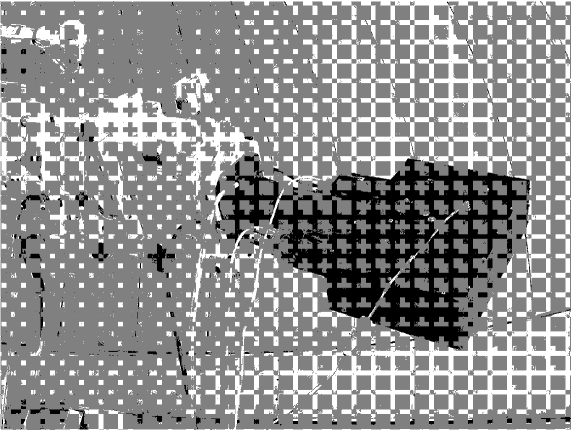
The entire optical system is mounted in a rigid box attached to a rear plate of the coronagraph. A light-tight black aluminium box acting as a rigid optical frame for the optical components was manufactured by the workshop of the Astronomical Institute at the University of Wrocław (Fig. 2). The optical system was assembled and pre-aligned in the box; apart from focusing of the system, no other special alignments of the optical components are needed at the telescope (Fig. 3).
3.3 Narrow-band filter
Three narrow-band filters with passbands around the FeXIV 530.3 nm green line are available (two made by Barr Associates, Inc., and one by Andover Corporation). All filters have FWHM passbands of nm and diameters of 50 mm. The filter chosen for use in the optical system is fitted with a thermostatic device to maintain the required temperature under variable ambient temperatures.


3.4 SECIS instrument
The SECIS instrument was built, tested, and calibrated between 1997 and 1999 in a British–Polish collaboration to search for short-period coronal light oscillations. It was used with great success during the total eclipse seen from Bulgaria in 1999, from Zambia in 2001 (see Phillips et al., 2000; Williams et al., 2001; Williams et al., 2002; Rudawy et al., 2004), and most recently from Libya in 2006.
The CCD cameras (manufactured by EEV, Chelmsford, U.K.) are high-performance cameras designed specifically for scientific and machine vision applications. The image sensor is a monochrome 512512 pixel frame transfer CCD. This device has square (15m m) pixels, and can be driven at a non-interlaced frame rate up to 70 frames per second. The cameras digitise the signal from the CCD to nominally 12 bits and provide a real dynamic range of over 1000:1. The camera electronics operate the cameras in an “asynchronous” mode, where a trigger pulse from the control electronics commands one of the cameras to capture an image at a precise moment and with a precise exposure period. This feature allows the two cameras to capture accurately synchronised images. The data are captured and stored on a personal computer.
The computer system captures the synchronised digital video streams from the two CCD cameras and reconstitutes the video images, storing them for more detailed analysis. The computer has dual Pentium processors, 128 megabytes of memory, and four 9 GB disk drives. It is able to run a set of observations consisting of up to about 10000 images for each camera. The image processing software allows the replay of the video, and the cropping to sub-sequences and regions of interest. These selections can then be exported to files in FITS format. More detailed information about SECIS and its first scientific application are described by Phillips et al. (2000).
Since 2003 SECIS has also been used for making high time resolution spectral observations of solar flares over the profile of the H- (656.3 nm) line using the Multi-Channel Subtractive Double Pass (MSDP) imaging-spectrograph (Mein, 1977 and 1991) and Large Coronagraph (with 530 mm main objective) or Horizontal Telescope (with 150 mm main objective) installed at Białkow Observatory (Astronomical Institute at the University of Wrocław) (Radziszewski et al., 2006, 2007a, 2007b, 2008).
4 Test measurements
Preliminary tests of the entire system were performed in April 2009, though the lack of solar activity at that time meant that no prominent coronal structures were detectable.
4.1 Filter tests
The filters manufactured by Barr Associates, Inc., have 50 mm clear diameter and have quarter-wave flatness specification. They are coated with ion-assist refractory oxide coatings that greatly reduce the wavelength shift with ambient temperature and filter longevity and produce higher transmittance.
To investigate possible degradation since their last use during the 2006 eclipse, the filter passband widths and central wavelengths were tested for thermal stability using disk centre solar light and a small spectrograph with a dispersion of 0.9 nm/mm connected directly to the coronagraph (Minarovjech, 2009). Examples of the mean reference disk centre spectra taken with and without the narrow-band filter are shown in Fig. 4. The tests showed that the filters have to be heated to a fairly high temperature (45–50 degrees Celsius) in order to tune the filter passband to the green-line wavelength.
The dependence of the main passband parameters on the filter temperature is displayed in Fig. 5. First, the filter passband transmission, the width (FWHM) of its passband, and its central wavelength averaged over the length (7.2 mm) of the spectrograph slit were examined as a function of filter temperature; these are indicated by the thick lines in Fig. 5. These measurements show that a typical maximum transmission of the filters is 10 %, and that the FWHM of the passband is about 0.31 nm for an ambient temperature resulting in the filter central wavelength to equal the green line wavelength. By taking short lengths of 0.8 mm at nine positions along the spectrograph slit (which is aligned along the radial direction of the filter), we also examined the variation of the same quantities as a function of radial distance over the filter; these are the thin lines plotted in Fig. 5. There is a similar dependence on temperature in these individual measurements to the averaged results. The filter passband transmission varies by up to about 10 % from the mean value, the passband wavelength position by up to 0.02 nm, and the passband width by up to only 4 %. The background is very stable apart from one outlying measurement.
4.2 Data tests
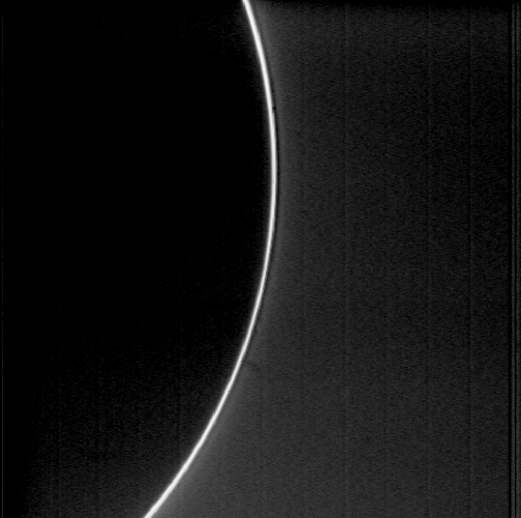
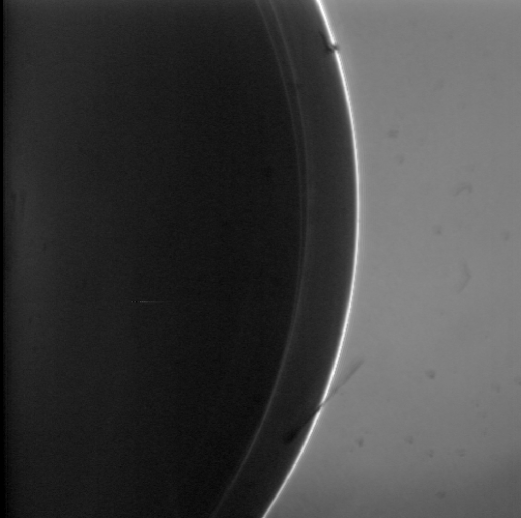
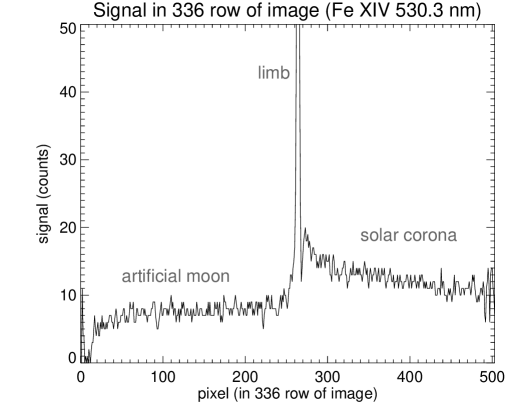
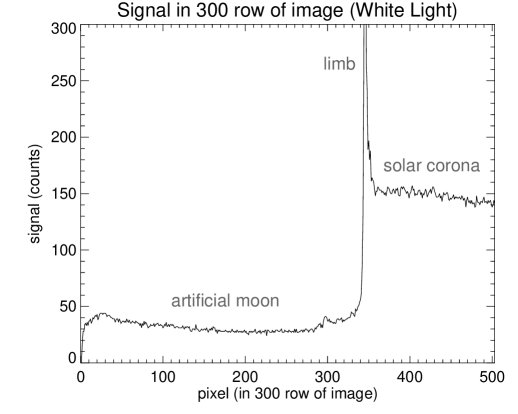
Test observations were taken in both the broad-band and narrow-band channels. With solar activity at an extremely low level, no coronal structures were visible in the green line at that time (2009 April 7 at 06:40 UT) but the tests were nevertheless useful in that the optical and photometric quality of the data could be examined. Examples of snapshots selected from the data in both channels are shown in Figs. 6 and 7. Inspection of the images shows that the image quality was very good. Moreover, the different character of the radial gradients illustrates the very good spectral blocking of the narrow-band filter. The internal instrumental scattered light in the coronagraph and all the optical parts of SECIS was found to be sufficiently low to allow the required data acquisition. This confirms that the instrument itself is ready to measure prominent active region coronal loops above the solar limb when they appear under “coronal” skies, i.e. with low degree of light scatter by the Earth atmosphere. More detailed inspection of the data (Figs. 8 and 9) shows that the noise level was low. The photon count level in the narrow-band channel within the portion of the image occupied by the artificial Moon was measured to be at a very low level, averaging 8 DN s-1, only slightly more than the dark current level of 2–3 DN s-1. A bright coronal active region is expected to have a high signal-to-noise ratio, though experience from the 1999 and 2001 eclipses with the SECIS cameras suggests that the cameras are very unlikely to reach saturation levels.
5 Conclusion
The SECIS instrument installed at the Lomnicky Peak Observatory Lyot coronagraph will allow data to be acquired that may result in an improved knowledge of where in the corona MHD waves are generated and/or dissipated. In particular, the signatures of high-frequency MHD waves involved in coronal heating may be observed. A considerable improvement in our knowledge of a long-standing problem of solar physics could be made by such observations, with implications for the physics of active regions, flares, the solar wind, and solar activity, as well as mechanisms of solar-terrestrial relationships.
Acknowledgements.
We acknowledge the anonymous referee for comments which helped to improve the paper. The work of J. A. and J. R. was supported partly by the Slovak Research and Development Agency under the contract No. APVV-0066-06 which also covered all expenses related to the SECIS instrument at the Lomnicky Peak Observatory (Slovakia). Authors are obliged for the support of the Astronomical Institute, Slovak Academy of Sciences staff, namely assistants K. Maník, R. Mačura, P. Havrila, P. Bendík, and the workshop assistant J. Klein. P.R. was supported by the Polish Ministry of Science and Higher Education, grant number N203 022 31/2991. This research has made use of NASA’s Astrophysics Data System.References
- [1] \articleAschwanden, M., Schrijver, C., Alexander, D.2001 ApJ5501036 \bookAschwanden, M.2004Physics of the Solar Corona: An Introduction SpringerBerlin \articleBerlicki, A., Schmieder, B., Vilmer, N., Aulanier, G., Del Zanna, G.2004\aaa4231119 \inproceedingsBerlicki, A., Schmieder, B., Heinzel, P., Li, H., Del Zanna, G., Rudawy, P.2005The Dynamic Sun: Challenges for Theory and ObservationsD. Danesy, S. Poedts, A. De Groof J. Andries ESA, ESTECNoordwijk58 \bookBray, R., Cram, L., Durrant, C., Loughead, R.1991 Plasma loops in the solar coronaCambridge University PressCambridge \articleCowsik, R., Singh, J., Saxena, A.K., Srinivasan, R., Raveendran, A. V.1999\sph18889 \articleEdlen, B.1942Zs. Ap.2230 \articleFalewicz, R., Rudawy, P.1999\aaa344981 \bookGolub, L., Pasachoff, J.1997The solar corona Cambridge University PressCambridge \articleGrotrian, W.1939Naturwissenschaften27214 \articleHeyvaerts, J., Priest, E.1983\aaa117220 \articleHollweg, J.1981\sph7025 \articleKlimchuk, J.2006\sph23441 \articleKoutchmy, S., Belmahdi, M., Coulter, R., Demoulin, P., Gaizauskas, V., MacQueen, R.M., Monnet, G., Mouette, J., Noens, J.C., November, L.J.1994\aaa281249 \articleLexa, J.1963Bull. astr. Inst. Czechosl.14107 \articleMinarovjech, M.2009private communucation \articleMein, P.1977\sph5445 \articleMein, P.1991\aaa248669 \articleNarain, U., Ulmschneider, P.1990Space Sci. Rev.54377 \articleNarain, U., Ulmschneider, P.1996Space Sci. Rev.75453 \articleParker, E.1972J. Plasma Phys.949 \articleParker, E.1983ApJ264642 \articleParker, E.1988ApJ330474 \articleParnell, C.E., Jupp, P.E.2000ApJ529554 \articlePasachoff, J., Landman, D.1984\sph90325 \articlePasachoff, J.M., Babcock, B., Diaz, J.S., Reardon, K., Nichols-Kiley, R.1995Bulletin of the American Astronomical Society 271427 \articlePasachoff, J.M., Babcock, B., Russell, K.D., McConnochie, T.H., Diaz, J. S.2000\sph195281 \articlePasachoff, J.M., Babcock, B.A., Russell, K.D., Seaton, D.B.2002 \sph207241 \bookPhillips, K.J.H.1995Guide to the Sun Cambridge University PressCambridge \articlePhillips, K.J.H., Read, P., Gallagher, P., Keenan, F.P., Rudawy, P., Rompolt, B., Berlicki, A., Buczylko, A., Diego, F., Barnsley, R., Smartt, R.N., Pasachoff, J.M., Babcock, B.A.2000\sph193259 \articlePorter, L., Klimchuk, J., Sturrock, P.1994ApJ435482 \articleRadziszewski, K., Rudawy, P., Phillips, K.J.H., Dennis, B.R. 2006\asr371317 \articleRadziszewski, K., Rudawy, P., Phillips, K.J.H.2007a\aaa 461303 \articleRadziszewski, K., Rudawy, P.2007b Central European Astrophysical Bulletin3167 \articleRadziszewski, K., Rudawy, P.2008 Annales Geophysicae262991 \articleRoberts, B.2000\sph193139 \articleRudawy, P., van Driel-Gesztelyi, L., Cader-Sroka, B., Mein, P., Mein, N., Schmieder, B., Malherbe, J.-M., Rompolt, B. 1999\aaas13989 \articleRudawy, P., Falewicz, R.; Mandrini, C. H., Siarkowski, M.2001 \aaa3721030 \inproceedingsRudawy, P., Phillips, K.J.H., Read, P.D., Gallagher, P.T., Rompolt, B., Berlicki, A., Williams, D., Keenan, F.P., Buczylko, A.2002Proc. 10th European Solar Physics Meeting Solar Variability: From Core to Outer FrontiersA. Wilson ESA SP-506, ESA, ESTECNoordwijk967 \articleRudawy, P., Phillips, K.J.H., Gallagher, P., Williams, D.R., Rompolt, B., Keenan, F.P.2004\aaa4161179 \inproceedingsRušin, V., Minarovjech, M.1991Mechanisms of Chromospheric and Coronal Heating P. Ulmschneider, E.R. Priest, and R. RosnerSpringerBerlin30 \inproceedingsRušin, V., Minarovjech, M.1994Solar coronal structures V. Rušin, P. Heinzel, and J.-C.VialVedaBratislava487 \inproceedingsRybák, J., Kučera, A., Curdt, W., Wöhl, H.2004 Proceedings of the SOHO 15 Workshop - Coronal Heating R.W. Walsh, J. Ireland, D. Danesy, B. FleckESA SP-575, ESA, ESTEC Noordwijk529 \articleSingh, J., Hasan, S.S., Gupta, G.R., Banerjee, D., Muneer, S., Raju, K.P., Bagare, S.P., Srinivasan, R.2009 \sph260125 \articleTomasz, F., Rybák, J., Kučera, A., Curdt, W., Wóhl, H.2005 Hvar Observatory Bulletin29197 \articlevan Ballegooijen, A.1986ApJ3111001 \articleWilliams, D., Phillips, K.J.H., Rudawy, P., Mathioudakis, M., Gallagher, P.T., O’Shea, E., Keenan, F.P., Read, P., Rompolt, B. 2001MNRAS326428 \articleWilliams, D., Mathioudakis, M., Gallagher, P., Phillips, K.J.H., McAteer, R.T.J., Keenan, F.P., Rudawy, P., Katsiyannis, A.C.2002 MNRAS336747 \articleWithbroe, G., Noyes, R.1977Annual Review of Astronomy and Astrophysics15363 \articleZirker, J.B.1993\sph14843