Neutron removal cross section as a measure of neutron skin
Abstract
We study the relation between neutron removal cross section () and neutron skin thickness for finite neutron rich nuclei using the statistical abrasion ablation (SAA) model. Different sizes of neutron skin are obtained by adjusting the diffuseness parameter of neutrons in the Fermi distribution. It is demonstrated that there is a good linear correlation between and the neutron skin thickness for neutron rich nuclei. Further analysis suggests that the relative increase of neutron removal cross section could be used as a quantitative measure for the neutron skin thickness in neutron rich nuclei.
pacs:
21.10.Gv, 25.70.Mn, 21.60.-nNeutron rich nuclei are expected to have a neutron skin due to the neutron excess and the Coulomb barrier which suppresses the proton density at the nuclear surface. The thickness of neutron skin is defined as the difference between the root-mean-square (RMS) neutron and proton radii, i.e. . The neutron skin thickness dependents on the properties of the equation of state (EOS) of neutron rich matter. More neutrons are pushed to the nuclear surface with higher pressure, which will form thicker neutron skin.
It has been show that is found to be related to a constraint on the nuclear EOS within framework of Skyrme Hartree-Fock (SHF) and relativistic mean-field (RMF) theories brow00 ; furn02 ; yosh04 . Strong linear correlations between and (the slope of symmetry energy coefficient ), the ratio ( is the symmetry energy coefficient at the saturation density ), ( is the symmetry energy coefficient of finite nuclei) are demonstrated brow00 ; furn02 ; yosh04 ; dani03 ; chen05 ; cent09 . The constraint on EOS is important for improving our knowledge of neutron rich matter and extrapolating the EOS to higher neutron density, and has strong impact on the property of neutron stars. It was shown that is crucial for the transition density from nonuniform to uniform neutron rich matter in the crust of neutron star horw01 . Reliable neutron densities are needed as input for atomic parity violation experiments poll99 .
Due to the significance of for studying structure of neutron rich nuclei, property of neutron rich matter and neutron star etc., measurement of has become a very important subject in the forefront of nuclear physics research. It is remarkable that such a measurement is so important for investigating the property of very small entities like atomic nuclei as well as very big objects like neutron stars. As we know, the proton radius of the nucleus can be determined with a very high accuracy through the electron scattering measurement fric95 . However, the experimental accuracy of neutron radius is much lower compared with that of the proton radius so far.
Recently, some methods have been proposed or used to measure the radius of neutron distribution. A model independent method using parity violating electron scattering to measure the neutron radius of 208Pb to 1% accuracy (0.05 fm) was proposed at JLab horo01 . There are methods to extract neutron densities from proton-nucleus elastic scattering and antiprotonic atom data kara02 ; clar03 ; brow07 ; trzc01 . Another method of using the relationship between the nuclear matter radius and the reaction cross section () was shown suzu95 . But it is also useful to have alternative methods of obtaining directly. The dependence of neutron removal cross section () on the neutron skin thickness was studied and strong linear correlation was observed mach08 . In this work, it is demonstrated that the relative increase of neutron removal cross section could be used as a quantitative measure for by using the statistical abrasion ablation (SAA) model .
The SAA model was developed by Brohm et al to describe heavy ion collisions at high energies in a picture of quasi-free nucleon-nucleon (N-N) collisions broh94 . This model takes independent N-N collisions for participants in an overlap zone of the two colliding nuclei and determines the distributions of abraded neutrons and protons. The spectators outside the overlapping region are left to move almost without being disturbed. The probability of abrading zero nucleons is calculated and the resulting energy-dependent reaction cross section turns out to be equivalent to the successful microscopic Glauber-type calculation. It has been demonstrated that the SAA model can reproduce the experimental fragment production cross section of heavy ion collisions very well blan95 ; jong98 and is useful for studying the isospin effect and isoscaling behavior of projectile-like fragments fang01 ; fang07 in heavy ions reactions. Here we give a brief description of the SAA model. Its details can be found in Ref. broh94 .
In SAA model, nuclear reaction is described as two stages which occur in two different time scales. The first stage is abrasion process which describes the production of pre-fragment with certain excitation energy () through the N-N collisions in the overlap zone of the colliding nuclei. The collisions are described by a picture of interacting tubes. Assuming a binomial distribution for the absorbed neutrons and protons of projectile in the interaction of a specific pair of tubes, the distributions of the total abraded neutrons and protons are determined. For an infinitesimal tube in the projectile, the transmission probabilities for neutrons (protons) at a given impact parameter are calculated by broh94
| (1) |
where is thickness function of the target, which is normalized by and with and referring to the neutron and proton number in the target respectively, the vectors , and are defined in the plane perpendicular to the beam, and is the free nucleon-nucleon cross sections (k′, kn for neutron and k′, kp for proton). The thickness function of the target is given by
| (2) |
with being the neutron (proton) density distribution of the target. The thickness function of the projectile is defined in the same way. When the thickness function is used in the calculation, the variable equals for the target and equals for the projectile. So the average abraded mass at a given impact parameter is calculated by the expression
| (3) |
where and are the average abraded neutron and proton number at impact parameter , is thickness function of the projectile. The integrals extend over the plane perpendicular to the beam direction. In a similar way, the variance of can be determined by summing the variances of all the binomial distributions for the tubes pairs,
| (4) |
Higher moments of the distributions of abraded neutrons and protons could be obtained similarly. However, for the present purpose, sufficient information is provided by the first and second moments. In addition, the probability for zero nucleon loss is important because it is related to the reaction cross section. The deduced total transmission probability and reaction cross section are broh94
| (5) |
| (6) |
The production cross section for a specific fragment can be calculated from
| (7) |
where , are the number of abraded neutrons and protons from the projectile. and are the probability distributions for the abraded neutrons and protons at a given impact parameter , respectively. These probability distributions are determined by a superposition of different binomial distributions.
The second stage is evaporation process in which the system reorganizes due to excitation. It deexcites and thermalizes by emission of neutron, proton and other light particles using the statistical model gaim91 . The excitation energy for projectile spectator is estimated by a simple relation of MeV where 13.3 is a mean for an abraded nucleon from the projectile. This was given by the statistical hole-energy model as described in Ref. gaim91 . After the evaporation stage, we can obtain the final fragments which are comparable to the experimental data.
For the density distributions of the projectile and target, harmonic-oscillator (HO) distributions are suitable for light nuclei but it is more reasonable to use the Fermi distribution for heavier mass system ozaw01 . In our calculations, the Fermi distributions are used for neutron and proton, respectively. They have the following form
| (8) |
where is the normalization constant which ensures that the integration of the density distribution equals the numbers of neutron (=n) and proton (=p); is the diffuseness parameter; is the half the density radii and determined by droplet model myer83
| (9) |
with , being the equivalent sharp surface radii of neutron and proton. and are given by the droplet model.
Neutron removal cross section () is defined as the summation of production cross sections for fragments with the same proton number as the projectile, but less neutron number than the projectile, i.e. collision processes with one or more neutrons being removed from the projectile:
| (10) |
where is the neutron number of the projectile. is the fragment production cross section with and given by Eq. (7). It should be pointed out that decreases very quickly as increases. The value of will be very close to zero for most projectiles. Since the charge number of the fragments equals to that of the projectile, it indicates that peripheral reactions will be the main contributions of . Thus maybe sensitive to the neutron distribution in the nuclear surface. Since the reaction cross section reflects the information about the overall size of a nucleus, of Na isotope determined by the interaction cross section () has an error in the order of fm when the error of is around 15% suzu95 . Below we will demonstrate that determining through measurement may reduce the uncertainty.
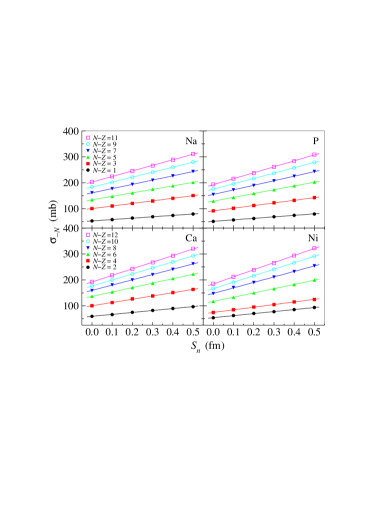
In Ref. trzc01 , Trzcińska et al found that the half density radii for neutrons and protons in heavy nuclei were almost the same, but the diffuseness parameter for neutrons was larger than that for protons. To study the dependence between and , the neutron diffuseness parameter in the droplet model is changed to obtain different value of for a nucleus. Six values of varying from 0.0 fm to 0.5 fm with step of 0.1 fm are chosen. Different values of are obtained in the SAA calculation with different of the projectile. Thus we can obtain the correlation between and .
In this work, calculations have been done for 23,25,27,29,31,33Na, 31,33,35,37,39,41P, 42,44,46,48,50,52Ca and 58,60,62,64,66,68Ni projectiles on 12C target at 1 GeV. The results are shown in Fig. 1. When varies from 0.0 fm to 0.5 fm, we can see that is increasing linearly for all the isotopes calculated. As its definition shows, is determined by the radii of protons and neutrons. Since most nuclei have precise proton radii, the value of neutron removal cross section for or () could be calculated by the SAA model using the experimental data . To study the relative increase of with respect to , we define a difference factor
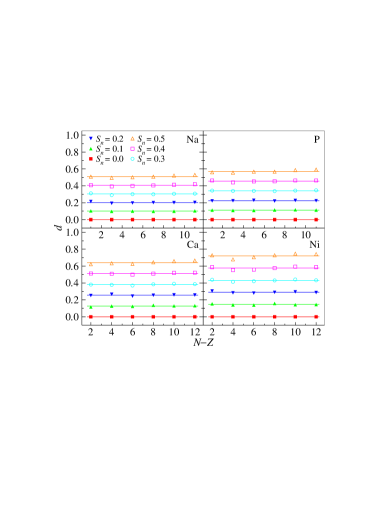
| (11) |
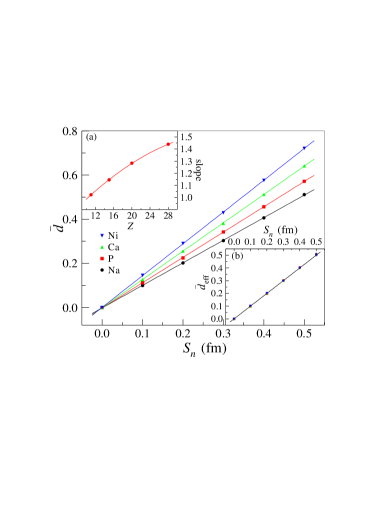
The systematic behavior of with respect to for all the isotopes are calculated and shown in Fig. 2. From this figure, we found that the values of for one isotope is almost constant as the horizontal lines showing, especially for fm. For one isotope with same neutron skin thickness, the mean uncertainty of is less than for fm. It indicates that the relative increases of with respect to are almost same for one isotope having different neutron excess () when the neutron skin thickness changes from 0 fm to 0.4 fm. The mean values of for one isotope increase as increases. We denote this mean value of by . The dependence of on for the four isotopes are shown in Fig. 3. Clear linear relationship between and can be seen. We fitted the calculated results by using a function of . The dependence of the obtained slope parameters on the charge number of the isotope is plotted in the inset (a) of Fig. 3. A second order polynomial function was used to fit the results. Then we define an effective difference factor
| (12) |
with being the fitted function. The reduced of the fit is . From the dependence of on as shown in the inset (b) of Fig. 3, always equals the neutron skin thickness for all the nuclei. If we could extract from experimental measurements, then the neutron skin thickness could be determined. To calculate , and are necessary. can be determined by the SAA model if we have the experimental proton radii data. Thus if is measured experimentally, we could obtain . This indicates that can be extracted from the experimental measurement of . The accuracy of the extracted is mainly determined by the uncertainty of . Estimation based on Fig. 3 show that 5 error of corresponds to around 0.05 fm error in for Na isotopes. If the error of could be smaller, then the uncertainty of the deduced could become smaller also.
Based on above discussion, a general phenomenon is shown that and have strong linear correlation for neutron rich nuclei. Owing to the small uncertainty of extracted from data, could be used as a observable to determine . So we propose to use as a new observable to extract experimentally. But it should be pointed out that Pygmy Dipole Resonance (PDR) exists in neutron rich nuclei, which has been interpreted as a resonant oscillation of neutron skin against the remaining isospin saturated neutron-proton coreleis01 ; piek06 ; vret08 . In this excitation mode, the Fermi distribution could not describe the nuclear densities of neutron rich nuclei. We are focusing on the relationship between and , similar correlation will also exist even if the shape of density distribution is different since the RMS radii of neutron and proton are quantities describing the averaged distribution radii of the nucleon. Further investigations on the effect of the density shape over and the uncertainty of the deduced should be done.
In summary, we have studied the relation between neutron removal cross section and neutron skin for neutron rich nuclei using SAA model. Strong linear correlation between and the neutron skin thickness for neutron rich nuclei have been observed. Thus measuring will be a very good method for studying the neutron skin size in nuclear surface. By defining an effective difference factor, further analysis suggests that the neutron skin thickness could be extracted from the experimental measurement of . We find that the uncertainty of deduced from data is quite small. So we propose to use as a new quantitative measure for neutron skin thickness in neutron rich nuclei.
This work is supported by National Natural Science Foundation of China under contract No.s 10775168, 10775167, 10979074 and 10975174, Major State Basic Research Development Program in China under contract No. 2007CB815004, Knowledge Innovation Project of Chinese Academy of Sciences under contract No. KJCX3.SYW.N2, and the Shanghai Development Foundation for Science and Technology under contract No. 09JC1416800.
References
- (1) B. A. Brown, Phys. Rev. Lett 85, 5296 (2000).
- (2) R. J. Furnstahl, Nucl. Phys. A706, 85 (2002).
- (3) S. Yoshida and H. Sagawa, Phys. Rev. C 69, 024318 (2004).
- (4) P. Danielewicz, Nucl. Phys. A727, 233 (2003).
- (5) L. W. Chen, C. M. Ko, and B. A. Li, Phys. Rev. C 72, 064309 (2005).
- (6) M. Centelles et al., Phys. Rev. Lett. 102, 122502 (2009).
- (7) C. J. Horowitz and J. Piekarewicz, Phys. Rev. Lett 86, 5647 (2001).
- (8) S. J. Pollock and M. C. Welliver, Phys. Lett. B 464, 177 (1999).
- (9) G. Fricke et al., At. Data Nucl. Data Tables 60, 177 (1995).
- (10) C. J. Horowitz et al., Phys. Rev. C 63, 025501 (2001).
- (11) S. Karataglidis et al., Phys. Rev. C 65, 044306 (2002).
- (12) B. C. Clark, L. J. Kerr, and S. Hama, Phys. Rev. C 67, 054605 (2003).
- (13) B. A. Brown et al., Phys. Rev. C 76, 034305 (2007).
- (14) A. Trzcińska et al., Phys. Rev. Lett. 87, 082501 (2001).
- (15) T. Suzuki et al., Phys. Rev. Lett. 75, 3241 (1995).
- (16) C. W. Ma et al., Chin. Phys. B 17, 1216 (2008).
- (17) T. Brohm and H. H. Schmidt, Nucl. Phys. A569, 821 (1994).
- (18) B. Blank et al., Nucl. Phys. A588, 171c (1995).
- (19) M. de Jong et al., Nucl. Phys. A628, 479 (1998).
- (20) D. Q. Fang et al., Eur. Phys. J. A 10, 381 (2001).
- (21) D. Q. Fang et al., J. Phys. G. 34, 2173 (2007).
- (22) J. J. Gaimard and K. H. Schmidt, Nucl. Phys. A531, 709 (1991).
- (23) A. Ozawa, T. Suzuki, and I. Tanihata, Nucl. Phys. A693, 32 (2001).
- (24) W. D. Myers and K. H. Schmidt, Nucl. Phys. A410, 61 (1983).
- (25) A. Leistenschneider et al., Phys. Rev. Lett. 86, 5442 (2001).
- (26) J. Piekarewicz, Phys. Rev. C 73, 044325 (2006).
- (27) D. Vretenar, N. Paar, T. Marketin and P. Ring, J. Phys. G. 35, 014039 (2008).