Terzan 5: an alternative interpretation for the split horizontal branch
Abstract
We consider the horizontal branch (HB) of the Globular Cluster Terzan 5, recently shown to be split into two parts, the fainter one (mag) having a lower metallicity than the more luminous. Both features show that it contains at least two stellar populations. The separation in magnitude has been ascribed to an age difference of 6 Gyr and interpreted as the result of an atypical evolutionary history for this cluster. We show that the observed HB morphology is also consistent with a model in which the bright HB is composed of second generation stars that are metal enriched and with a helium mass fraction larger (by 0.07) than that of first generation stars populating the fainter part of the HB. Terzan 5 would therefore be anomalous, compared to most “normal” clusters hosting multiple populations, only because its second generation is strongly contaminated by supernova ejecta; the previously proposed prolonged period of star formation, however, is not required. The iron enrichment of the bright HB can be ascribed either to contamination from Type Ia supernova ejecta of the low–iron, helium rich, ejecta of the massive asympotic giant branch stars of the cluster, or to its mixing with gas, accreting on the cluster from the environment, that has been subject to fast metal enrichment due to its proximity with the galactic bulge. The model here proposed requires only a small age difference, of 100 Myr.
1 Introduction
Recent years have witnessed exciting developments both in the observations and theoretical modelling of the abundance star to star variations within most of the well studied Globular Clusters (GCs). In most GCs star to star abundance variations are limited to the light elements that are susceptible to abundance changes from proton-capture reactions, such as the pp, CN, ON, NeNa, and MgAl cycles (for the most recent spectroscopic survey, see, e.g. Carretta et al., 2009a, b), but a few clusters, such as M22 (Marino et al., 2009), or perhaps NGC 1851 (Han et al., 2009) are now known to exhibit variations in heavier elements (see also Carretta et al., 2009c), and, more than the others, in Cen the heavy elements spreads (e.g., among others Norris & Da Costa, 1995), and the HR diagram morphologies clearly show that we are dealing with several stellar generations, enriched by the supernova (SN) ejecta (e.g. Sollima et al., 2005; Villanova et al., 2007). In addition, the cluster M 54, immersed in the nucleus of the Sagittarius dwarf galaxy, presently disrupting in our Galaxy (Ibata et al., 1994; Bellazzini et al., 2008) has been recently found to show a metallicity spread similar to Cen (Carretta et al., 2010)
Concerning the spread in light elements, their observation at the turnoff and among the subgiant stars (e.g., Gratton et al., 2001) showed that these anomalies must be attributed to self–enrichment occurring at the first stages of the life of the cluster. The most peculiar finding of the latest years is the presence of a very helium rich population in the most massive clusters: this is revealed by the presence of multiple main sequences in Cen and NGC 2808, indicating a helium content Y=0.38–0.40 (Norris, 2004; D’Antona et al., 2005; Piotto et al., 2007), and by the extreme morphology of the horizontal branch (HB) of the two massive clusters NGC 6388 and NGC 6441. In these latter clusters, a red clump is expected as HB, due to their large metallicity ([Fe/H]–0.4, see Carretta et al., 2009c). On the contrary, their HB is extended towards the blue, and the RR Lyr variables have so long periods that they must be highly overluminous. Caloi & D’Antona (2007) and D’Antona & Caloi (2008) show that the HB morphology and RR Lyr’s periods of these two clusters may be explained if a large fraction of the HB stars have Y0.35. The presence of much more moderate helium spreads is probable in most of the other smaller clusters (e.g. D’Antona & Caloi, 2008). The quasi–constancy of heavy metals in most GCs leads to hypothesize that the abundance variations must be due to very peculiar chemical evolution, not or scarcely affected by SN ejecta, but involving formation of a “second generation” (SG) of stars from matter processed into the “first generation” (FG) stars. On the other hand, the numerical consistency of the SG is so high (50% D’Antona & Caloi, 2008; Carretta et al., 2009a) that any formation model must include the hypothesis that the mass contained in FG stars —that contribute to this second phase of star formation— is initially much larger than the mass present today in the cluster. Models for the formation of these multiple generations are still in their infancy. We can divide them into two main categories: the models in which clusters are born inside dwarf galaxies, so that the polluting matter on the forming GC comes from a much larger environment (e.g. Bekki et al., 2007), and the models in which there is an initial cluster 10–20 times more massive than todays’. In the latter case, the SG forms from the ejecta of the FG stars mainly in the central cluster parts, and the first dynamical phases of evolution lead to a preferential loss of the FG stars (D’Ercole et al., 2008). In these models, it is very difficult to accomodate large age differences between the first and second generation stars.
Consequently, the recent observations of the color magnitude diagram features and chemistry of Terzan 5 may constitute a benchmark in our understanding of GC formation. In fact, Ferraro et al. (2009) show that the cluster HB stars are divided into two clumps separated by Mmag, and that the more luminous stars have a much larger iron content ([Fe/H]+0.30.1) with respect to the lower HB ([Fe/H]–0.20.1). This result shows that the evolution of this cluster is atypical, and that matter forming the SG stars (populating the upper HB clump), has been affected by SN contamination, as it occurred in Cen. On the other hand, Ferraro et al. (2009), comparing the HB data to stellar isochrones of the correct metallicity, conclude that the SG must be 6 Gyr younger than the FG. This huge age difference is very difficult to be understood in any formation framework, and this would be the first evidence for such a young age among bulge stars and clusters (e.g. Feltzing & Gilmore, 2000; Origlia et al., 2008).
We re–examine the problem and show that the HB morphology can also be explained by two coeval populations having an helium difference of Y, thus reaching a value not as extreme as in the cases quoted above, so its formation does not present particular problems (Sect. 4). At the super–solar metallicity of the SG of Terzan 5 the possible helium enrichment in the SG does not produce a blue extension of the HB. In Sect. 4 we discuss some possibilities for the chemical evolution of the cluster. We finally remark that the different space distribution of the two populations might imply a mass difference between them, and that further observations and dynamical modelling may allow to choose between models based on age– or helium–differences.
2 The stellar models
We computed evolutionary tracks, isochrones and HB tracks for a metallicity Z=0.01 (having [Fe/H]–0.2 for a solar–scaled mixture) and helium content Y=0.26, representing the FG of Terzan 5 and its lower HB clump, and models and isochrones for Z=0.03 ([Fe/H]+0.3), Y=0.29 and Y=0.40. The standard inputs of our evolutionary code ATON are used (Ventura et al., 2009). We adopt the opacities by Ferguson et al. (2005) at temperatures lower than 10000 K and the OPAL opacities in the version documented by Iglesias & Rogers (1996). The mixture adopted is solar–scaled and follows the element distribution by Grevesse & Sauval (1998). For comparison, we also computed models for iron content [Fe/H]–0.2 and [/Fe]=0.4. Electron conduction opacities follow the treatment by Potekhin et al. (1999), and are harmonically added to the radiative opacities. The HB models are constructed by assuming the core helium mass derived from the red giant evolution of masses evolving in the range of ages 10–13Gyr for the given Z and Y. The values assumed are then =0.4793 for Z=0.01 and Y=0.26; =0.464 for Z=0.03, Y=0.29 and =0.448for Z=0.03 and Y=0.40. From the isochrones we derive the mass at the tip of the giant branch for each age and chemical composition. These values are used to build up synthetic models of HB, following the procedure described by D’Antona & Caloi (2008). The mass lost along the red giant branch and its dispersion are fixed for each given age, in order to derive the distribution of HB masses. A further random extraction of the age within the HB lifetime allows to populate the synthetic HB. We fix the FG population at the chemistry Y=0.26, Z=0.01, and the SG at Z=0.03. The helium content of the SG was allowed to vary between 0.29 and 0.40, but we assume the same mass loss for both populations. The theoretical values of luminosity and are converted into the Johnson–Bessell system by means of Bessell et al. (1998).
3 The HB morpology of Terzan 5: two possible interpretations
We start by discussing in this section an example that just serves to illustrate how an increase in the helium abundance can explain the difference in K magnitude between the two clumps in Terzan 5. Figure 1 shows a representation of the results that allows to graphically visualize both Ferraro et al. (2009) conclusion and a different interpretation of the data proposed here. In the right panel of Fig.1 we shows the HB mass versus age relations 111We plot the mass at the tip of the red giant branch, that is a decreasing function of age, minus 0.3, in order to provide an example of what may be the masses populating the HB. and on the left panel we plot the HB mass versus the absolute magnitude MK of the ZAHB. Let us try to understand why we need Gyr of age difference, if we assume (Z=0.01, Y=0.26) as composition of the faint clump and (Z=0.03, Y=0.29) for the brighter one (Ferraro et al., 2009). Assume that the age of the faint clump is 12.5Gyr. The evolving mass on the HB is represented by the point labelled A (age=12.5Gyr and M=0.646). This mass on the ZAHB has MK=–1.16 (point B). Now we know that the other clump is 0.3mag brighter, so that we shift to MK=–1.46 (point C). This magnitude needs a HB mass of 0.9 (point D), if we are dealing with models of Y=0.29, Z=0.03. The age corresponding to this evolving mass 222This is the age, if the mass loss does not increase with metallicity, otherwhise it must be considered an upper limit to the age is then 7Gyr (point E). Thus the brighter clump is at least 5.5Gyr younger than the fainter clump, as Ferraro et al. (2009) find.
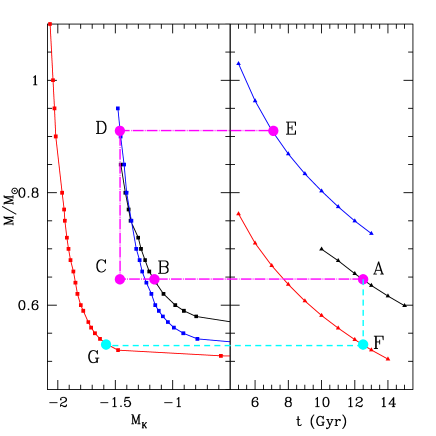
Let us suppose now that the two populations are practically coeval, and that the brighter clump corresponds to a population having Z=0.03 and Y=0.40. In this case, we must have an evolving mass of 0.528 (point F) that has MK=–1.58 on the ZAHB (point G). In this case, the gap in MK between the two populations is the magnitude difference between points B and G (0.42mag). This example shows that a helium increase can easily explain the magnitude difference between the two clumps, without requiring an age difference.
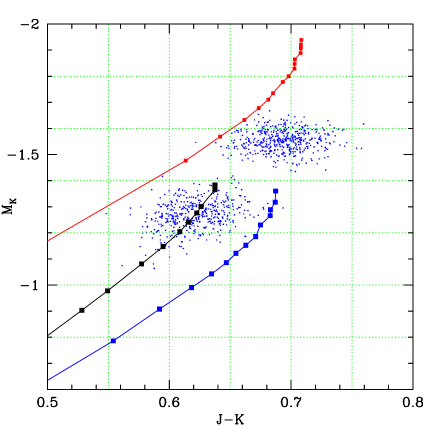
Among the many simulations of the HB, produced to understand the role of the different parameters, Figure 2 shows the simplest one that reproduces the gap of Mmag between the two populations. We assume Y=0.33 for the bright clump. All stars have age 11Gyr, mass loss along the red giant branch M=0.28, with dispersion =0.025. Both the color and luminosity difference of the clumps are reasonably reproduced. The choice of models, age and helium enhancement is not unique. The luminous clump can also be composed of stars with Y varying in the range Y=0.32–0.34, born from ejecta with different helium. If Y0.07 between the two populations, however, the MK gap can not be reproduced. We have assumed for both the FG and SG a solar scaled composition, a reasonable choice for the SG, if its higher metallicity is due to Type Ia SN contamination, that pollute mostly with iron and bring the composition towards the solar–scaled abundances. If the FG is instead –enhanced, and we assume for it [Fe/H]= and [/Fe]=0.4, our models show that the ZAHB shifts to redder J–K, by 0.03mag, and the color difference of the two clumps is reduced. A small reduction of the iron content, within the range allowed by the measurements errors, would reproduce again the color fit.
The iron content of the upper clump may be not unique for all stars, if it is a result of non–homogeneous contamination of the matter forming the SG stars. In this case, a proper interpolation between HBs of different [Fe/H] must be taken into account, but a similar result will be obtained.
Notice that both the FG and the SG clumps “stay in the red”, while the other high metallicity clusters, NGC 6388 ([Fe/H]–0.40) and NGC 6441 ([Fe/H]–0.33) (Carretta et al., 2009c), have HBs extended towards large thanks to the much larger Y of their SG. In fact, the iron content of Terzan 5 is much larger, and the H–burning shell maintains a giant structure and a large radius for HB stars even of relatively small mass. Our models show that we need 0.53 to depart towards larger for Y=0.29 and 0.51 for Y=0.40. Notice that a HB mass of 0.56 occupies the RR Lyr pulsation strip for the FG chemistry. A single RR Lyr and a few blue HB stars have been found in the cluster (Cohn et al., 2002): these may well represent the tail of the mass distribution of HB stars populating either of the red clumps, and it would be interesting to know which one.
4 The chemical evolution of Terzan 5: type II or type Ia SN enrichment?
We have shown that the HB of Terzan 5 may be explained either by two populations with an age difference of 6 Gyr or with two populations that are approximately coeval ((age)100 Myr) but have a different helium content (Y0.07). The latter interpretation would put the formation of Terzan 5 within the theoretical framework suggested for the formation of most GCs with multiple populations (e.g. D’Ercole et al., 2008). However, while in most clusters SG stars have iron abundance similar to FG stars, the iron enhancement in the second generation population of Terzan 5 introduces a new ingredient in that scenario and requires the identification of the source of metal rich gas.
We tentatively identify the helium rich gas with the massive–AGB and super–AGB ejecta (Ventura, D’Antona, & Mazzitelli, 2002; Pumo et al., 2008), and compute the evolution of these stars for the FG composition (Z=0.01), following Ventura & D’Antona (2009). The smallest star igniting carbon in conditions of semi-degeneracy (super–AGB evolution) is the 7.5, evolving at 50Myr. The AGB ejecta have helium abundance between Y=0.36 (7) and Y=0.32 (5), so masses down to 5 (evolving at 100Myr) can fit the SG requirements. We have 100Myr to pollute the AGB ejecta with iron rich material. A change in the iron content from [Fe/H]–0.20.1 to [Fe/H]+0.30.1, assuming Z⊙=0.018, an iron mass fraction f=0.074 from Grevesse & Sauval (1998), and solar–scaled compositions, means an increase in the iron mass fraction by 1.8 in all the SG mass. Assuming that this mass is half of the total mass of the cluster today, say 2.5, the requirement is 456 of iron. We can think of two ways of forming an SG both helium and metal enriched.
1) The helium enriched ejecta are directly polluted by iron produced by supernovae belonging to the cluster itself. If the source of the helium enrichment are the massive stars, as in Decressin et al. (2007) model, the source of the metal enrichment must be the SNII. Each SNII produces only 0.07 of iron (Hamuy, 2003), so we would need 6500 SNII explosions to reach the required iron content, an occurrence that would very likely destroy the cluster, and will not be considered any longer. If the source of helium enrichment are the massive AGBs, like in the dynamical model proposed by D’Ercole et al. (2008), for Terzan 5 we must further require that the second stage of star formation is not halted by the injection of energy from the SN explosions, that generally is regarded as the cause of the end of the SG formation epoch. Below 7.5, as remarked above, stars evolve into carbon oxygen white dwarfs, so that, some time after, SNIa can begin exploding in the cluster. Each SNIa injects in the intracluster medium 0.6 of iron, so we need 760 SNIa explosions. A rate of 1 SNIa every 50000yr can provide this iron in 38Myr, when the AGB ejecta are still as helium rich as needed. If the SG will result to be homogeneous in iron, the model requires that the helium rich AGB gas accumulates, and that the SNIa explode polluting the AGB gas, but not destroying its accumulation. The above back of the envelope computation shows that the requirements for the increase of the iron content may be in principle fulfilled, although with many caveats. In this scenario we expect that in the SG [/Fe]0. As for the other elemental abundances, this model can be easily falsified, as it predicts that the SG should not show the enhanced [Na/Fe] signature typical of GCs. In fact, the AGB gas may well be sodium enhanced with respect to its iron content [Fe/H], but the iron rich mixture forming the SG will necessarily have a low [Na/Fe].
2) The SG matter consists of the low–iron gas, ejected from the cluster AGBs, mixed with the environment gas accreting on the cluster from the neighborhood regions. Due the proximity to the galactic bulge, this gas has been subject to fast metal enrichment, and its iron may be largely supersolar even at a very early epoch, depending on the scenario of formation and evolution of the bulge (e.g. Wyse & Gilmore, 1992). Mixing of the hot–CNO processed gas forming any GC SG with “pristine” gas is a common requirement of models in all clusters showing the signature of the sodium – oxygen anticorrelation (e.g. Prantzos et al., 2007; Bekki et al., 2007). If the AGB gas is diluted with a similar quantity of accreted metal–rich gas, we require that [Fe/H]0.44 in the accreting gas. Such a metal rich matter itself will have a larger than solar helium content, say Y0.30 (Matteucci, private communication, see also Renzini, 1999), so that the very helium rich composition of the mixture forming the SG is a tenable hypothesis too. On the contrary, it is difficult to make predictions on abundances of the other elements since they will come out from the above described mixture of hot–CNO–processed matter (e.g. with low [O/Fe] and large [Na/Fe]) with the bulge iron rich gas. The specific abundances in the bulge gas depend on its precise evolutionary history, still not fully understood (Matteucci et al., 1999; Lecureur et al., 2007; Ballero et al., 2007).
5 Conclusions
We have shown that the split HB of Terzan 5 can be interpreted as due to two populations differing in helium content and metallicity, and not much different in age ((age)100Myr). Massive AGB stellar models for the chemistry of the FG are compatible with the required helium enhancement, but we need that 1) either the AGB matter itself is strongly polluted by SNIa ejecta, before the second stage of star formation begins, or 2) the AGB matter is diluted with accreted gas, fastly processed to very high metallicity in the bulge stellar environment. This suggestion may help to understand the “true” birth of the double population of this cluster, maybe as a mix of age and helium difference in the subsequent star formation events.
We conclude by pointing out that the two alternative scenarios (age or helium difference) predict different values for the bright HB and faint HB masses. Specifically while in the merging scenario the younger age of the bright HB implies that this population would be 0.25 more massive than the faint HB (in Fig.1, the mass difference between points C and D), in the scenario proposed in this paper the two populations would be almost coeval and their red giant progenitors would have only a small mass difference (in the example of Fig. 2, M=0.996 for the bright HB and M=0.979for the faint HB). Further dynamical modelling will help to shed further light on the plausibility of the two scenarios and on the possible dynamical histories leading to the observed differences in the spatial distribution of the two populations.
6 Acknowledgments
This work has been supported through PRIN MIUR 2007 “Multiple stellar populations in globular clusters: census, characterization and origin”. We thank F. Ferraro for useful information on the Terzan 5 observations and F. Matteucci for information on the possible helium content of the bulge.
References
- Ballero et al. (2007) Ballero, S. K., Matteucci, F., Origlia, L., & Rich, R. M. 2007, A&A, 467, 123
- Bekki et al. (2007) Bekki, K., Campbell, S. W., Lattanzio, J. C., & Norris, J. E. 2007, MNRAS, 377, 335
- Bellazzini et al. (2008) Bellazzini, M., et al. 2008, AJ, 136, 1147
- Bessell et al. (1998) Bessell, M. S., Castelli, F., & Plez, B. 1998, A&A, 333, 231
- Caloi & D’Antona (2007) Caloi, V., & D’Antona, F. 2007, A&A, 463, 949
- Carretta et al. (2009a) Carretta, E., et al. 2009a, A&A, 505, 117
- Carretta et al. (2009b) Carretta, E., Bragaglia, A., Gratton, R., & Lucatello, S. 2009b, A&A, 505, 139
- Carretta et al. (2009c) Carretta, E., Bragaglia, A., Gratton, R., D’Orazi, V., & Lucatello, S. 2009c, A&A, 508, 695
- Carretta et al. (2010) Carretta, E., et al. 2010, arXiv:1002.1963, ApJL, in press
- Cohn et al. (2002) Cohn, H. N., Lugger, P. M., Grindlay, J. E., & Edmonds, P. D. 2002, ApJ, 571, 818
- D’Antona & Caloi (2004) D’Antona, F. & Caloi, V. 2004, ApJ, 611, 871
- D’Antona et al. (2005) D’Antona, F., Bellazzini, M., Caloi, V., Pecci, F. F., Galleti, S., & Rood, R. T. 2005, ApJ, 631, 868
- D’Antona & Ventura (2007) D’Antona, F., & Ventura, P. 2007, MNRAS, 379, 1431
- D’Antona & Caloi (2008) D’Antona, F., & Caloi, V. 2008, MNRAS, 390, 693
- Decressin et al. (2007) Decressin, T., Meynet, G., Charbonnel, C., Prantzos, N., & Ekström, S. 2007, A&A, 464, 1029
- D’Ercole et al. (2008) D’Ercole, A., Vesperini, E., D’Antona, F., McMillan, S. L. W., & Recchi, S. 2008, MNRAS, 391, 825
- Feltzing & Gilmore (2000) Feltzing, S., & Gilmore, G. 2000, A&A, 355, 949
- Ferguson et al. (2005) Ferguson J. W., Alexander D. R., Allard F. et al., 2005, ApJ, 623, 585
- Ferraro et al. (2009) Ferraro, F. R., et al. 2009, Nature, 462, 483
- Gratton et al. (2001) Gratton, R. G. et al. 2001, A&A, 369, 87
- Gratton, Sneden & Carretta (2004) Gratton, G., Sneden, C., & Carretta, E. 2004, ARA&A, 42, 385
- Grevesse & Sauval (1998) Grevesse, N., & Sauval, A.J. 1998, SSRv, 85, 161
- Hamuy (2003) Hamuy, M. 2003, ApJ, 582, 905
- Han et al. (2009) Han, S.-I., Lee, Y.-W., Joo, S.-J., Sohn, S. T., Yoon, S.-J., Kim, H.-S., & Lee, J.-W. 2009, ApJ, 707, L190
- Ibata et al. (1994) Ibata, R. A., Gilmore, G., & Irwin, M. J. 1994, Nature, 370, 194
- Iglesias & Rogers (1996) Iglesias C. A. & Rogers F. J., 1996, ApJ, 464, 943
- Lecureur et al. (2007) Lecureur, A., Hill, V., Zoccali, M., Barbuy, B., Gómez, A., Minniti, D., Ortolani, S., & Renzini, A. 2007, A&A, 465, 799
- Marino et al. (2009) Marino, A. F., Milone, A. P., Piotto, G., Villanova, S., Bedin, L. R., Bellini, A., & Renzini, A. 2009, A&A, 505, 1099
- Matteucci et al. (1999) Matteucci, F., Romano, D., & Molaro, P. 1999, A&A, 341, 458
- Norris (2004) Norris, J. E. 2004, ApJ, 612, L25
- Norris & Da Costa (1995) Norris, J. E., & Da Costa, G. S. 1995, ApJ, 447, 680
- Origlia et al. (2008) Origlia, L., Lena, S., Diolaiti, E., Ferraro, F. R., Valenti, E., Fabbri, S., & Beccari, G. 2008, ApJ, 687, L79
- Piotto et al. (2005) Piotto, G., et al. 2005, ApJ, 621, 777
- Piotto et al. (2007) Piotto, G., et al. 2007, ApJL, 661, L53
- Potekhin et al. (1999) Potekhin, A. Y.; Baiko, D. A.; Haensel, P.; Yakovlev, D. G., 1999, A&A, 346, 345P
- Prantzos et al. (2007) Prantzos, N., Charbonnel, C., & Iliadis, C. 2007, A&A, 470, 179
- Pumo et al. (2008) Pumo, M. L., D’Antona, F., & Ventura, P. 2008, ApJ, 672, L25
- Renzini (1999) Renzini, A. 1999, Ap&SS, 267, 357
- Sollima et al. (2005) Sollima, A., Pancino, E., Ferraro, F. R., Bellazzini, M., Straniero, O., & Pasquini, L. 2005, ApJ, 634, 332
- Ventura, D’Antona, & Mazzitelli (2002) Ventura, P., D’Antona, F., & Mazzitelli, I. 2002, A&A, 393, 215
- Ventura & D’Antona (2009) Ventura, P., & D’Antona, F. 2009, A&A, 499, 835
- Ventura et al. (2009) Ventura, P., Caloi, V., D’Antona, F., Ferguson, J., Milone, A., & Piotto, G. P. 2009, MNRAS, 399, 934
- Villanova et al. (2007) Villanova, S., et al. 2007, ApJ, 663, 296
- Wyse & Gilmore (1992) Wyse, R. F. G., & Gilmore, G. 1992, AJ, 104, 144
- Yong et al. (2003) Yong, D., Grundahl, F., Lambert, D. L., Nissen, P. E., & Shetrone, M. D. 2003, A&A, 402, 985
- Yong et al. (2005) Yong, D., Grundahl, F., Nissen, P. E., Jensen, H. R., & Lambert, D. L. 2005, A&A, 438, 875