The number density of superdense early-type galaxies at and the local cluster galaxies
Abstract
Many of the early-type galaxies observed so far at turned out to have smaller radii with respect to that of a typical present-day early-type galaxy with comparable mass. This has generated the conviction that in the past early-type galaxies were more compact, hence denser, and that as a consequence, they should have increased their radius across the time to reconcile with the present-day ones. However, observations have not yet established whether the population of early-types in the early universe was fully represented by compact galaxies nor if they were so much more numerous than in the present-day Universe to require an evolution of their sizes. Here we report the results of a study based on a complete sample of 34 early-type galaxies at . We find a majority (62 per cent) of normal early-type galaxies similar to typical local ones, co-existing with compact early-types from to times smaller in spite of the same mass and redshift. The co-existence of normal and compact early-type galaxies at suggests that their build-up taken place in the first 3-4 Gyr, followed distinct paths. Also, we find that the number density of compact early-types at is consistent with the lower limits of the local number density of compact early-types derived from local clusters of galaxies. The similar number of compact early-types found in the early and in the present day Universe frustrates the hypothesized effective radius evolution while provides evidence that also compact ETGs were as we see them today 9-10 Gyr ago. Finally, the fact that (at least) most of the compact ETGs at high-z are accounted for by compact early-types in local cluster of galaxies implies that the former are the direct progenitors of the compact early-type cluster galaxies establishing a direct link between environment and early phases of assembly of ETGs.
keywords:
galaxies: evolution; galaxies: elliptical and lenticular, cD; galaxies: formation; galaxies: high redshift.1 Introduction
The first studies of scaling relations between effective radius, surface brightness and stellar mass performed on the few early-type galaxies (ETGs) detected at showed that many of them were smaller than the mean local population of ETGs of the same mass (Daddi et al. 2005; di Serego Alighieri et al. 2005; Trujillo et al. 2006). However, some doubts on this finding were raised since these studies were based on Hubble Space Telescope (HST) optical observations sampling the blue and UV rest-frame emission dominated by young stars or on seeing limited ground-based observations, characteristics which can affect the estimate of the effective radius of high-z galaxies. The first deep high-resolution (0.075 arcsec/pix) near-infrared ( m) observations of a sample of 10 ETGs at carried out with the Near Infrared Camera and Multi Object Spectrograph (NICMOS) on-board of HST unambiguously showed that the radii of many of them were 2.5-3 times smaller than the mean radius of local ETGs at comparable mass and surface brightness (Longhetti et al. 2007). Since then, many independent studies found similar results (McGrath et al. 2008; Cimatti et al. 2008; van Dokkum et al. 2008; Damjanov et al. 2009; Muzzin et al. 2009; Cassata et al. 2010; Carrasco et al. 2010) corroborating the conviction that high-redshift compact ETGs must have increased their radius from their redshift to to reconcile their sizes with those of the local ETGs. This hypothesis has triggered many theoretical studies defining the possible mechanisms able to increase the size of ETGs: dry (minor) major merger in which two spheroids of (non) equal mass merge without involving the supposed negligible gas component (e.g. Ciotti et al. 2007; Naab et al. 2009; Nipoti et al. 2009); adiabatic expansion due to a systematic loss of mass from the central region of the galaxy thanks to (e.g.) AGN activity (e.g. Fan et al. 2008); age/color (hence M/L) radial gradients which, as the galaxy ages, tend to vanish resulting in an apparent increase of the effective radius (La Barbera et al. 2009). In principle, any of these models could be tuned to mimic the desired effective radius evolution (Hopkins et al. 2010) even if minor dry mergers seems to be favoured due to its efficiency in enlarging the size of galaxies (e.g. Naab et al. 2009) while the other effects contributing only for 20 per cent (Hopkins et al. 2010; Bezanson et al. 2009). However, Nipoti et al. (2009) have recently shown that dry mergers would introduce substantial scatter in the scaling relations, a scatter not observed locally. Consequently, they conclude that ETGs cannot assemble more than 40 per cent of their mass via dry mergers. Above all, observations have not yet established whether compact ETGs at high-z were so much more numerous than those in the present-day Universe to require the evolution of their effective radius. A recent study suggest that not all the high-z early-types were more compact than typical local counterparts and that those more compact were older than the others (Saracco et al. 2009) analogously to what is observed in the local Universe (Bernardi et al. 2008; Shankar & Bernardi 2009; Valentinuzzi et al. 2010). Thus, the question naturally arising is whether the population of high-z ETGs was actually so different from the population we see today, in particular whether the number density of compact ETGs at high-z was so high to require a size evolution to not exceed the number density of compact ETGs in the local Universe. To look after this issue we constructed a complete sample of ETGs in the redshift range with spectroscopic confirmation of their redshift and covered by HST observations. In this letter we report the analysis we performed and the results we obtained. Throughout this paper we use a standard cosmology with Km s-1 Mpc-1, and . All the magnitudes are in the Vega system, unless otherwise specified.
2 Sample selection and parameters estimate
The sample of ETGs we used in this analysis has been selected on the southern field of the Great Observatories Origins Deep Survey (GOODS-South v2; Giavalisco et al. 2004) and it is complete to K. It has been imaged in four HST-ACS bandpasses (F435W, F606W, F775W and F850LP) and targeted by extensive observations with ESO telescopes both in the optical (3 U-band filters) and in the near-IR (J, H and Ks filters). We used the GOODS-MUSIC multiwavelength catalog (v.2; Grazian et al. 2006) composed of the 10 photometric bands listed above and the four Spitzer-IRAC bands 3.6 m, 4.5 m, 5.8 m and 8.0 m. The spectroscopic data come from the public ESO-VLT spectroscopic survey of the GOODS-South field (Vanzella et al. 2008 and references therein). The sample has been constructed by first selecting all the galaxies brighter than K20.2 over the arcmin2 of the GOODS-South field, then by removing all the galaxies with measured spectroscopic redshift and those with irregular or disk-like morphology. This first step of the morphological classification has been made through a visual inspection of the galaxies carried out independently by two of us on the ACS images in the F850LP band. Finally, on the basis of the best-fitting procedure to the observed profile described below, we removed those galaxies (8) having a Sérsic index or clear irregular residuals resulting from the fit. Out of the 38 early-type galaxies thus selected 34 have measured spectroscopic redshift leading to per cent spectroscopic completeness.
Stellar masses and ages of the stellar populations were derived by fitting the last release of the Charlot & Bruzual models (hereafter CB08) to the observed Spectral Energy Distribution (SED) of the galaxy at fixed known redshift. We considered the Chabrier initial mass function (IMF, Chabrier 2003), four exponentially declining star formation histories (SFHs) with e-folding time Gyr and metallicity 0.4 , and 2 . Extinction has been fitted in the range mag and we adopted the extinction curve of Calzetti et al. (2000). For 90 per cent of the sample the best fitting template is defined by SFHs with Gyr, mag and . The fact that spectral type and redshift of the galaxies are known and that their SED is well sampled from the UV to the near-IR rest-frame implies that the shape of the best-fitting model, depending on the SFH and on the age of the model, is sharply constrained. In particular, the internal accuracy of our stellar mass estimates is within a factor of 1.5 and of age estimate within 0.3 Gyr for age younger than 1.5-2 Gyr and 0.5 Gyr for age older than 2.5 Gyr. In Fig. 1, the best fitting at fixed redshift to the SED of four ETGs of the sample are shown as example.
We derived the effective radius [arcsec] of our galaxies by fitting a Sérsic profile to the observed profile in extremely deep (40-100 ks) HST ACS-F850LP images using Galfit software (v. 2.0.3, Peng et al. 2002). A PSF to be convolved with the Sérsic model has been constructed for each galaxy by averaging the profile of some bright unsaturated stars close to the galaxy itself. We point out that the extremely faint limiting surface brightness of the ACS observations in the F850LP filter ( mag/arcsec2) is 5 magnitudes fainter than the faintest effective surface brightness mag/arcsec2 we measured for our galaxies. This depth allows an accurate sampling of the galaxy profiles at radii assuring the detection of any possible faint wing or halo. This is a critical point in the estimate of the size of ETGs at high-z as shown by Mancini et al. (2010). Indeed, they demonstrate that the lack of high S/N data may result in missing a large fraction of the low surface brightness halo of the galaxy and consequently in underestimating the actual sizes (see also Szomoru et al. 2010). We verified how our estimates compare with those from other studies based on high S/N data of ETGs at by comparing the average size of our ETGs within comparable ranges of stellar masses. At very high stellar masses there are the studies of McGrath et al. (2008) and Mancini et al. (2010) based on the deep HST-NIC2 images and HST-ACS COSMOS images respectively. McGrath et al. studied a sample () in the range M⊙ characterized by kpc. Mancini et al. studied a sample of ETGs () in the range M⊙ whose average effective radius is kpc. There are no ETGs more massive than in our sample. However, we estimate kpc for ETGs in the range M⊙ and kpc in the range M⊙. The ETGs studied by Damjanov et al. (2009) () on deep HST-NIC3 images with masses in the range M⊙ have kpc as those (in the same mass range) at studied by Ferreras et al. (2009) on the deep HST-ACS images of the GOODS fields (North+South). Our ETGs in the range M⊙ have kpc. van der Wel et al. (2005) studied a sample of ETGs on the HST-ACS images of the GOODS-South field 12 out of which ( and masses larger than M⊙) are in common with our sample. The mean radii of these 12 ETGs resulting from their and our estimate are kpc and kpc respectively, in agreement also with the 12 ETGs at studied by Newman et al. (2010) in a comparable mass range (). We have also 8 ETGs in common with the sample studied by Cimatti et al. (2008) 7 out of which in the mass range M⊙. For these ETGs the resulting mean radius is kpc from both the studies. Thus, the average size and scatter we measured for our ETGs agree very well with those found in previous studies based on high S/N HST imaging and spectroscopic redshift. More difficult is the comparison with other studies focused on the population of massive galaxies which usually classify them on the basis of their SED making use of photometric redshift. Recently, Williams et al. (2010) studied the size evolution of a large sample of galaxies selected on the UKIDSS Ultra-Deep Survey (UDS, Warren et al. 2007). The mean radius resulting from the ground-based K-band images of their selected quiescent massive ( M⊙) galaxies is kpc. This estimate, in agreement with the one derived by Franx et al. (2008) on deep ground-based observations of quiescent galaxies in the GOODS-South field, is quite smaller than those reported above for similar mass ranges ( kpc). Similarly, the mean radii ( kpc) estimated by Buitrago et al. (2008) and Trujillo et al. (2007) on shallow (2-4 ks) HST images of passive galaxies at with masses M⊙. The comparison with these studies is made uncertain both by the different methods used to select and classify galaxies and by the quite different data sets: ground-based and/or shallow observations can affect systematically the size of galaxies (e.g. Stabenau et al. 2008 and Mancini et al. 2010) and mass estimate can be affected by the unertainties related to SED fitting (e.g. Longhetti & Saracco 2009; Muzzin et al. 2009; Mancini et al. 2010) especially when the redshift is a free parameter (Stabenau et al. 2008).

3 Superdense early-types at z and the local early-type cluster galaxies
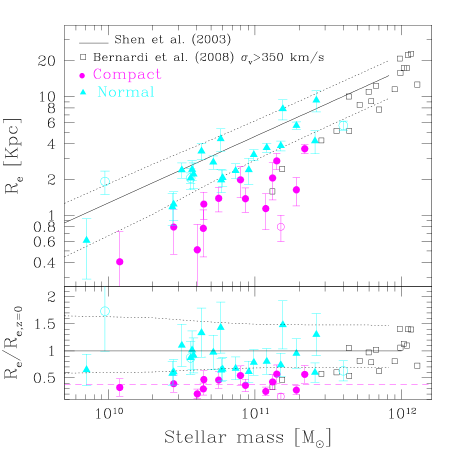
In Fig. 2 the size-mass (SM) relation, the relation between the effective radius Re [kpc] and the stellar mass [M⊙] of our galaxies (filled symbols), is compared with the relation found by Shen et al. (2003) for the local population of ETGs (solid line). The original local relation is based on masses derived using Bruzual and Charlot (2003) models which provide masses times larger than those derived with CB08 models (Longhetti and Saracco 2009). We thus corrected the relation by this scaling factor to make the comparison with our data consistent. It is evident that more than half of the sample, 21 out of 34 ETGs (filled triangles), lies within one sigma from the local SM relation, that is 62 per cent of the sample is composed of ETGs, we say normal, having morphological and physical parameters which agree with the mean local values. The recent measure of the velocity dispersion obtained for three normal ETGs, one of which belonging to the ACS sample (filled triangle marked by open circle in Fig. 2) confirms that they are similar to the typical local ETGs also from the dynamic point of view (Cappellari et al. 2009; Onodera et al. 2010). The remaining per cent (13 galaxies) of the sample is composed of ETGs (filled circles), we say compact, which diverge more than one sigma from the local SM relation having effective radii from to times smaller than the radius derived from the local relation for the same mass. This is better shown in the lower panel of Fig. 2 where the degree of compactness, defined as the ratio between the effective radius Re and the effective radius Re,z=0 of an equal mass galaxy at as derived from the local SM relation, is plotted as a function of the mass. The recent attempt to measure the velocity dispersion of a compact galaxy (van Dokkum et al. 2009; red open circle in Fig. 2) seems to confirm an higher stellar mass density than in normal early-types. It is interesting to note that ETGs more compact than the mean local value exist for any value of the effective radius and of the stellar mass spanned by our sample. Moreover, the degree of compactness does not show any dependence on mass. Thus, it is clear that the population of high-z ETGs is not primarily composed of superdense ETGs but it is dominated by normal ETGs similar to local ones. We also report in Fig. 2 the 29 brightest cluster galaxies with km/s selected by Bernardi et al. (2008) in local cluster of galaxies (open squares). They populate the SM relation at high masses ( M⊙) and a few of them (5-6) are compact.
The critical question is whether the number density of compact ETGs in the early Universe was so high to require that they have increased their radii to not exceed the number density of compact ETGs in the present-day Universe, in practice whether compact ETGs were much more numerous at earlier epochs, or if their number has not changed across the time. A recent estimate by Valentinuzzi et al. (2010) fixes the lower limit of the number density of compact ETGs in the local Universe considering compact ETGs only in local clusters of galaxies and assuming that no compact ETGs are present among the population of non-cluster galaxies. They find a lower limit of Mpc-3 for stellar masses M⊙ and of Mpc-3 for masses M. Their local densities have been computed considering compact those ETGs diverging more than one sigma from the local SM relation of Shen et al. (2003), according to our definition (Valentinuzzi, private communication). We find that the comoving number density of compact ETGs over the volume of about Mpc3 sampled by the GOODS area between (average redshift ) is compatible even with the local lower limits. In particular, we find Mpc-3 for masses M⊙ and Mpc-3 for masses M⊙. van Dokkum et al. (2010) and Guo et al. (2009) indicate that Shen et al. (2003) might have underestimated the sizes of massive galaxies by a factor of up to two. We point out that the method used to define and compare compact ETGs in our and in the Valentinuzzi et al. sample (1 from the SM relation) takes the results away from any possible systematics in the local relation since it would affect the selection of compact ETGs at high and at low redshift in the same way. We computed the co-moving spatial density and stellar mass density of early-type galaxies and its statistical uncertainty using the estimator where
| (1) |
is the comoving volume. The solid angle subtended by the 143 arcmin2 of the GOODS field is strd, is the minimum redshift considered and is the maximum redshift at which each galaxy would be still included in the sample resulting still brighter than K=20.2. In Table 1 we summarize our estimates for different ranges of masses and of effective radii. Given the high spectroscopic completeness (90 per cent) of our sample, the derived values could be underestimated by a factor 1.1. Moreover, even in the hypothesis that our selection of ETGs was too conservative and some of the 8 galaxies removed (see §2) because of their low Sérsic index () or their irregular residuals were ETGs, the underestimate would not exceed a factor 1.2. To assess the reliability of our estimates, we compared our number densities of ETGs with those in previous studies. Wuyts et al. (2009) and Bezanson et al. (2009) estimate a number density of quiescent galaxies of Mpc-3 and Mpc-3 for masses M⊙ and M⊙ respectively. Besides the different criterion used to classify galaxies and the use of photometric redshift, their masses are derived from the Bruzual & Charlot (2003) models with Kroupa IMF which is found to provide masses from 1.2 (Longhetti et al. 2009) to (e.g. Pozzetti et al. 2007; Cimatti et al. 2008) times larger than those provided by the CB08 models with Chabrier IMF. Taking into account a scaling factor of 1.5, we estimate a number density of ETGs Mpc-3 and Mpc-3 in the same mass ranges, without considering any correction for incompleteness. Cimatti et al. (2008) estimates a number density Mpc-3 for masses M⊙ while we estimate Mpc-3. We do not try to make a comparison of the number densities of ”compact” ETGs only with other studies since it would result extremely uncertain and unreliable. Indeed, besides the uncertainties discussed above related to the different data sets and criteria used to select quiescent or early-type galaxies, this comparison would be affected also by the different criteria used to define ”compact” galaxies (e.g. R kpc and M⊙, Trujillo et al. 2009; R van Dokkum et al. 2009).
From the comparison shown in Tab. 1, we see that the number density of compact ETGs at high-z is comparable to local values independently of the mass range and effective radius considered, that is with the number density of compact early-types in cluster galaxies. Thus, we do not find evidence of an evolution of the number density of compact ETGs from to z=0 and, consequently, of their effective radius during the last 9-10 Gyr.
M⊙ M⊙ Mpc-3 Mpc-3 M⊙ Mpc-3 Mpc-3 Mpc-3 7 3(2) 0.4(0.2)0.2 0.5 12 5(3) 0.8(0.5)0.4 0.8 25 11(7) 2.2(1.4)0.7 1.8 33 13(8) 3.4(2.3)1.0 2.4 kpc M⊙ Mpc-3 Mpc-3 M⊙ Mpc-3 Mpc-3 Mpc-3 5 4(2) 1.7(1.0)1.0 0.6 24 9(6) 1.7(1.2)0.6 1.7 15 3(3) 0.5(0.3)0.3 0.6
4 Discussion and conclusions
The high spectroscopic completeness and the deep HST imaging of the GOODS-South field have allowed us to select a complete sample of 34 ETGs with K at on the basis of their redshift and morphology. Only 13 of them diverge more than one sigma from the local size-mass relation having effective radii from to times smaller than the radii derived from the SM relation for the same masses. Their number density does not exceed the one measured in the local Universe. Indeed, our analysis shows that the young Universe contained nearly the same number of compact early-type galaxies than present-day Universe and, consequently, that the hypothesis of their growth in radius in the last 9-10 Gyr is not justified. On the contrary, this provides evidence that they were as we see them today even 9-10 Gyr. Actually, Mancini et al. (2010) reached similar conclusion for very high-mass ( M⊙) ETGs at and more recently Newman et al. (2010) show that M⊙ ETGs do not show signs of size evolution at while estimate a possible evolution for larger masses. It is important to note that these and our results obtained over the redshift range imply that if the compact ETGs detected at (e.g. van Dokkum et al. 2008) are actually all so small and represent most of the population of ETGs at that redshift, then the size evolution they should undergo must take place over a very short period of about 1 Gyr. This would be difficult to account for by mergers in current models (see also Newman et al. 2010). The previously claimed size evolution was proposed to explain the apparently large number of compact galaxies found in the many of the first samples of high-z ETGs. This enhanced number could be probably due to selection and observational biases that remain to be uderstood. Recent studies conducted on local samples of galaxies point out that the selection of old galaxies, the criterion usually used to select high-z early-type galaxies, is strongly biased toward smaller ETGs for fixed mass (Bernardi et al. 2008; Shankar et al. 2009; Valentinuzzi et al. 2010; Napolitano et al. 2010). In addition, the surface brightness dimming acts against the detection of the extended halos of ETGs resulting in a systematic underestimates of their sizes when high resolution and high S/N data are not available (e.g. Stabenau et al. 2008 and Mancini et al. 2010). This could justify why many of the samples of high-z ETGs constructed so far are mostly composed of compact ETGs. We finally point out that to find a significant (2 sigma at least) excess of compact ETGs at high-z with respect to the local lower limits we should detect two times more ETGs than what actually detected.
Also, our analysis shows that when the Universe was only 3-4 Gyr old ETGs fully compatible with typical local ones were the majority and, most importantly, co-existed with other ETGs having stellar mass densities from 10 to 100 times higher in spite of the same redshift and the same stellar mass. This result, confirming previous finding (Saracco et al. 2009), places the origin of the degree of compactness in the first 3 Gyr of the Universe suggesting that compact and normal ETGs are the result of different assembly histories. We further investigate this issue in a forthcoming paper (Saracco et al. 2010). The fundamental questions arising are what is that set out and which is the assembly history accounting for the composite population of ETGs observed at . In this regard, it is important to point out the other result we obtained: the population of compact ETGs at high-z is nearly accounted for by the local population of compact early-type cluster galaxies. This implies that most of the compact ETGs at high-z are the direct progenitors of the local early-type cluster galaxies. This establishes a direct link between environment and compactness suggesting that the environment can play a major role in the early phase of assembly of ETGs. Finally, it is reasonable to hypothesize that some of them may increase further their mass through possible merging events in the last 9-10 Gyr. In this case, those already massive at may transform into brightest cluster galaxies whose stellar velocity dispersions ( km/s) are compatible with those expected for high-mass compact ETGs at high-z.
Acknowledgments
This work is based on observations made with the ESO telescopes at the Paranal Observatory and with the NASA/ESA Hubble Space Telescope, obtained from the data archive at the Space Telescope Science Institute which is operated by the Association of Universities for Research in Astronomy. This work has received financial support from ASI (contract I/016/07/0). We are particularly grateful to Tiziano Valentinuzzi and Bianca Poggianti for having provided us with the spatial density of compact early-types in local cluster of galaxies computed according to our definition. We thank Mariangela Bernardi for having provided us with the stellar masses of the BCGs with km/s.
5 References
Bernardi, M., Hyde, J. B., Fritz, A., Sheth, R. K., Gebhardt, K., Nichol, R. C. A., 2008, MNRAS, 391, 1191
Bezanson R., van Dokkum P. G., Tomer T., Marchesini D., Kriek D., Franx M., Coppi P. 2009, ApJ, 697, 1290
Bruzual A.,G. & Charlot S. 2003, MNRAS 344, 1000
Buitrago F., Trujillo I., Conselice C. J., Bouwens R. J., Dickinson M., Yan H. 2008, ApJ, 687, L61
Calzetti D., Armus L., Bohlin R. C., Kinney A. L., Koorneef J., Storchi-Bergmann T. 2000, ApJ, 533, 682
Cappellari M., di Serego Alighieri S., Cimatti A., et al. 2009,ApJ, 704, L34
Carrasco E. R., Conselice C. J., Trujillo I. 2010, MNRAS, 405, 2253
Cassata P., et al. 2010, ApJ, 714, L79
Chabrier G. 2003, PASP, 115, 763
Cimatti A., et al. 2008, A&A, 482, 21
Ciotti L., Lanzoni B., Volonteri M. 2007, ApJ, 658, 65
Daddi E., Renzini A., Pirzkal N., et al. 2005, ApJ, 626, 680
Damjanov I., McCarthy P. J., Abraham R. G., et al. 2009, ApJ, 695, 101
di Serego Alighieri S., et al. 2005, A&A, 442, 125
Fan, L., Lapi, A., De Zotti, G., Danese, L., 2008, ApJ, 689, L101
Ferreras I., Lisker T., Pasquali A., Khochfar S., Kaviraj S. 2009, MNRAS, 369, 1573
Franx M., van Dokkum P. G., Frster Schreiber N., Wuyts S., Labbé I., Toft S. 2008, ApJ, 688, 770
Giavalisco, M., Dickinson, M., Ferguson, H. C., et al. 2004, ApJ, 600, L103
Grazian A., et al. 2006, A&A, 449, 951
Guo Q., White S. 2009, MNRAS, 396, 39
Hopkins, P., Bundy, K., Hernquist, L., Wuyts, S., Cox, T. J. 2010, MNRAS, 401, 1099
Kurk J., et al. 2009, A&A, 504, 331
La Barbera F., de Carvalho R. R., ApJ, 699, L76
Longhetti M., et al., 2007, MNRAS, 374, 614
Longhetti M., Saracco P. 2009, MNRAS, 394, 774
McGrath E., Stockton A., Canalizo G., Iye M., Maihara T. 2008, ApJ, 682, 303
Mancini, C., Daddi E., Renzini A., et al. 2010, MNRAS, 401, 933
Muzzin A., van Dokkum P. G., Franx M., Marchesini D., Kriek M., Labbé I. 2009, ApJ, 706, L188
Naab T., Johansson P. H., Ostriker J. P. 2009, ApJ, 699, L178
Napolitano N. R., Romanowsky A. J., Tortora C. 2010, MNRAS, 405, 2351
Newman A. B., Ellis R. S., Treu T., Bundy K. 2010, ApJ, 717, L103
Nipoti C., Treu T., Auger M. W., Bolton A. S. 2009, ApJ, 706, L86
Onodera M. et al. 2010, ApJ, 715, L60
Peng C.Y., Ho L.C., Impey C.D. & Rix H-W 2002, AJ 124, 266
Pozzetti L, et al. 2007, A&A, 474, 443
Saracco P., Longhetti M., Andreon S., 2009, MNRAS, 392, 718
Saracco P., Longhetti M., Gargiulo A. 2010, MNRAS, submitted
Shankar F., Bernardi M. 2009, MNRAS, 396, L76
Shen S., et al., 2003, MNRAS, 343, 978
Stabenau H. F., Connolly A., Jain B. 2008, MNRAS, 387, 1215
Szomoru D., et al. 2010, ApJ 714, L244
Trujillo I., Feulner G., Goranova Y., et al. 2006, MNRAS, 373, L36
Trujillo I., Conselice C. J., Bundy K., Cooper M. C., Eisenhardt P., Ellis R. S. 2007, MNRAS, 382, 109
Trujillo I., Cenarro A. J., de Lorenzo-Cáceres A., Vazdekis A., de la Rosa I. G., Cava A. 2009, MNRAS, 692, L118
Valentinuzzi T., et al. 2010, ApJ, 712, 226
van der Wel A., Franx M., van Dokkum P. G., Rix H.-W., Illingworth G. D., Rosati P., 2005, ApJ, 631, 145
van Dokkum P. G., et al. 2008, ApJ, 677, L5
van Dokkum P. G., Kriek M., Franx M. 2009, Nature, 460, 717
van Dokkum P. G., et al. 2010, ApJ, 709, 1018
Vanzella E., et al. 2008, A&A, 478, 83
Warren S. J., et al. 2007, MNRAS, 375, 213
Williams R. J., Quadri R. F., Franx M., van Dokkum P., Toft S., Kriek M., Labbé I. 2010, ApJ, 713, 738
Wuyts S., et al. 2009, ApJ, 700, 799